
Most Requested Symbols

We take a look at how active managers fared across various markets in the first quarter.
The average distribution reading is 19.19% overbought.
Today's featured stock is Resideo Technologies, Inc. (REZI)
AGCO, AHCO, DKNG, ENSG, HAS, MANH, MGA, NET, ROKU, SBUX & WK
Call: Tempur Sealy International (TPX), Put: Stratasys (SSYS), Covered Write: Lennar Corp (LEN)
With Tuesday’s (4/13) trading action, the Invesco QQQ Trust QQQ rallied to a new all-time high at $340, breaking a double top and returning the chart to a buy signal. Along with the Q’s, there were a few stocks that bettered or match their all-time highs. NVIDIA NVDA, Starbucks SBUX, and Monster Energy MNST were each able to make new all-time highs during Tuesday’s action, while Keurig Dr. Pepper KDP was able to match and Microsoft MSFT better its all-time high from the previous day.

With only a few stocks moving to new highs in tandem with the Q’s, we wanted to look to see what stocks were contributing to the rally within the Nasdaq 100 and the Q’s the most. Looking at Bloomberg data since the beginning of the second quarter, and we see some familiar names are leading the charge. In the table below we have the top 20 stocks that have contributed to the performance of the QQQ since the beginning of Q2. Microsoft MSFT, Apple AAPL, and Amazon AMZN have been the top contributors to the performance of the ETF. Furthermore, 14 out of the 20 are high attribute names (above 3), while five of the 20 are low attribute names (2 or below). In many cases, the low attribute names contributing to performance are stocks that are rebounding or are stocks that have trended positively but have lagged on a relative basis.


(Source: etf.com)

Upcoming Event: NDW Spring Virtual Symposium
Thursday, April 29, 2021, 12 - 4 PM ET via Zoom
Join us for a complimentary virtual half-day event that will provide attendees with in-depth knowledge on how to use Point & Figure Relative Strength to create a scalable, repeatable investment process to sharpen their value proposition and business. Click here to view the event agenda.
Event sessions include:
*CFP® certification: This program has been accepted for 4.5 hours of CE credit. Nasdaq Dorsey Wright will report attendance on your behalf to the CFP Board approximately two weeks after the event.
**CIMA®, CPWA®, RMA℠ certifications: This program has been approved for up to 4 hours of CE credit. A benefit to attending the Spring Virtual Symposium is that CE credit hours will be automatically reported on your behalf and reflected in your online account approximately two weeks after the event.

While the first quarter of 2021 was not particularly volatile, especially when compared with the prior year, there was quite a bit of shuffling nonetheless. After leading the DALI domestic equity sector rankings almost continuously for three-plus years (except for a few short weeks in June ’20 when it fell to second) technology ceded its leadership and fell to fifth. Meanwhile, financials and energy climbed from near the bottom of the rankings all the way to their current positions in the top three. After underperforming for much the last several years, value came back into favor, significantly outperforming growth in both the large and small cap categories. After steadily rising in 4Q20, US Treasury yields accelerated dramatically. The US Treasury 10-year Yield Index TNX topped out at 1.75% after starting the quarter at under 1%, resulting in large declines for long-duration bonds, which had been among the best fixed income performers in 2020.
The shifting market landscape of the first quarter offered an opportunity for active managers to outperform their passive benchmarks. For example, large cap equity managers could have gained an advantage over the S&P 500 SPX by underweighting technology, the largest sector in the index by weight, and overweighting areas like financials and energy, while active fixed managers would have benefited from reducing the duration of their portfolios to reduce the impact of rising rates.
Of course, just because there was an opportunity for outperformance does not mean that managers were able to capitalize on it. Moreover, outperformance (or lack thereof) by active managers in one market does not mean that active management outperformed across the board. As we have discussed previously, the key determinate of which is superior, active or passive, is the level of market efficiency. The level of efficiency varies across markets, so when comparing passive vs. active management we need to do so on a market-by-market basis. Today, we’ll take a look at the performance rankings of several passive benchmarks to see how active management fared in the first quarter of 2020; if the passive benchmark ranked in the bottom two quartiles (below the 50th percentile) then a majority of the active managers in that market were able to outperform. Conversely, if the benchmark was below the 50th percentile, then most active managers in the space underperformed. Today we are looking only at how active management fared during the last quarter, so if you would like to see how it’s done over longer time periods, you can find that information in this piece from last year that examined rolling five-year rankings.
Large Cap Domestic Equity
The S&P 500 generated a total return of just under 6.2% in 1Q21, however, the index finished in the third quartile of the eVestment US large cap equity universe. This may be one of the more surprising results - over the past several years domestic large cap equity has been one of the most difficult markets for active managers. In our longer-term piece last year, which looked at rolling-five year returns, there was not a single period in which the S&P 500 finished below the 50th percentile. While one quarter's results are certainly not enough to say that active is back in favor in large cap, the fact that most active managers were able to outperform the benchmark in a quarter with generally strong returns, may mean that active management still has something to offer in the large cap space, which has seen large asset flows into passive strategies.

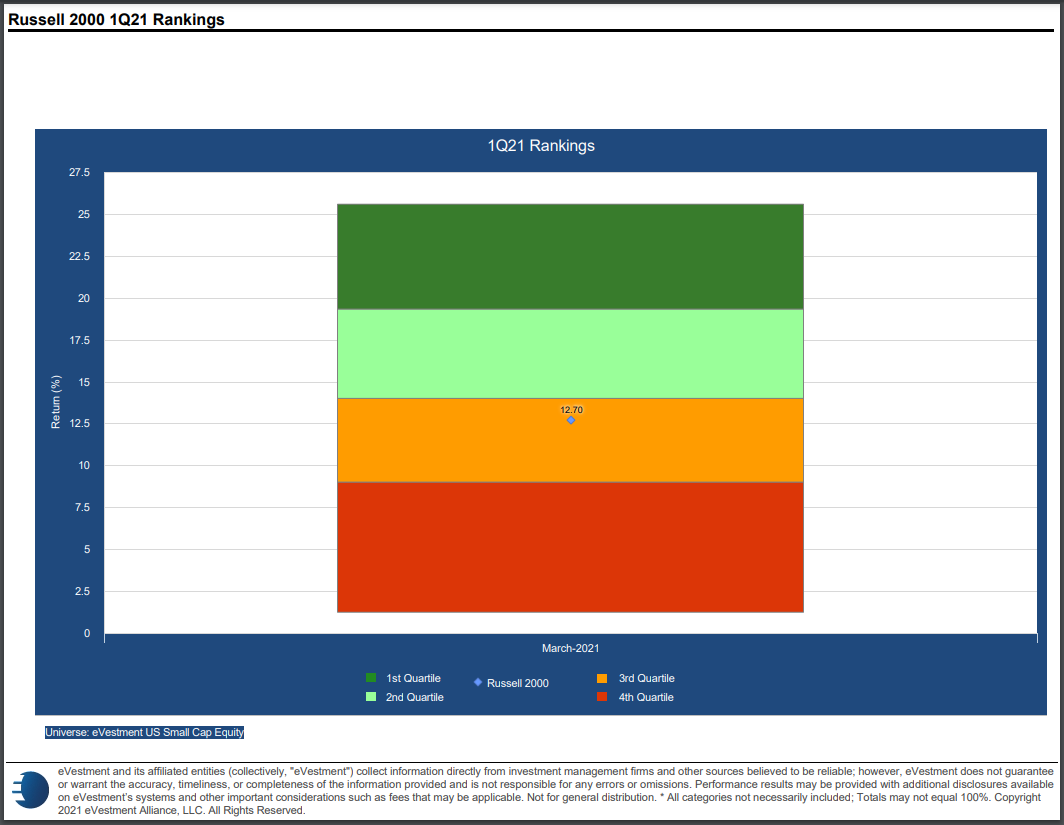
Small Cap Domestic Equity
The Russell 2000 also delivered strong absolute numbers in the third quarter and finished below the 50th percentile. This is perhaps less surprising than the result in large cap as small cap has generally been more favorable to active managers over the long-term.
International Developed Equity
Developed international managers also generally outperformed their benchmark as the MSCI EAFE Index finished in the third quartile. As with small cap equity, this is mostly in line with what we've seen over the longer-term as the passive index has often finished at or below the halfway mark.

Emerging Market Equity
Except for a lower absolute performance number the emerging market chart looks much like the developed international as the MSCI Emerging Markets also finished in the third quartile. This is also in line with the general longer-term trend

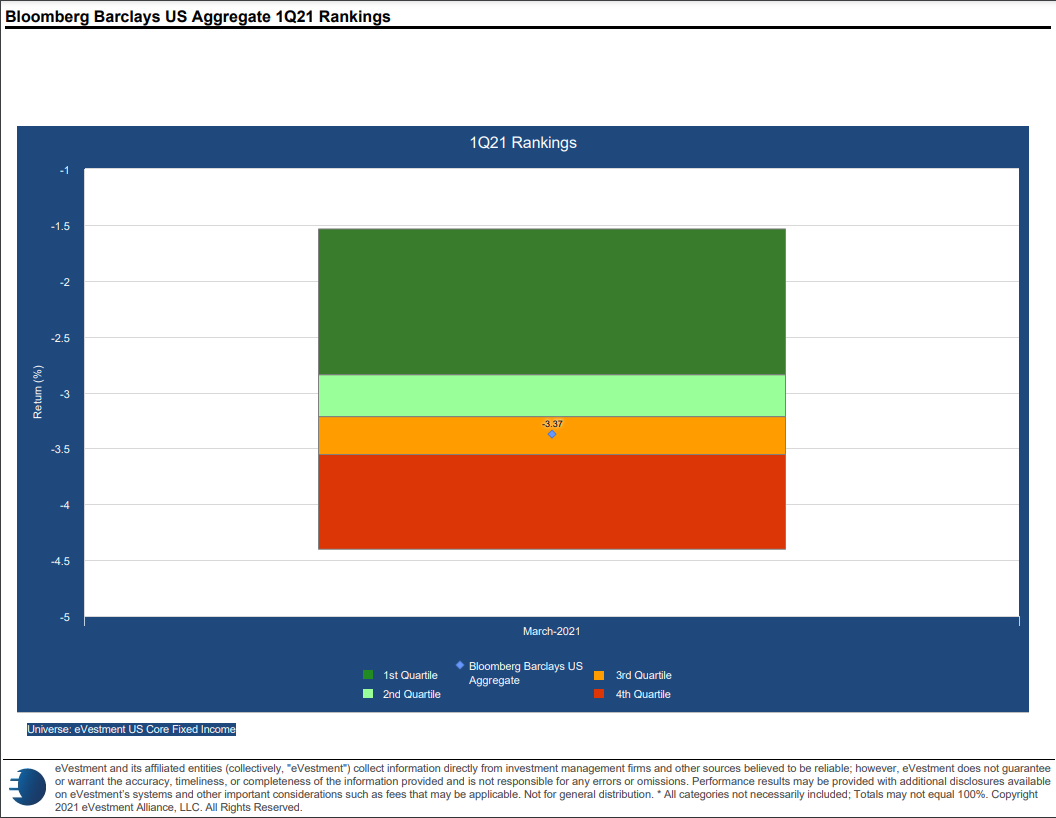
Domestic Fixed Income
The Bloomberg Barclays US Aggregate was down nearly -3.4% in Q1 and finished in the third quartile of the eVestment Core Fixed Income Universe. The surprise here may be that the index didn't rank lower as it has quite often been in the bottom quartile over longer periods. One possibility may be that active managers were caught off guard by the velocity of rising yields during the quarter.

POWRSHARES Change
There is a change to the Invesco Commodity Model POWRSHARES this week: buy the Invesco DB Base Metals Fund DBB and sell the Invesco DB Energy Fund DBE. DBE was removed because its rank in the model’s relative strength matrix fell below the threshold to remain a holding in the portfolio. In place of DBE, the model added DBB as it was the highest-ranking fund in the matrix that was not already a holding in the model. This is the second change to the model this year... (Read more)
First Trust: Q1 Overview
And just like that, the first quarter of 2021 is in the books. With that said, we wanted to take this time to review the performance and activity of the First Trust ETF Models over the last quarter. First Trust Focus 5 Model FTRUST5: The equity market finished the first quarter on a positive note with the S&P 500 SPX rallying nearly 6% while the First Trust Focus 5 Model was up nearly 10% for the quarter. We have seen some notable rotation occurring among the sector rankings recently, which has caused some changes to the Focus 5 Model this year. Earlier in the year (January)... (Read more)
KraneShares: Quarterly Performance Review
This week will cover our quarterly review for the KraneShares Dynamic China Rotation Model after the first three months of 2021. The model posted a return of -1.83% in the first quarter, underperforming the benchmark FXI.TR, which gained 0.50%. However, the mode continues to outpace the benchmark over a trailing 12-month timeframe, at a gain of 55.41% compared to 27.21%. There were two changes to the model in the first three months of the year, with the KraneShares CSI China Internet ETF KWEB being purchased on January 11 and then sold on March 29. The model begins Q2 with six of the equity-focused funds included as model holdings... (Read more)

Average Level 19.19
| AGG | iShares US Core Bond ETF |
| USO | United States Oil Fund |
| DIA | SPDR Dow Jones Industrial Average ETF |
| DVY | iShares Dow Jones Select Dividend Index ETF |
| DX/Y | NYCE U.S.Dollar Index Spot |
| EFA | iShares MSCI EAFE ETF |
| FXE | Invesco CurrencyShares Euro Trust |
| GLD | SPDR Gold Trust |
| GSG | iShares S&P GSCI Commodity-Indexed Trust |
| HYG | iShares iBoxx $ High Yield Corporate Bond ETF |
| ICF | iShares Cohen & Steers Realty ETF |
| IEF | iShares Barclays 7-10 Yr. Tres. Bond ETF |
| LQD | iShares iBoxx $ Investment Grade Corp. Bond ETF |
| IJH | iShares S&P 400 MidCap Index Fund |
| ONEQ | Fidelity Nasdaq Composite Index Track |
| QQQ | Invesco QQQ Trust |
| RSP | Invesco S&P 500 Equal Weight ETF |
| IWM | iShares Russell 2000 Index ETF |
| SHY | iShares Barclays 1-3 Year Tres. Bond ETF |
| IJR | iShares S&P 600 SmallCap Index Fund |
| SPY | SPDR S&P 500 Index ETF Trust |
| TLT | iShares Barclays 20+ Year Treasury Bond ETF |
| GCC | WisdomTree Continuous Commodity Index Fund |
| VOOG | Vanguard S&P 500 Growth ETF |
| VOOV | Vanguard S&P 500 Value ETF |
| EEM | iShares MSCI Emerging Markets ETF |
| XLG | Invesco S&P 500 Top 50 ETF |
| Symbol | Company | Sector | Current Price | Action Price | Target | Stop | Notes |
|---|---|---|---|---|---|---|---|
| NX | Quanex Building Products Corporation | Building | $27.38 | mid 20s | 38 | 21 | 4 for 5'er, top half of favored BUIL sector matrix, bullish catapult, 1.3% yield |
| BHF | Brighthouse Financial Inc. | Insurance | $46.65 | low to mid 40s | 64 | 35 | healthy 5 for 5'er, top 1/3 of favored DWAINSU sector matrix, consec buy signals, pullback from multi-year high |
| ACHC | Acadia Healthcare Company Inc | Healthcare | $59.43 | hi 50s - low 60s | 69 | 48 | 5 for 5'er, top 20% of HEAL sector matrix, bullish catapult |
| EVH | Evolent Health | Software | $20.18 | low to mid 20s | 38.5 | 17 | 5 for 5'er, consec buy signals, top of DWASOFT matrix, one box from bullish triangle |
| HEES | H&E Equipment Services, Inc. | Building | $37.91 | mid-to-upper 30s | 51 | 31 | 5 for 5'er, top 25% of BUIL sector matrix, multiple buys, bullish catapult, 2.9% yield |
| AEIS | Advanced Energy Industries | Electronics | $119.53 | hi 110s - low 120s | 132 | 96 | 4 for 5'er, top third of ELEC sector matrix, spread triple top, pos wkly mom flip Earn. 5/4 |
| EB | Eventbrite, Inc. Class A | Internet | $22.77 | low to mid 20s | 37 | 18.50 | 5 for 5'er, consec buy signals, top 10% of DWAINET matrix, pos trend |
| SPB | Spectrum Brands Holdings | Food Beverages/Soap | $91.76 | hi 80s - low 90s | 103 | 74 | 5 for 5'er, top 20% of FOOD sector matrix, quad top breakout, pos wkly mom flip, 1.9% yield, Earn. 4/28 |
| CFR | Cullen/Frost Bankers Inc | Banks | $111.28 | upper 100s - mid 110s | 122 | 91 | 4 for 5'er, favored BANK sector matrix, multiple buys, pullback from multi-year high, 2.7% yield, Earn. 4/28 |
| REZI | Resideo Technologies, Inc. | Protection Safety Equipment | $28.16 | high 20s to low 30s | 43.50 | 22 | 5 for 5'er, consec buy signals, pullback from multi-year highs, #1 in DWAPROT |
| Symbol | Company | Sector | Current Price | Action Price | Target | Stop | Notes |
|---|
| Symbol | Company | Sector | Current Price | Action Price | Target | Stop | Notes |
|---|---|---|---|---|---|---|---|
| DKS | Dick's Sporting Goods, Inc. | Retailing | $83.50 | mid 70s - low 80s | 101 | 66 | See follow comment below. |
| Comment |
|---|
| DKS Dick's Sporting Goods, Inc. R ($81.75) - Retailing - Okay to add new exposure here. We will maintain our $66 stop. |
REZI Resideo Technologies, Inc. R ($27.46) - Protection Safety Equipment - REZI is a perfect 5 for 5’er that ranks #1 in the protection safety equipment sector that is trading well above the bullish support line (i.ie in an overall positive trend). Additionally, REZI has given three consecutive buy signals since December, confirming that demand is in control. After reaching a new multi-year high in March at $31, REZI pulled back to $27 but has since reversed back up into Xs, putting the chart two boxes away from a fourth consecutive buy signal as well as a retest of the all-time high printed in 2018 at $32. New positions are welcome in the high 20s to low 30s. We will set our initial stop at $22 which would violate multiple levels of support and we will use REZI’s bullish price objective of $43.50 as our near-term price target.
| 19 | 20 | 21 | |||||||||||||||||||||||||||||||||||||||||||||||||||
| 31.00 | X | 31.00 | |||||||||||||||||||||||||||||||||||||||||||||||||||
| 30.00 | X | O | 4 | 30.00 | |||||||||||||||||||||||||||||||||||||||||||||||||
| 29.00 | X | X | O | X | 29.00 | ||||||||||||||||||||||||||||||||||||||||||||||||
| 28.00 | X | O | X | O | X | Mid | 28.00 | ||||||||||||||||||||||||||||||||||||||||||||||
| 27.00 | • | X | O | 3 | O | 27.00 | |||||||||||||||||||||||||||||||||||||||||||||||
| 26.00 | X | • | X | 2 | O | X | 26.00 | ||||||||||||||||||||||||||||||||||||||||||||||
| 25.00 | X | O | • | X | O | X | O | X | 25.00 | ||||||||||||||||||||||||||||||||||||||||||||
| 24.00 | X | O | • | X | O | X | O | 24.00 | |||||||||||||||||||||||||||||||||||||||||||||
| 23.00 | 2 | 3 | 5 | • | 1 | O | 23.00 | ||||||||||||||||||||||||||||||||||||||||||||||
| 22.00 | 1 | O | X | O | 6 | • | X | 22.00 | |||||||||||||||||||||||||||||||||||||||||||||
| 21.00 | X | O | 4 | O | X | O | • | X | 21.00 | ||||||||||||||||||||||||||||||||||||||||||||
| 20.00 | X | O | X | O | X | O | • | X | X | 20.00 | |||||||||||||||||||||||||||||||||||||||||||
| 19.50 | O | X | O | 7 | • | X | X | X | C | O | X | Bot | 19.50 | ||||||||||||||||||||||||||||||||||||||||
| 19.00 | O | X | O | • | X | O | X | O | X | O | X | O | X | 19.00 | |||||||||||||||||||||||||||||||||||||||
| 18.50 | O | X | 8 | • | X | O | X | O | X | O | X | O | X | 18.50 | |||||||||||||||||||||||||||||||||||||||
| 18.00 | O | O | • | X | O | O | X | O | O | X | 18.00 | ||||||||||||||||||||||||||||||||||||||||||
| 17.50 | O | • | X | O | X | O | 17.50 | ||||||||||||||||||||||||||||||||||||||||||||||
| 17.00 | O | • | X | O | X | 17.00 | |||||||||||||||||||||||||||||||||||||||||||||||
| 16.50 | O | • | X | O | X | 16.50 | |||||||||||||||||||||||||||||||||||||||||||||||
| 16.00 | O | X | • | X | O | • | 16.00 | ||||||||||||||||||||||||||||||||||||||||||||||
| 15.50 | O | X | O | • | X | • | 15.50 | ||||||||||||||||||||||||||||||||||||||||||||||
| 15.00 | O | X | O | A | • | X | • | 15.00 | |||||||||||||||||||||||||||||||||||||||||||||
| 14.50 | O | 9 | O | X | O | • | X | X | • | 14.50 | |||||||||||||||||||||||||||||||||||||||||||
| 14.00 | O | X | O | X | O | • | X | O | X | • | 14.00 | ||||||||||||||||||||||||||||||||||||||||||
| 13.50 | O | X | O | O | • | X | X | O | X | • | 13.50 | ||||||||||||||||||||||||||||||||||||||||||
| 13.00 | O | O | • | X | O | X | O | X | • | 13.00 | |||||||||||||||||||||||||||||||||||||||||||
| 12.50 | O | X | • | X | 7 | O | X | 9 | X | X | • | 12.50 | |||||||||||||||||||||||||||||||||||||||||
| 12.00 | O | X | O | • | X | O | X | 8 | X | O | X | O | X | • | 12.00 | ||||||||||||||||||||||||||||||||||||||
| 11.50 | O | X | O | • | X | O | X | O | X | O | A | O | B | • | 11.50 | ||||||||||||||||||||||||||||||||||||||
| 11.00 | O | X | 1 | • | • | X | O | O | X | O | X | O | X | • | 11.00 | ||||||||||||||||||||||||||||||||||||||
| 10.50 | O | B | X | X | O | X | X | • | X | O | O | X | O | X | • | 10.50 | |||||||||||||||||||||||||||||||||||||
| 10.00 | O | X | O | X | O | X | 2 | X | O | X | O | X | O | O | • | 10.00 | |||||||||||||||||||||||||||||||||||||
| 9.50 | O | X | O | X | O | X | O | X | O | X | O | X | • | 9.50 | |||||||||||||||||||||||||||||||||||||||
| 9.00 | O | O | C | O | X | 3 | X | O | • | 9.00 | |||||||||||||||||||||||||||||||||||||||||||
| 8.50 | O | O | X | • | 8.50 | ||||||||||||||||||||||||||||||||||||||||||||||||
| 8.00 | O | X | • | 8.00 | |||||||||||||||||||||||||||||||||||||||||||||||||
| 7.50 | O | 6 | • | 7.50 | |||||||||||||||||||||||||||||||||||||||||||||||||
| 7.00 | O | X | • | 7.00 | |||||||||||||||||||||||||||||||||||||||||||||||||
| 6.50 | O | X | • | 6.50 | |||||||||||||||||||||||||||||||||||||||||||||||||
| 6.00 | O | X | X | X | • | 6.00 | |||||||||||||||||||||||||||||||||||||||||||||||
| 5.50 | O | X | X | O | X | 5 | O | X | • | 5.50 | |||||||||||||||||||||||||||||||||||||||||||
| 5.00 | O | X | O | X | O | X | O | X | O | X | • | 5.00 | |||||||||||||||||||||||||||||||||||||||||
| 4.75 | O | X | O | X | 4 | X | O | X | O | • | 4.75 | ||||||||||||||||||||||||||||||||||||||||||
| 4.50 | O | X | O | X | O | X | O | X | • | 4.50 | |||||||||||||||||||||||||||||||||||||||||||
| 4.25 | O | X | O | X | O | X | O | X | • | 4.25 | |||||||||||||||||||||||||||||||||||||||||||
| 4.00 | O | O | O | X | O | • | 4.00 | ||||||||||||||||||||||||||||||||||||||||||||||
| 3.75 | O | • | • | 3.75 | |||||||||||||||||||||||||||||||||||||||||||||||||
| 19 | 20 | 21 |
| AGCO AGCO Corporation ($149.48) - Machinery and Tools - Shares of AGCO advanced on Tuesday to break a double top at $150, marking a fresh all-time-high and fifth consecutive buy signal. The 5 for 5'er ranks in the top decile of the machinery and tools stock sector matrix and continues to complete a series of higher tops and bottoms. The weight of the evidence is positive here. Initial support is offered at around $134. |
| AHCO ADAPTHealth Corp ($29.79) - Finance - AHCO fell from $38 on the chart down to $29. In the process, AHCO broke a double bottom and violated the bullish support line at $32, and then proceeded to take out very notable support at $30, the February and March 2021 lows. AHCO will now become a 2 for 5'er with a negative trend. Look to trim exposure to the stock either here or on a possible bounce from this low. From here, support lies at $28 and $26. |
| DKNG DraftKings Inc Class A ($59.25) - Gaming - DKNG broke a double bottom at $57, a move that marked the second consecutive sell signal on the chart. This move also violated the bullish support line, which downticks the stock to a weaker 2 for 5’er. Avoid for now as supply is in control and DKNG is trading in a negative trend. Additional support is available at $55. |
| ENSG Ensign Group, Inc. ($92.00) - Healthcare - ENSG broke a double bottom at $91 completing a bearish triangle. This comes after completing a bullish triangle last month. The stock remains a 5 for 5'er that ranks within the top quartile of the Healthcare sector matrix. Recent action has brought the stock down to support at $91 and a partial position could be considered on a reversal back into X's at $94. Further exposure could be considered up the return to a buy signal at $96. Support lies at the bullish support line at $88. |
| HAS Hasbro, Inc. ($98.92) - Leisure - HAS completed a bullish catapult pattern on Tuesday, marking the second consecutive buy signal on the chart. Although this is an improvement, HAS remains a low attribute name. We will continue to monitor for any improvement and stay on the sidelines until then. Note earnings are expected on 4/27 and HAS yields 2.86%. |
| MANH Manhattan Associates, Inc. ($123.61) - Software - MANH moved higher Tuesday to break a double top at $124, marking a second consecutive buy signal. This 3 for 5'er moved to a positive trend in November and ranks in the top third of the software sector RS matrix. The near-term technical picture is improving. Initial support can be found at $116, which is also the current location of the bullish support line. Further support can be found at $114 and $112. Earnings are expected on 4/27. |
| MGA Magna Intl Inc CL A ($92.88) - Autos and Parts - MGA broke a double top at $92 before moving higher to test its all-time high from March at $95 with Tuesday’s price action. MGA is a 3 for 5’er within the autos and parts sector that is trading well above the bullish support line. From here, support sits at $88. Note earnings are expected on 5/5. |
| NET Cloudflare Inc Class A ($78.10) - Computers - Shares of NET advanced Tuesday to break a double top at $74 before reaching $79 to post an intraday gain of over 12%. This also pushed through the bearish resistance line to place NET back in a positive trend. The stock is now a 3 for 5'er that has been on an RS buy signal against the market since February of 2020. Initial support can be found at $69. Earnings are expected on 5/6. |
| ROKU Roku, Inc. Class A ($384.42) - Media - ROKU completed a spread triple top today with a move to $380 before moving higher to $384. ROKU is an acceptable 3 for 5’er within the media sector that just experienced a flip to positive weekly momentum. From here, support sits at $364 while ROKU faces resistance at $424. Note earnings are expected on 5/5. |
| SBUX Starbucks Corporation ($115.24) - Restaurants - SBUX broke a double top at $114, marking a new all-time high on the chart in addition to the fourth consecutive buy signal. SBUX is a 2 for 5’er within the favored restaurants sector that has experienced two weeks of positive weekly momentum. At this time, SBUX is a lower attribute name however it has maintained a long-term market RS buy signal since 2009 and is trading in a positive trend. We will continue to monitor SBUX for further improvement. From here, support sits at $106. Note earnings are expected on 4/27. |
| WK Workiva Inc. ($98.62) - Internet - WK rose Tuesday to break a double top at $96 before reaching $98 intraday. This 4 for 5'er moved to a positive trend in June of last year and ranks in the top half of the internet sector RS matrix. The stock has also maintained an RS buy signal against the market since late-2017. Initial support can be found at $92, while further overhead resistance may come at $104. |
| Name | Option Symbol | Action | Stop Loss |
|---|---|---|---|
| Tempur Sealy International Inc. - $38.83 | TPX2117I35 | Buy the September 35.00 calls at 6.30 | 35.00 |
| Name | Option | Action |
|---|---|---|
| Twitter, Inc ( TWTR) | Jun. 60.00 Calls | Raise the option stop loss to 12.05 (CP: 14.05) |
| Name | Option Symbol | Action | Stop Loss |
|---|---|---|---|
| Stratasys Inc - $23.88 | SSYS2117U25 | Buy the September 25.00 puts at 5.20 | 28.00 |
| Name | Option | Action |
|---|---|---|
|
|
||
| Name | Option Sym. | Call to Sell | Call Price | Investment for 500 Shares | Annual Called Rtn. | Annual Static Rtn. | Downside Protection |
|---|---|---|---|---|---|---|---|
| Lennar Corporation $104.86 | LEN2120H110 | Aug. 110.00 | 5.40 | $49,715.70 | 27.12% | 12.26% | 4.15% |
| Name | Action |
|---|---|
| Alcoa Inc. (AA) - 31.77 | Sell the July 30.00 Calls. |
| Occidental Petroleum Corporation (OXY) - 24.23 | Sell the August 28.00 Calls. |
| Tanger Factory Outlet Centers (SKT) - 16.82 | Sell the June 17.00 Calls. |
| Navient Corporation (NAVI) - 14.85 | Sell the July 15.00 Calls. |
| Nordstrom, Inc. (JWN) - 37.58 | Sell the July 40.00 Calls. |
| United States Steel Corporation (X) - 21.23 | Sell the July 26.00 Calls. |
| First Horizon Corp. (FHN) - 17.45 | Sell the August 18.00 Calls. |
| Tripadvisor Inc (TRIP) - 51.13 | Sell the June 57.50 Calls. |
| UNUMProvident Corporation (UNM) - 28.58 | Sell the September 30.00 Calls. |
| Name | Covered Write |
|---|---|
| Simon Property Group, Inc. ( SPG - 114.74 ) | July 120.00 covered write. |
Daily Equity & Market Analysis
LISTEN TO PODCAST
Apr 02, 2026
Loading, Please Wait...
