
Most Requested Symbols

We take a look at how investors can gain exposure to a several parts of the commodities market via ETFs.
The average distribution level is 30.62% overbought.
Today's featured stock is Performance Food Group Co Formerly (PFGC)
ALGT, CDAY, CWH, CZR, DMRC, GHL, LE, NTAP.
Call: Micron Technology (MU), Put: Kellogg Company (K), Covered Write: Morgan Stanley (MS)
Beginners Series Webinar: Join us on Friday, February 26th, at 2 PM (ET) for our NDW Beginners Series Webinar. This week's topic is Using the Dashboard & Account Preferences. Register Here.
It was another large down day for markets, especially for the smaller sizes and high fliers of months past. That said, we wanted to provide a few bullet points to summarize the recent market action:
On a different note, we saw small cap value moved into the fourth ranked DALI size and style group for the first time since 2014. Although outpacing mid cap blend by just one relative strength buy signal now, the move further underscores the strength in smaller sizes along with value-oriented areas of the market. Last time small cap value moved into the fourth ranked DALI size and style group it sat there for about 134 days before stalling out; however, as depicted below, most small cap value rallies in the past 15 years were short lived – climbing to the fourth rank to only cool off about a month later (the exception being 2008-2009). While large cap equities have been a dominant force for the better part of the past decade, we did see small cap value demonstrate exceptional leadership in the early 2000s, more specifically January 2003 – July 2007, where the group held the number one rank for 1,222 days (just over three years). This, albeit loosely and on average, aligns with a recent factor study conducted by Russell which empirically demonstrated that size and value have anticipated subsequent inflections in GDP growth, or when the outlook for the economy is favorable (Source: ftserussell.com). Although small cap value has not been able to sustain leadership in the past, market dynamics are constantly changing and it will be interesting to see if this time is any different.


As we have mentioned recently, inflation expectations have increased to their highest levels in years. One of most common methods of positioning a portfolio for rising inflation is to include an allocation to commodities. As a result, many investors may be wondering about the best way to gain exposure to commodities. Prior to the inception of ETFs commodities were largely only accessible via futures which were primarily the domain of institutional investors. ETFs now offer average investors relatively easy access to commodities. However, there are a few differences between equity and commodity ETFs to be cognizant of.

Many ETFs gain exposure to commodities via futures contracts which means that most of these funds will generate a K-1, unless they use a structure specifically designed to avoid it. Other ETFs, specifically precious metals ETFs, are backed by physical metal and are taxed as collectibles, which is typically a higher tax rate than capital gains. Finally, there are ETNs, ETNs don’t hold futures or physical commodities, they are a debt obligation of the issuer. These funds are not taxed as collectibles and they don’t generate a K-1; however, investors in ETNs are exposed to the credit risk of the issuer. Below is a list of commodities and funds that can be used to gain exposure to each.
Crude Oil
The largest oil ETF on the market in terms of assets is the United States Oil Fund USO with over $3 billion in AUM. USO gains exposure to crude oil through futures contracts and investors in the fund will receive a K-1. The fund holds futures contracts up to ten months out, so there will be some difference in the performance of USO and the front month oil contract, which is what is typically quoted when discussing the daily performance of oil. This brings up another point about ETFs that hold futures – roll yield. In a normal market the oil futures curve is in backwardation, i.e., the futures price is below the spot price. If the price remains the same, the futures contracts that the fund holds “roll” up the curve to the spot price, generating positive roll yield. When the market is in contango, the opposite is true, which produces negative roll yield. Roll yield is not the most important aspect to the overall performance of oil ETFs, but is a factor to be aware of. You can check to see the current state of the oil futures curve on the CLCONTANGO chart.
Those who do not want to receive a K-1 can consider the Proshares K-1 Free Crude Oil Strategy OILK. Like USO, OILK also gains exposure to oil via futures contracts; however, it is structured to avoid generating a K-1. One thing worth noting is that, while many people try to avoid a K-1, typically the K-1 tax treatment is actually better.
Gold
The largest gold ETF on the market is the SPDR Gold Trust GLD. GLD, like most other gold ETFs on the market, holds physical gold and will receive the collectibles tax treatment discussed above. Another large gold ETF is the iShares Gold Trust IAU; IAU also holds physical gold so avoiding the collectibles tax treatment may not be possible through ETFs here.
Silver
The iShares Silver Trust SLV is by far the largest silver ETF on the market with more than $17 billion in AUM. Like GLD, SLV also holds physical silver. Investors who want exposure to silver but without the unfavorable tax treatment could utilize an ETF like the Global X Silver Miners ETF SIL. SIL is an equity ETF that holds silver mining companies; while the performance of these stocks is correlated to the price of silver it does not offer the pure exposure of a fund like SLV.
Those who want exposure to a basket of precious metals in a single ETF could consider the Invesco DB Precious Metals Fund DBP. DBP currently holds 76.70% gold and 23.3% silver. Unlike most other precious metals funds, DBP’s portfolio consists of futures. This means that investors in the fund will receive a K-1, which may provide more favorable tax treatment than funds that hold the physical metals.

Industrial Metals
The largest industrial metals ETF is the Invesco DB Base Metals Fund DBB. DBB’s portfolio includes copper, aluminum, and zinc. As with the Invesco’s precious metals fund, the fund holds futures and thus investors will receive a K-1.
Investors looking for exposure only to copper can consider the United States Copper Fund CPER. Like DBB, CPER gains its metals exposure through futures, so investors will receive a K-1.
There are funds that offer exposure to single industrial metals including tin, aluminum, and lead; however, all of these funds have low levels of assets, many under $10 million. As a result, liquidity may be poor, and they are likely excluded from the approved list at many firms.
General Commodities
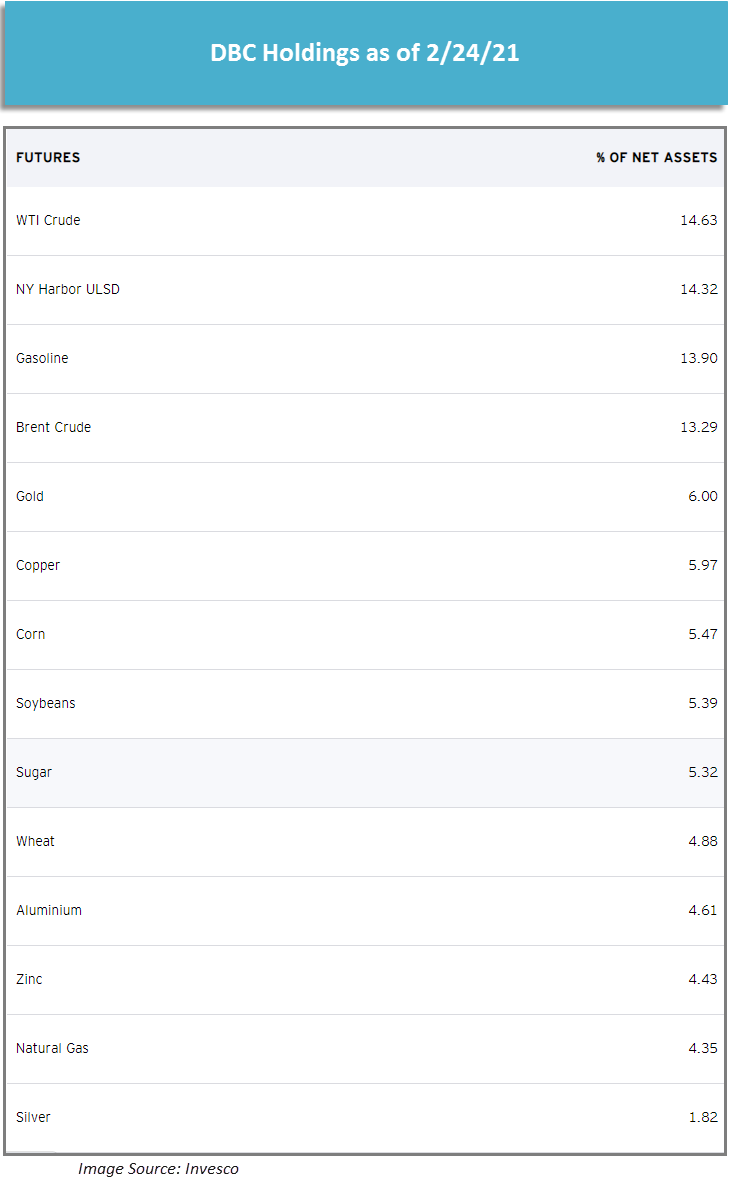
There are options for those who want exposure to a basket of commodities in a single fund, like the Invesco DB Commodity Index Tracking Fund DBC. DBC offers exposure to a wide range of commodities including crude oil, natural gas, precious metals, copper, industrial metals, and agricultural products. DBC does generate a K-1.
Luckily for those who want general commodities exposure without a K-1, DBC has a K-1 free counterpart, the Invesco Optimum Yield Diversified Commodity Strategy No K-1 ETF PDBC. PDBC offers exposure to the same basket of commodities as DBC.
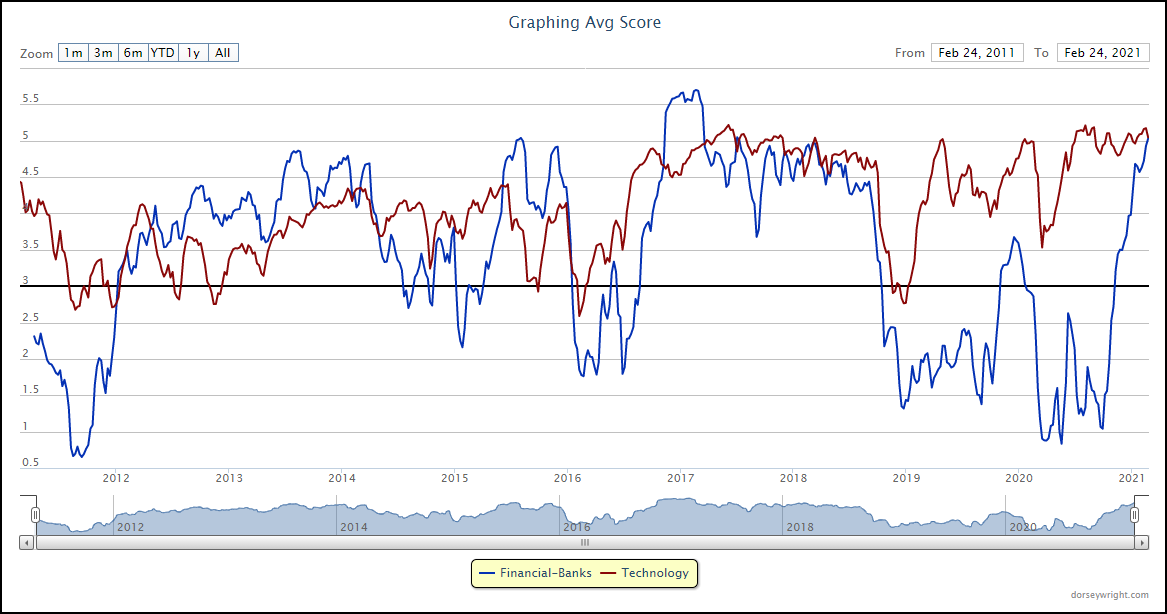
The rise in volatility across domestic equity markets over the past week led to some rotation among the sector view of the Asset Class Groups Scores (ACGS) page. The financial-banks group continued higher to an average score posting of 5.07, making it the highest-scoring sector representative on the ACGS page, and the third-highest scoring group out of all 135 groups through trading Wednesday. Financial-banks beat out technology for the top-ranked sector position, although the technology group still sits in close proximity to the top position with an average score of 5.00. This high score position for financial banks comes after a prolonged period of underperformance, as the space had scored lower than the technology group since May 2018. Although the financial-banks group only has data available dating to early-2011, this almost three-year period of underperformance marks its longest such stretch in the group’s history. In fact, the two groups were separated by almost 3 full score points in September of last year, which was also the largest score dispersion the two areas had seen. Since that time, technology largely moved sideways in score, remaining in a high field position but not necessarily improving. The financial-banks group, however, stormed higher, which is indicated by its average score direction of 4.00. While the technology space has not begun to deteriorate in score all that much, the vast outperformance of other sectors in recent weeks certainly speaks to the increased likelihood of further weakness moving forward.
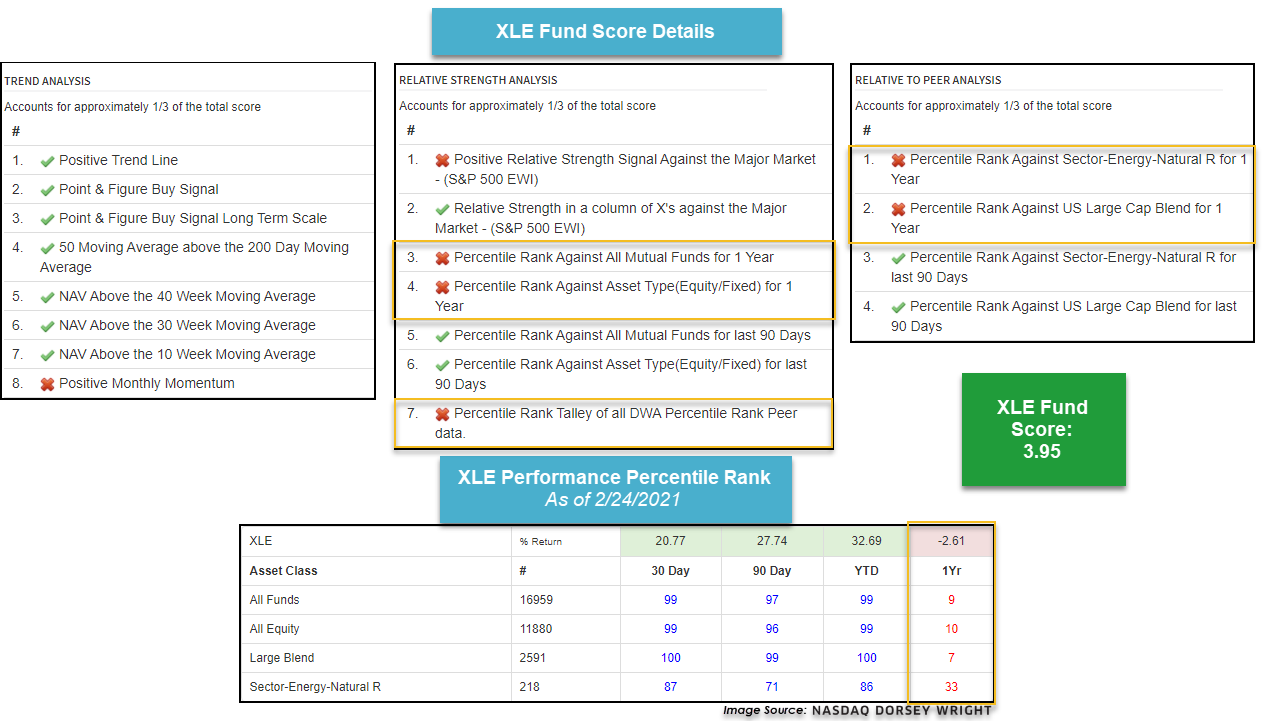
Another group that has shown significant improvement is the energy-natural resources space, which is closing in on the 4-score threshold at a recent group score posting of 3.95. This marks the highest score territory for energy since April 8, 2011, when the group briefly moved north of 4.00 for a single trading day. Other than that instance, you need to travel back to before the 2008 meltdown in commodities to find the group in higher score territory. With the energy space moving significantly higher this week in the DALI rankings, you may be wondering why the group still sits in a lower relative position on the ACGS page. The answer to that question lies in the differences between the strictly relative strength-based rankings underlying DALI, and the variety of factors that go into the fund score system that underlies the ACGS page. As a refresher, a fund score is made up of 19 different factors, which a separated into thirds: trend analysis, relative to market analysis, and relative to peer analysis.

We will use the Energy Select Sector SPDR Fund XLE as an example for the broader energy space, as the broad representative also possesses a recent score posting of 3.95. In looking at the score details, we can see that the majority of trend analysis factors are positive for XLE, which makes sense given the fund's 32.69% year-to-date return. However, many of the relative to market and peer comparisons incorporate 1-year trailing performance percentile rankings, and XLE still sits in a low field position with a loss of 2.61% over that time frame. If XLE and other energy funds continue to demonstrate relative strength over other domestic equity areas, these percentile rankings have the potential to move higher fairly quickly.

Average Level
30.62
| AGG | iShares US Core Bond ETF |
| USO | United States Oil Fund |
| DIA | SPDR Dow Jones Industrial Average ETF |
| DVY | iShares Dow Jones Select Dividend Index ETF |
| DX/Y | NYCE U.S.Dollar Index Spot |
| EFA | iShares MSCI EAFE ETF |
| FXE | Invesco CurrencyShares Euro Trust |
| GLD | SPDR Gold Trust |
| GSG | iShares S&P GSCI Commodity-Indexed Trust |
| HYG | iShares iBoxx $ High Yield Corporate Bond ETF |
| ICF | iShares Cohen & Steers Realty ETF |
| IEF | iShares Barclays 7-10 Yr. Tres. Bond ETF |
| LQD | iShares iBoxx $ Investment Grade Corp. Bond ETF |
| IJH | iShares S&P 400 MidCap Index Fund |
| ONEQ | Fidelity Nasdaq Composite Index Track |
| QQQ | Invesco QQQ Trust |
| RSP | Invesco S&P 500 Equal Weight ETF |
| IWM | iShares Russell 2000 Index ETF |
| SHY | iShares Barclays 1-3 Year Tres. Bond ETF |
| IJR | iShares S&P 600 SmallCap Index Fund |
| SPY | SPDR S&P 500 Index ETF Trust |
| TLT | iShares Barclays 20+ Year Treasury Bond ETF |
| GCC | WisdomTree Continuous Commodity Index Fund |
| VOOG | Vanguard S&P 500 Growth ETF |
| VOOV | Vanguard S&P 500 Value ETF |
| EEM | iShares MSCI Emerging Markets ETF |
| XLG | Invesco S&P 500 Top 50 ETF |
*We originally noted NET as hitting its stop which was incorrect and has been corrected. NET Cloudflare Inc Class A remains above its $68 stop.
| Symbol | Company | Sector | Current Price | Action Price | Target | Stop | Notes |
|---|---|---|---|---|---|---|---|
| NSC | Norfolk Southern Corporation | Transports/Non Air | $261.78 | high 230s to low 260s | 316 | 196 | 5 for 5'er, pullback from ATH, LT market RS buy signal, pos trend |
| HON | Honeywell International, Inc. | Aerospace Airline | $211.03 | 198 - 220 | 270 | 162 | 4 for 5'er, pullback from ATH, fav DWAAERO, consec buy signals, LT market RS buy |
| HCA | HCA Healthcare Inc. | Healthcare | $175.43 | 170s - low 180s | 222 | 142 | 4 for 5'er, top half of favored HEAL sector matrix, LT pos mkt RS, pullback from ATH, 1.1% yield, pot. cov. write |
| ADTN | ADTRAN, Inc. | Telephone | $17.51 | 16 - 18 | 25 | 13.50 | 5 for 5'er, top 25% of TELE sector matrix, multiple buy signals, pullback from multi-year high, 2.2% yield, R-R>3.0 |
| MDC | M.D.C. Holdings, Inc. | Building | $58.73 | mid-to-upper 50s | 85 | 46 | 4 for 5'er, favored BUIL sector matrix, pullback from multi-year high, 2.4% yield, pot. cov write, R-R>2.0 |
| EVR | Evercore Inc. | Finance | $124.17 | mid 110s - mid 120s | 172 | 102 | 4 for 5'er, 8th of 70 names in favored FINA sector matrix, pullback from ATH, 2% yield |
| CENX | Century Aluminum Co | Metals Non Ferrous | $15.65 | 14 - 16 | 26.50 | 11.50 | 5 for 5'er, top 20% of favored META sector matrix, pos wkly & mnthly mom flips, R-R>3.0 |
| CSX | CSX Corporation | Transports/Non Air | $93.37 | high 80s to mid 90s | 106 | 75 | 4 for 5'er, LT market & Peer RS buy, pos trend, pullback from ATH, pos weekly mom flip |
| CCJ | Cameco Corporation | Metals Non Ferrous | $16.16 | 15 - 17 | 25.50 | 13 | 5 for 5'er, top quartile of favored META sector matrix. pos wkly mom flip, R-R~3.0 |
| PFGC | Performance Food Group Co Formerly | Food Beverages/Soap | $55.52 | low/mid 50s to high 50s | 73 | 44 | 5 for 5'er, all-time high, top 25% of DWAFOOD, consec buy signals, pos trend |
| Symbol | Company | Sector | Current Price | Action Price | Target | Stop | Notes |
|---|
| Symbol | Company | Sector | Current Price | Action Price | Target | Stop | Notes |
|---|---|---|---|---|---|---|---|
| NYT | The New York Times Company | Media | $52.28 | low-to-mid 50s | 83 | 43 | See follow comment below. |
| Comment |
|---|
| LPX Louisiana-Pacific Corporation R ($48.30) - Forest Prods/Paper - Raise stop to $38, the second consecutive sell signal on the default chart. |
| LPSN LivePerson, Inc. R ($58.91) - Computers - LPSN hit our stop. We will exit on today's bounce. |
| LASR nLIGHT, Inc. R ($37.82) - Semiconductors - LASR hit our stop. |
| INTU Intuit Inc. R ($391.27) - Software - Raise stop to $336, which would take out multiple levels of support on the chart. |
PFGC Performance Food Group Co Formerly R ($54.39) - Food Beverages/Soap - PFGC is a perfect 5 for 5’er within the favored food beverages/soap sector that ranks in the top quartile of the sector RS matrix. Furthermore, PFGC is trading well above the bullish support line and most recently printed a new all-time high at $55 where the stock trades today. There have been two consecutive buy signals given this month, confirming that demand is in control. Overall, the weight of the evidence is positive for PFGC. Okay to add new exposure in the low/mid 50s to high 50s. We will set our initial stop at $44 and will use the bullish price objective of $73 as our-near term price target.
| 18 | 19 | 20 | 21 | ||||||||||||||||||||||||||||||||||||||||||||||||||
| 55.00 | • | X | 55.00 | ||||||||||||||||||||||||||||||||||||||||||||||||||
| 54.00 | X | • | X | X | 54.00 | ||||||||||||||||||||||||||||||||||||||||||||||||
| 53.00 | 2 | X | O | • | X | O | X | 53.00 | |||||||||||||||||||||||||||||||||||||||||||||
| 52.00 | 1 | O | X | O | • | X | X | O | X | 52.00 | |||||||||||||||||||||||||||||||||||||||||||
| 51.00 | X | O | X | O | • | X | X | X | O | X | O | X | 51.00 | ||||||||||||||||||||||||||||||||||||||||
| 50.00 | X | O | O | • | X | O | X | O | X | O | X | O | X | 50.00 | |||||||||||||||||||||||||||||||||||||||
| 49.00 | X | O | • | X | O | 1 | O | X | O | 2 | O | Mid | 49.00 | ||||||||||||||||||||||||||||||||||||||||
| 48.00 | C | O | • | X | O | X | X | O | X | O | X | 48.00 | |||||||||||||||||||||||||||||||||||||||||
| 47.00 | X | X | O | • | X | O | X | X | O | X | O | O | X | 47.00 | |||||||||||||||||||||||||||||||||||||||
| 46.00 | X | O | X | O | • | X | O | X | O | C | O | X | O | X | 46.00 | ||||||||||||||||||||||||||||||||||||||
| 45.00 | 8 | O | B | O | • | X | O | X | O | X | O | X | O | 45.00 | |||||||||||||||||||||||||||||||||||||||
| 44.00 | X | A | X | O | • | X | O | X | O | X | O | 44.00 | |||||||||||||||||||||||||||||||||||||||||
| 43.00 | X | O | X | O | • | X | O | X | O | 43.00 | |||||||||||||||||||||||||||||||||||||||||||
| 42.00 | 7 | O | O | • | X | O | 42.00 | ||||||||||||||||||||||||||||||||||||||||||||||
| 41.00 | X | X | 3 | • | X | 41.00 | |||||||||||||||||||||||||||||||||||||||||||||||
| 40.00 | 4 | O | X | O | • | X | X | 40.00 | |||||||||||||||||||||||||||||||||||||||||||||
| 39.00 | 7 | X | O | X | O | • | X | X | O | X | 39.00 | ||||||||||||||||||||||||||||||||||||||||||
| 38.00 | X | O | X | X | 5 | O | • | 9 | O | X | O | X | Bot | 38.00 | |||||||||||||||||||||||||||||||||||||||
| 37.00 | 6 | O | X | O | X | • | O | • | X | O | A | O | X | 37.00 | |||||||||||||||||||||||||||||||||||||||
| 36.00 | X | O | X | O | 2 | • | O | • | X | O | X | O | X | 36.00 | |||||||||||||||||||||||||||||||||||||||
| 35.00 | X | X | 8 | O | X | X | • | O | X | X | O | X | O | B | 35.00 | ||||||||||||||||||||||||||||||||||||||
| 34.00 | 1 | O | X | O | X | O | 1 | • | O | X | X | O | X | O | X | O | X | 34.00 | |||||||||||||||||||||||||||||||||||
| 33.00 | X | O | 5 | O | X | O | X | • | O | X | O | X | O | X | O | O | X | 33.00 | |||||||||||||||||||||||||||||||||||
| 32.00 | X | 2 | X | O | B | C | X | • | O | X | O | X | O | O | 32.00 | ||||||||||||||||||||||||||||||||||||||
| 31.00 | C | O | X | A | X | O | • | O | X | X | O | X | 31.00 | ||||||||||||||||||||||||||||||||||||||||
| 30.00 | B | O | X | O | X | • | O | X | X | O | X | O | X | 30.00 | |||||||||||||||||||||||||||||||||||||||
| 29.00 | 9 | 4 | O | • | O | X | O | X | O | 6 | O | X | X | 8 | 29.00 | ||||||||||||||||||||||||||||||||||||||
| 28.00 | X | • | • | O | X | X | O | X | 5 | X | O | X | O | X | O | X | 28.00 | ||||||||||||||||||||||||||||||||||||
| 27.00 | X | • | O | X | O | X | O | X | O | X | O | X | O | X | O | X | • | 27.00 | |||||||||||||||||||||||||||||||||||
| 26.00 | • | O | X | O | X | O | X | O | X | O | X | O | X | 7 | X | • | 26.00 | ||||||||||||||||||||||||||||||||||||
| 25.00 | • | O | X | X | O | X | O | X | O | X | O | O | O | • | 25.00 | ||||||||||||||||||||||||||||||||||||||
| 24.00 | • | O | X | O | X | O | X | O | X | O | X | • | 24.00 | ||||||||||||||||||||||||||||||||||||||||
| 23.00 | O | X | O | X | 4 | X | O | X | O | X | • | 23.00 | |||||||||||||||||||||||||||||||||||||||||
| 22.00 | O | O | X | O | O | O | X | • | 22.00 | ||||||||||||||||||||||||||||||||||||||||||||
| 21.00 | O | X | O | X | • | 21.00 | |||||||||||||||||||||||||||||||||||||||||||||||
| 20.00 | O | X | X | O | • | 20.00 | |||||||||||||||||||||||||||||||||||||||||||||||
| 19.50 | O | X | O | X | • | 19.50 | |||||||||||||||||||||||||||||||||||||||||||||||
| 19.00 | O | X | O | X | • | 19.00 | |||||||||||||||||||||||||||||||||||||||||||||||
| 18.50 | O | X | O | X | • | 18.50 | |||||||||||||||||||||||||||||||||||||||||||||||
| 18.00 | O | X | O | X | • | 18.00 | |||||||||||||||||||||||||||||||||||||||||||||||
| 17.50 | O | X | O | X | • | 17.50 | |||||||||||||||||||||||||||||||||||||||||||||||
| 17.00 | O | X | O | X | • | 17.00 | |||||||||||||||||||||||||||||||||||||||||||||||
| 16.50 | O | X | O | X | • | 16.50 | |||||||||||||||||||||||||||||||||||||||||||||||
| 16.00 | O | X | O | X | • | 16.00 | |||||||||||||||||||||||||||||||||||||||||||||||
| 15.50 | O | X | O | X | • | 15.50 | |||||||||||||||||||||||||||||||||||||||||||||||
| 15.00 | O | X | O | • | 15.00 | ||||||||||||||||||||||||||||||||||||||||||||||||
| 14.50 | O | X | • | 14.50 | |||||||||||||||||||||||||||||||||||||||||||||||||
| 14.00 | O | X | • | 14.00 | |||||||||||||||||||||||||||||||||||||||||||||||||
| 13.50 | O | X | • | 13.50 | |||||||||||||||||||||||||||||||||||||||||||||||||
| 13.00 | O | X | • | 13.00 | |||||||||||||||||||||||||||||||||||||||||||||||||
| 12.50 | O | X | • | 12.50 | |||||||||||||||||||||||||||||||||||||||||||||||||
| 12.00 | O | X | • | 12.00 | |||||||||||||||||||||||||||||||||||||||||||||||||
| 11.50 | O | X | • | 11.50 | |||||||||||||||||||||||||||||||||||||||||||||||||
| 11.00 | O | X | • | 11.00 | |||||||||||||||||||||||||||||||||||||||||||||||||
| 10.50 | O | X | • | 10.50 | |||||||||||||||||||||||||||||||||||||||||||||||||
| 10.00 | O | X | • | 10.00 | |||||||||||||||||||||||||||||||||||||||||||||||||
| 9.50 | O | X | • | 9.50 | |||||||||||||||||||||||||||||||||||||||||||||||||
| 9.00 | O | X | • | 9.00 | |||||||||||||||||||||||||||||||||||||||||||||||||
| 8.50 | O | X | • | 8.50 | |||||||||||||||||||||||||||||||||||||||||||||||||
| 8.00 | O | X | • | 8.00 | |||||||||||||||||||||||||||||||||||||||||||||||||
| 7.50 | O | • | 7.50 | ||||||||||||||||||||||||||||||||||||||||||||||||||
| 18 | 19 | 20 | 21 |

| ALGT Allegiant Travel Company ($250.65) - Aerospace Airline - ALGT broke a double top at $260 on Thursday, marking a new all-time high on the chart. ALGT is a 5 for 5’er within the favored aerospace airlines sector that has experienced three weeks of positive weekly momentum. From here, support sits at $240. |
| CDAY Ceridian HCM Holding, Inc. ($86.78) - Software - CDAY moved lower Thursday to break a double bottom at $87 before falling to $86 intraday. This 1 for 5'er moved to a negative trend earlier this month and ranks in the bottom quintile of the software sector RS matrix. The weight of the evidence is overwhelmingly negative here. Long exposure should be avoided. Further support is offered at $84 from last November, while the potential for overhead resistance may be found initially at $92. |
| CWH Camping World Holdings Inc ($32.01) - Retailing - CWH moved to a sell signal with a move to $33. Despite today’s move, CHW remains in a positive trend with 3 attributes in its favor. From here, CHW has additional support available at $26. The bullish support line sits at $21. |
| CZR Caesars Entertainment Inc. ($84.45) - Gaming - CZR printed a new all-time high today with a move to $90, which also marked the second consecutive buy signal on the chart. CZR is a healthy 4 for 5’er within the gaming sector that just experienced a flip to positive weekly momentum. From here, support sits at $82. |
| DMRC Digimarc Corporation ($34.76) - Software - DRMC declined Thursday after their earnings release to break a double bottom at $38 before falling over 17% to $35 intraday. This move also violated the bullish support line, placing the stock in an overall negative trend and demoting it to a 2 for 5'er. The technical picture is weak here; avoid. The potential for further support may be found at $34, while initial overhead resistance may come at $42. |
| GHL Greenhill & Co. ($15.06) - Finance - GHL shares moved higher today to complete a bullish triangle at $16 to mark its second consecutive buy signal. This 4 for 5'er has been in a positive trend and on an RS buy signal versus the market since February. GHL is actionable at current levels with a weekly overbought/oversold reading of 20%. From here, support is offered at $14. |
| LE Lands' End, Inc ($30.47) - Retailing - LE broke a double top at $33, marking the eighth consecutive buy signal on the chart since June. LE is a perfect 5 for 5’er as all of its trending and RS metrics are positive here. Additionally, LE is a member of the favored retailing sector. Initial support sits at $28. |
| NTAP NetApp, Inc. ($61.21) - Computers - NTAP moved lower Thursday after their earnings release to break a double bottom at $67 before falling over 14% to $62. While the stock is still a 3 for 5'er, it has certainly shown near-term weakness and has taken out all-near term support. Further support may be found at the bullish support line, which currently resides at $51. |
| Name | Option Symbol | Action | Stop Loss |
|---|---|---|---|
| Micron Technology, Inc. - $88.12 | MU2118F85 | Buy the June 85.00 calls at 11.95 | 82.00 |
| Name | Option | Action |
|---|---|---|
| CBRE Group, Inc. ( CBRE) | Mar. 60.00 Calls | Stopped at 15.30 (CP: 14.20) |
| Name | Option Symbol | Action | Stop Loss |
|---|---|---|---|
| Kellogg Company - $58.74 | K2118R62.5 | Buy the June 62.50 puts at 7.20 | 64.00 |
| Name | Option | Action |
|---|---|---|
| Advanced Micro Devices, Inc. (AMD) | Jun. 92.50 Puts | Raise the option stop loss to 13.35 (CP: 15.35) |
| BP plc (United Kingdom) ADR (BP) | Jun. 24.00 Puts | Stopped at 26.00 (CP: 25.47) |
| Walmart Inc. (WMT) | May. 140.00 Puts | Initiate an option stop loss of 10.00 (CP: 12.00) |
| Name | Option Sym. | Call to Sell | Call Price | Investment for 500 Shares | Annual Called Rtn. | Annual Static Rtn. | Downside Protection |
|---|---|---|---|---|---|---|---|
| Morgan Stanley $79.88 | MS2118F80 | Jun. 80.00 | 5.15 | $37,057.90 | 22.23% | 18.80% | 5.50% |
| Name | Action |
|---|---|
| Cree Research Inc (CREE) - 118.26 | Sell the June 125.00 Calls. |
| Synchrony Financial (SYF) - 40.22 | Sell the June 40.00 Calls. |
| Micron Technology, Inc. (MU) - 92.52 | Sell the May 90.00 Calls. |
| General Motors (GM) - 52.90 | Sell the June 55.00 Calls. |
| Taiwan Semiconductor Manufacturing Co. (Taiwan) ADR (TSM) - 132.30 | Sell the July 140.00 Calls. |
| Devon Energy Corporation (DVN) - 22.27 | Sell the July 23.00 Calls. |
| Alcoa Inc. (AA) - 27.20 | Sell the July 30.00 Calls. |
| Name | Covered Write |
|---|---|
| FireEye, Inc ( FEYE - 20.06 ) | June 25.00 covered write. |
Daily Equity & Market Analysis
Loading, Please Wait...
