Finanical-Banks and Energy have shown improvement among sector groups.
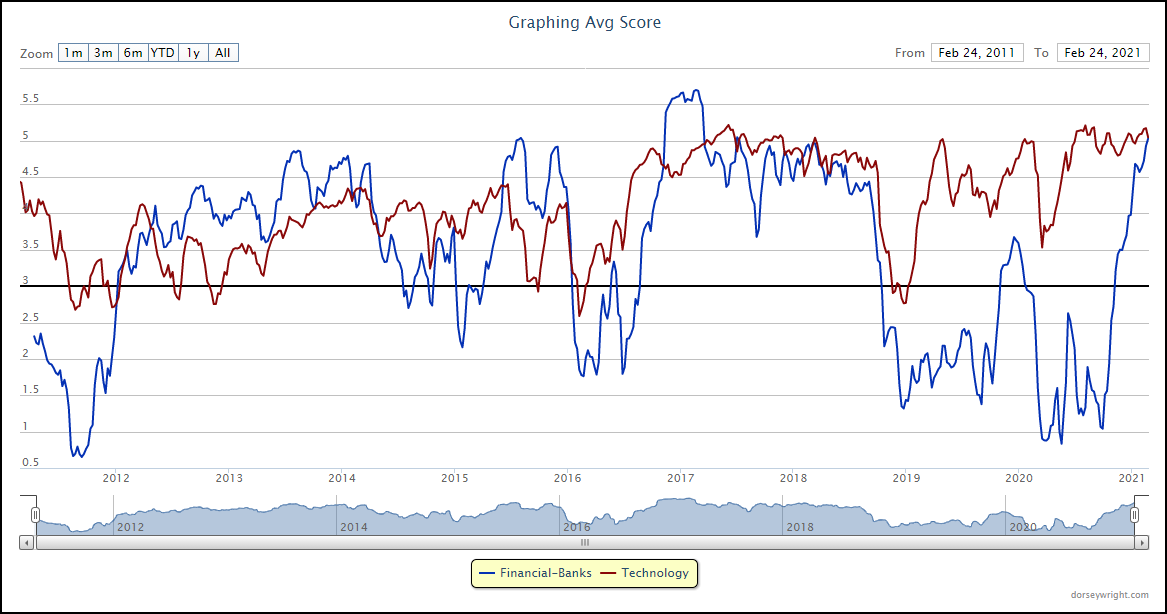
The rise in volatility across domestic equity markets over the past week led to some rotation among the sector view of the Asset Class Groups Scores (ACGS) page. The financial-banks group continued higher to an average score posting of 5.07, making it the highest-scoring sector representative on the ACGS page, and the third-highest scoring group out of all 135 groups through trading Wednesday. Financial-banks beat out technology for the top-ranked sector position, although the technology group still sits in close proximity to the top position with an average score of 5.00. This high score position for financial banks comes after a prolonged period of underperformance, as the space had scored lower than the technology group since May 2018. Although the financial-banks group only has data available dating to early-2011, this almost three-year period of underperformance marks its longest such stretch in the group’s history. In fact, the two groups were separated by almost 3 full score points in September of last year, which was also the largest score dispersion the two areas had seen. Since that time, technology largely moved sideways in score, remaining in a high field position but not necessarily improving. The financial-banks group, however, stormed higher, which is indicated by its average score direction of 4.00. While the technology space has not begun to deteriorate in score all that much, the vast outperformance of other sectors in recent weeks certainly speaks to the increased likelihood of further weakness moving forward.
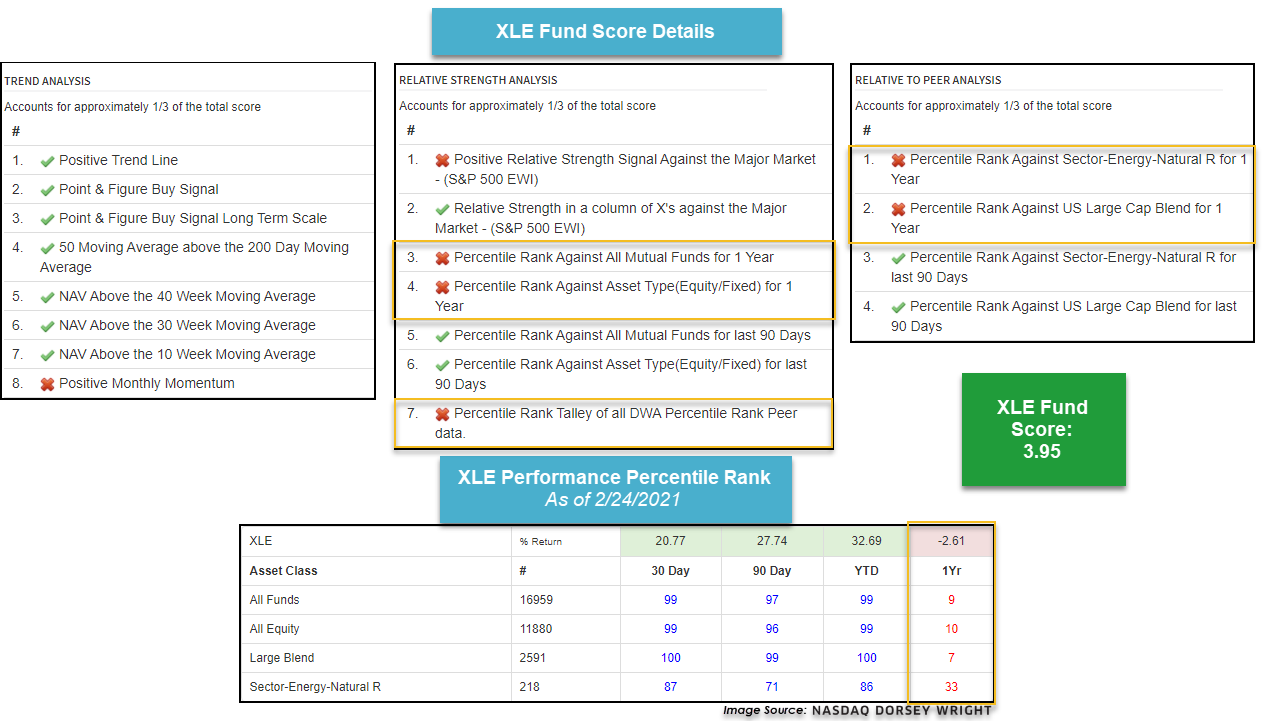
Another group that has shown significant improvement is the energy-natural resources space, which is closing in on the 4-score threshold at a recent group score posting of 3.95. This marks the highest score territory for energy since April 8, 2011, when the group briefly moved north of 4.00 for a single trading day. Other than that instance, you need to travel back to before the 2008 meltdown in commodities to find the group in higher score territory. With the energy space moving significantly higher this week in the DALI rankings, you may be wondering why the group still sits in a lower relative position on the ACGS page. The answer to that question lies in the differences between the strictly relative strength-based rankings underlying DALI, and the variety of factors that go into the fund score system that underlies the ACGS page. As a refresher, a fund score is made up of 19 different factors, which a separated into thirds: trend analysis, relative to market analysis, and relative to peer analysis.

We will use the Energy Select Sector SPDR Fund XLE as an example for the broader energy space, as the broad representative also possesses a recent score posting of 3.95. In looking at the score details, we can see that the majority of trend analysis factors are positive for XLE, which makes sense given the fund's 32.69% year-to-date return. However, many of the relative to market and peer comparisons incorporate 1-year trailing performance percentile rankings, and XLE still sits in a low field position with a loss of 2.61% over that time frame. If XLE and other energy funds continue to demonstrate relative strength over other domestic equity areas, these percentile rankings have the potential to move higher fairly quickly.