
Most Requested Symbols

The underlying picture of the broader Japanese equity space presents a different picture than the 30-year high reached by the Nikkei 225 Index earlier this week.
The average distribution reading is 40.88% overbought.
Today's featured stock is SGS-Thomson Microelectronics N.V (France) ADR (STM).
BAC, FLGT, CCK, ALGT, CAL, GPI, TSLA, DAR, V, & MSTR.
Call: International Paper (IP), Put: Digital Realty Trust (DLR), Covered Write: Sysco Corp (SYY)
We are excited to announce phase three of the Nasdaq Dorsey Wright Model Builder with the launch of Matrix and FSM-based Relative Strength (RS) Testing Service. As part of this launch, we are granting you free access to the service for the remainder of 2020. The tool is designed to help you more easily design, test, implement, and monitor custom models powered by the Nasdaq Dorsey Wright methodology. Please see below for replays of our latest webinar series covering the different aspects of the tool.
11/19/2020: Static Model Builder Demo Replay - Click Here
12/9/2020: Matrix Model Builder Demo Replay - Click here
11/5/2020: FSM Model Builder Demo Replay - Click here
On December 18th, the Federal Reserve announced that banks can begin share buyback programs at the beginning of 2021. In June, the Fed required banks to halt buybacks and capped their dividend payments based on recent income. A few large banks wasted no time starting up their buyback programs, as JPMorgan Chase’s board approved a new share repurchase program of $30 billion and Goldman Sachs announced it intends to resume its share-repurchase program next quarter (Source: Barron’s). A couple of large banks that are exhibiting signs of technical strength are Bank of America BAC and J.P. Morgan Chase & Co. JPM which are both 4 for 5’ers and trading in overall positive trends. The financial sector as a whole has seen a vast improvement over the past few months, evidenced by the Financial Select Sector SPDR Fund’s XLF positive score direction of 2.25. XLF currently has a fund score of 2.97 and is right on the cusp of moving above 3.00, which is generally considered technically acceptable. On the Asset Class Group Scores page, the Financial-Banks group has an average group score of 3.97 along with a highly positive score direction of 3.15, furthering the positive developments for the sector.


Each week the analysts at DWA review and comment on all major asset classes in the global markets. Shown below is the summary or snapshot of the primary technical indicators we follow for multiple areas. Should there be changes mid-week we will certainly bring these to your attention via the report.
| Universe | BP Col & Level (actual) | BP Rev Level | PT Col & Level (actual) | PT Rev Level | HiLo Col & Level (actual) | HiLo Rev Level | 10 Week Col & Level (actual) | 10 Week Rev Level | 30 Week Col & Level (actual) | 30 Week Rev Level |
|---|---|---|---|---|---|---|---|---|---|---|
| ALL |
|
60% |
|
56% |
|
90% |
|
76% |
|
74% |
| NYSE |
|
68% |
|
66% |
|
92% |
|
80% |
|
80% |
| OTC |
|
58% |
|
52% |
|
90% |
|
74% |
|
70% |
| World |
|
56% |
|
50% |
|
|
|
74% |
|
68% |
2020 has brought about quite a bit of change, and as we wind down the year we have seen one more change as it relates to the DALI asset class ranking with Commodities moving up into the third position. Commodities overtook Fixed Income to move into third place behind US Equity (which is still number one) and International Equity (number 2). The last time Commodities were ranked this high was April 2019, and this move has been largely driven by the strength in Crude Oil CL/ as well as Base Metals. Crude Oil is up more than 20% over the past three months while the Invesco Base Metals ETF DBB, which holds position in copper, zinc, and aluminum, is up more than 14%. So, commodities, in general, are a place that you may consider adding some exposure to as we head into the New Year with a focus towards Energy and/or Industrial Metals.
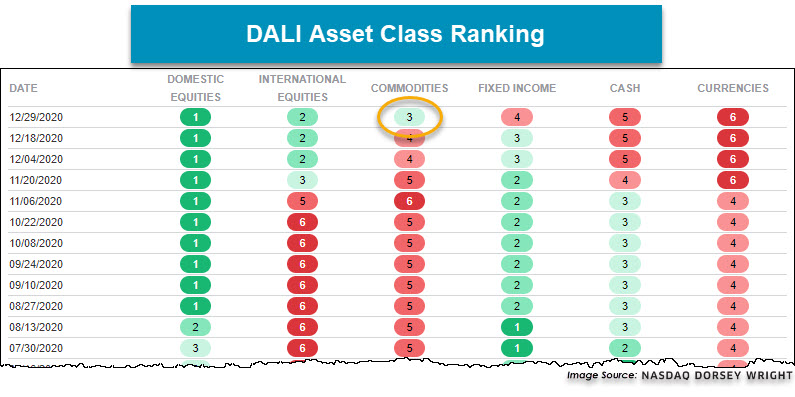
For those that are looking for ways to gain exposure to commodities you may also consider the Invesco Commodity Model POWRSHARES, which designed to hold two of the strongest ETFs out of an inventory of eight Invesco Commodity ETFs. Year-to-date the model is up over 40%, compared to -7% for the S&P GSCI Commodity Index, and the Model currently holds the Invesco DB Oil ETF DBO and the Invesco DB Base Metals ETF DBB.

| Symbol | Name | Price | Yield | PnF Trend | RS Signal | RS Col. | Fund Score | 200 Day MA | Weekly Mom |
|---|---|---|---|---|---|---|---|---|---|
| DIA | SPDR Dow Jones Industrial Average ETF Trust | 303.46 | 2.03 | Positive | O | 3.82 | 266.44 | -2W | |
| EEM | iShares MSCI Emerging Markets ETF | 51.02 | 2.38 | Positive | Sell | O | 5.24 | 42.51 | -2W |
| EFA | iShares MSCI EAFE ETF | 73.42 | 2.31 | Positive | Sell | O | 3.14 | 62.62 | -2W |
| FM | iShares MSCI Frontier 100 ETF | 28.53 | 2.90 | Positive | Sell | O | 1.19 | 24.74 | -3W |
| IJH | iShares S&P MidCap 400 Index Fund | 227.66 | 1.48 | Positive | Buy | O | 4.33 | 184.72 | -1W |
| IJR | iShares S&P SmallCap 600 Index Fund | 90.84 | 1.40 | Positive | Buy | O | 4.19 | 71.13 | -1W |
| QQQ | Invesco QQQ Trust | 312.96 | 0.56 | Positive | Buy | X | 4.80 | 258.21 | +6W |
| RSP | Invesco S&P 500 Equal Weight ETF | 125.83 | 1.73 | Positive | Buy | X | 4.24 | 106.14 | -2W |
| SPY | SPDR S&P 500 ETF Trust | 371.46 | 1.53 | Positive | O | 4.09 | 321.59 | -1W | |
| XLG | Invesco S&P 500 Top 50 ETF | 285.43 | 1.28 | Positive | O | 4.49 | 247.72 | +6W |
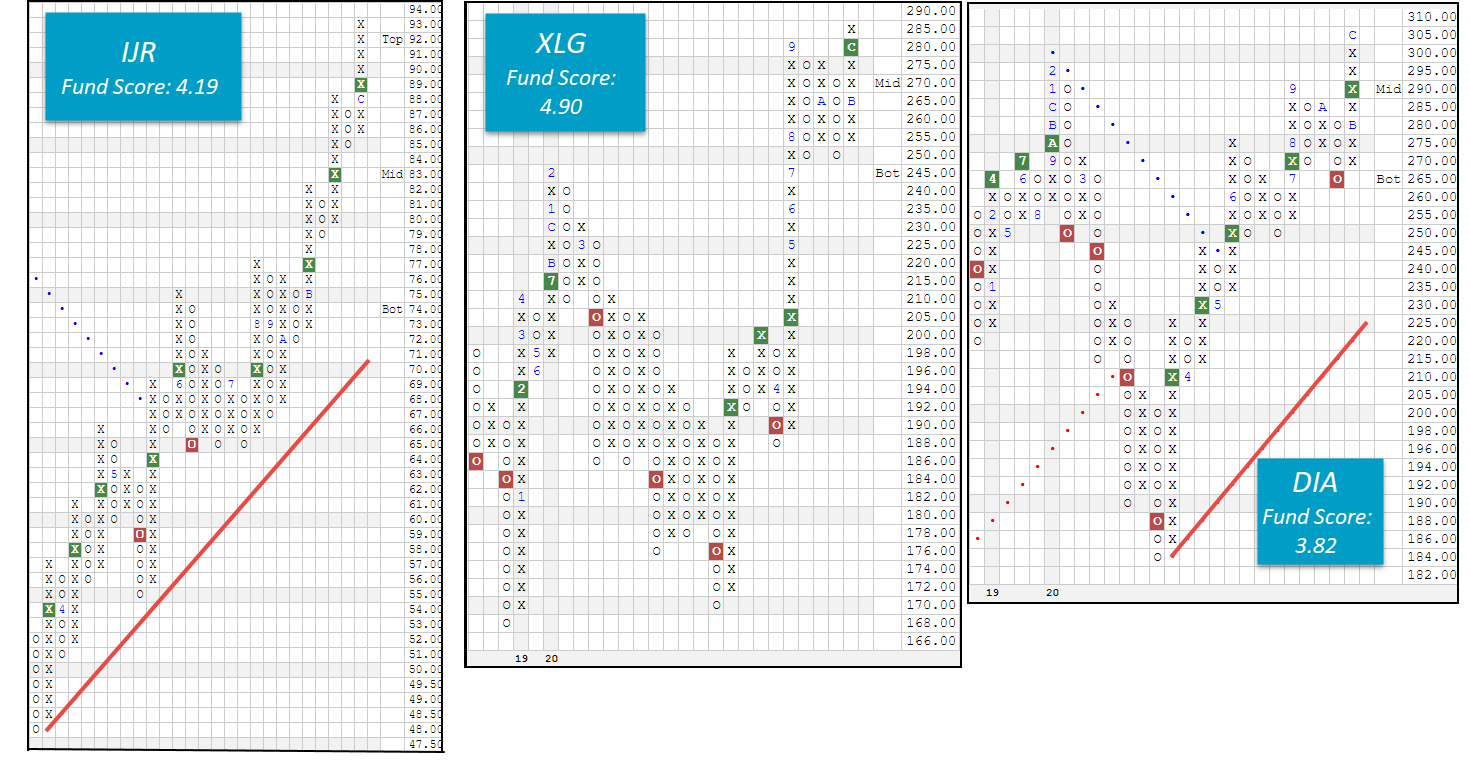
The last week of market action was generally a positive one as eight of the 10 major market funds covered in this report finished the week in the black while just two finished in negative territory. The winner for the week was the iShares MSCI EAFE ETF EFA with a gain of 2.60%. The iShares S&P SmallCap 600 Index Fund IJR and the iShares S&P MidCap 400 Index Fund IJH each tied for the worst-performing fund over the last seven days with respective losses of -0.31%. With just one trading day left in the calendar year, today we want to review some recent notable chart action that has taken place as well as provide an overview of where we stand as we enter 2021.

This week, we saw the iShares S&P SmallCap 600 Index Fund IJR, Invesco S&P 500 Top 50 ETF XLG, and SPDR Dow Jones Industrial Average ETF Trust DIA each print new all-time highs on their respective default trend charts as equity markets continue to move higher. As a result, all seven of the US major market funds are now trading well above their bullish support lines on Point & Figure buy signals and currently sit at record highs. Furthermore, despite the drastic COVID-19 sell-off in the first quarter of the year, each US major market fund is positioned to finish out 2020 with gains in excess of 6% and fund scores above the coveted 3.00-threshold.
On the international side of things, today, we’ve seen the iShares MSCI EAFE ETF EFA move to $74, which marks a new multi-year high on the chart. Similarly, EEM has continued to hold steady at $51 all month, a high watermark last recorded in early 2018. Despite each of these international funds sitting at rally highs, we have seen considerable outperformance from emerging markets this year when compared to their developed counterparts with EEM posting a gain of 13.71% versus EFA’s 5.73%. Additionally, EEM is outscoring EFA by over two whole score points. In fact, EEM is the highest-scoring of all major market funds at this time with a score of 5.24, followed by the QQQ’s score of 4.8. On the other side of the coin, the iShares MSCI Frontier 100 ETF FM is the only major market fund set to finish the year in the red with a current year-to-date return of -6% and is the only major market fund that is scoring below the 3.00 threshold at 1.19.

As we finish up the final two trading days of 2020, we find that the major market ETFs are on the overbought side of the distribution curve with an average OBOS% reading of 61.70%. The EFA is the most heavily overbought fund with an OBOS% reading of 90%, followed by the IJR’s OBOS% reading of 83%. We will continue to monitor these areas of the global equity market for potential pullbacks and price normalization as we move into the new year.
![]()
In the table below, we have provided an update to the initial support levels for all ten major market ETFs. If you have any questions on any of these charts, please do not hesitate to reach out to our analyst team by phone (804-320-8511) or by email (dwa@dorseywright.com).

SECTOR BULLISH PERCENT CHANGES
| Reversed to X | Reversed to O |
|---|---|
| 0 | 5 (BPCOMP | 66), (BPGAME | 72), (BPINET | 58), (BPREAL | 68), (BPREST | 80), |
| To Xs | To Os |
|---|---|
| None | Machinery and Tools ( 0.95 to 80 ) |
| None | Steel/Iron ( 0.56 to 80 ) |
Average Level
67.82
| Sector |
|---|
| None |
| Sector |
|---|
| Precious Metals (48%) - Bear Correction |
| Sector |
|---|
| Aerospace Airline (64%) - Bear Alert |
| Autos & Parts (72%) - Bull Confirmed |
| Building (70%) - Bull Confirmed |
| Computers (66%) - Bear Alert |
| Utilities / Electric (54%) - Bull Correction |
| Gaming (72%) - Bull Confirmed |
| Internet (58%) - Bull Correction |
| Real Estate (68%) - Bear Alert |
| Restaurants (80%) - Bull Confirmed |
| Textiles / Apparel (70%) - Bull Confirmed |
SECTOR INDICATOR CHART CHANGES
PT is the percentage of stocks within a sector that are trading above their bullish support lines. RSX is the percentage of stocks within a sector whose relative strength charts are in a column of Xs. RSP is the percentage of stocks within a sector whose relative strength charts are on a buy signal. The strongest sectors, i.e. market leaders, will have most of these indicators positive and moving higher in a column of Xs.
|
There were only rising sector PT charts this week, with 10 rising and none moving lower. The following sector charts rose: Aerospace Airline [^PTAERO], Banks [^PTBANK], Electronics [^PTELEC], Finance [^PTFINA], Leisure [^PTLEIS], Restaurants [^PTREST], Semiconductors [^PTSEMI], Textiles/Apparel [^PTTEXT], Wall Street [^PTWALL], Waste Management [^PTWAST]. No charts reversed in column. |
|
| ^PT Charts Reversing Up - | ^PT Charts Reversing Down - |
|
|
|
| ^PT Charts Moving Higher - | ^PT Charts Moving Lower - |
|
|
|
|
There were mostly RSX charts rising this week, with 14 rising and 3 moving lower. The following sector charts rose: Biomedics/Genetics [^RSXBIOM], Business Products [^RSXBUSI], Electronics [^RSXELEC], Utilities/Electricity [^RSXEUTI], Food Beverages/Soap [^RSXFOOD], Healthcare [^RSXHEAL], Metals Non Ferrous [^RSXMETA], Precious Metals [^RSXPREC], Protection Safety Equipment [^RSXPROT], Semiconductors [^RSXSEMI], Software [^RSXSOFT], Steel/Iron [^RSXSTEE]-Rev. , Wall Street [^RSXWALL], Waste Management [^RSXWAST]. The following sector charts fell: Drugs [^RSXDRUG], Media [^RSXMEDI]-Rev. , Oil Service [^RSXOILS]. There were 2 that moved to buy signals and 0 that moved to sell signals. The following were buy signals: Business Products [^RSXBUSI],Software [^RSXSOFT]. The following were sell signals: . |
|
| ^RSX Charts Reversing Up - | ^RSX Charts Reversing Down - |
|
|
| ^RSX Charts Moving Higher - | ^RSX Charts Moving Lower - |
|
|
|
There were mostly RSP charts rising this week, with 5 rising and 1 moving lower. The following sector charts rose: Aerospace Airline [^RSPAERO], Gaming [^RSPGAME], Metals Non Ferrous [^RSPMETA]-Rev. , Steel/Iron [^RSPSTEE], Wall Street [^RSPWALL]. The following sector chart fell: Gas Utilities [^RSPGUTI]. There were 1 that reversed to X. |
|
| ^RSP Charts Reversing Up - | ^RSP Charts Reversing Down - |
|
|
| ^RSP Charts Moving Higher - | ^RSP Charts Moving Lower - |
|
|
FAVORED SECTOR STATUS CHANGES
A sector is considered to be Favored if it has 3 or 4 of the sector indicators (Relative Strength, RSX, RSP, & PT) positive, Average if it has 2 of the 4 indicators positive, & Unfavored if it has 0 or 1 of the indicators positive. The table below contains those sectors that have experienced a Favored Sector Status change over the past week. It is best to focus on sectors that are about 50% or lower on their Bullish Percent charts & are in Xs. Note: If a sector moves from Favored to Average, it doesn't necessarily mean that the sector in question has to be sold - it just means you need to evaluate your individual positions with exposure to that sector.
| Changes since 12/23/2020 | Full Report |
|
|
|
|
|||||
|
|
|
|
|
|
|||
|
|
|
|
|
|||
|
|
|
|
|
|
|||

The Japanese equity market has been back in the news over the past week, as the Nikkei 225 Index, the country’s oldest and most prominent cap-weighted benchmark, rose to a chart level of 27600, marking its highest level since 1989. Similar to the S&P 500 Index in the US, the Nikkei 225 includes the 225 companies with the largest market capitalization on the Tokyo Stock Exchange. While it is certainly noteworthy to have the Japanese benchmark making new multi-year highs, the underlying picture of the broader Japanese equity space presents a different picture.
The relative strength picture of Japan can be seen on the NDW country index matrix ranking, which has the NDW Japan TR Index NDWNQJPT ranked 26th out of the 43 country indices examined. Japan has actually been significantly higher over the past 12 months, as the country benefited from the general resilience of Asian economies amid the global pandemic and rose to a rank of 5th at the end of May. However, that relative strength was short-lived, as the index fell to the 20th position by the end of the next month. In looking at the historical matrix rank for Japan over the course of the past five years, we can see that high rankings are relatively rare as it has spent the vast majority of the time in the bottom half of the rankings. As a refresher, these country rankings are split off into quartiles, with the top quartile viewed as “buy” areas of international equity markets, the second quartile viewed as “hold” areas, and the bottom third viewed as the less favorable, “sell” countries. Based on the current ranking in the bottom half, Japan would not be viewed as a favorable area of investment for international equity exposure.

Another way to view the strength of equity markets is through participation, which we typically examine through bullish percent charts. We frequently mention bullish percent readings for major domestic equity indices, however, they are also available for international equity markets. In order to view any technical indicator for an international equity region, simply navigate to the Technical Indicator Reports page and change the country/region you are examining in the upper left-hand area of the platform. Doing this for Japan reveals the Bullish Percent for Japan BPTO-TO, which represents the percentage of the roughly 2,000 stocks we track on the Tokyo Stock Exchange that are trading on a current point & figure buy signal. This reading reached a multi-year high of 86% in June of this year and has moved largely lower since that time. The chart most recently reversed back down into a column of Os last week and currently sits at 54%.
It is generally viewed as a negative sign for equity indices to be reaching multi-year highs while the overall market participation is declining, as is the case with Japan. In order to dive deeper into how the movement in the BPTO-TO has related to Japanese equities, we have split off the indicator chart readings into quartiles and measured forward returns for the Nikkei 225 Index based on what quartile and column we found the chart. We ran this data based on the full history of the Bullish Percent for Japan indicator, dating back to the beginning of 2003. Interestingly enough, we can see that the Bullish Percent for Japan has actually spent the majority of trading days in the second quartile on the chart, ranging from 50% to 75%. Most of these days find the chart in a column of X's, however, there have still been roughly 14% of the trading days since 2002 where the chart has been in a column of Os in the second quartile, where it is currently positioned. The average forward price return for the Nikkei 225 Index NK225-OK is actually the weakest looking out 1 week, 1 month, and 6 months from any combination of quartile and column when the bullish percent is at these levels. It is also the second-worst average when looking at forward 3 month and 12 months returns for the Nikkei 225 Index. When thinking intuitively, these averages are not all that surprising, as we might expect weaker returns when the market participation in Japan is declining towards the 50% level, rather than remaining at an elevated position or potentially improving from washed-out territory. While the picture for Japan certainly has the potential to improve as we move into the New Year, the current relative-strength and participation readings do not point toward this being the case initially. It should also be noted that these averages based on historical readings near the current chart positioning were not all that negative, so this is not meant to say that we should expect a major downturn in Japanese equities in 2021. Rather, we might be ready for a continuation of stagnated underperformance in the broader Japanese equities space, as has been the trend for most of the past several years.

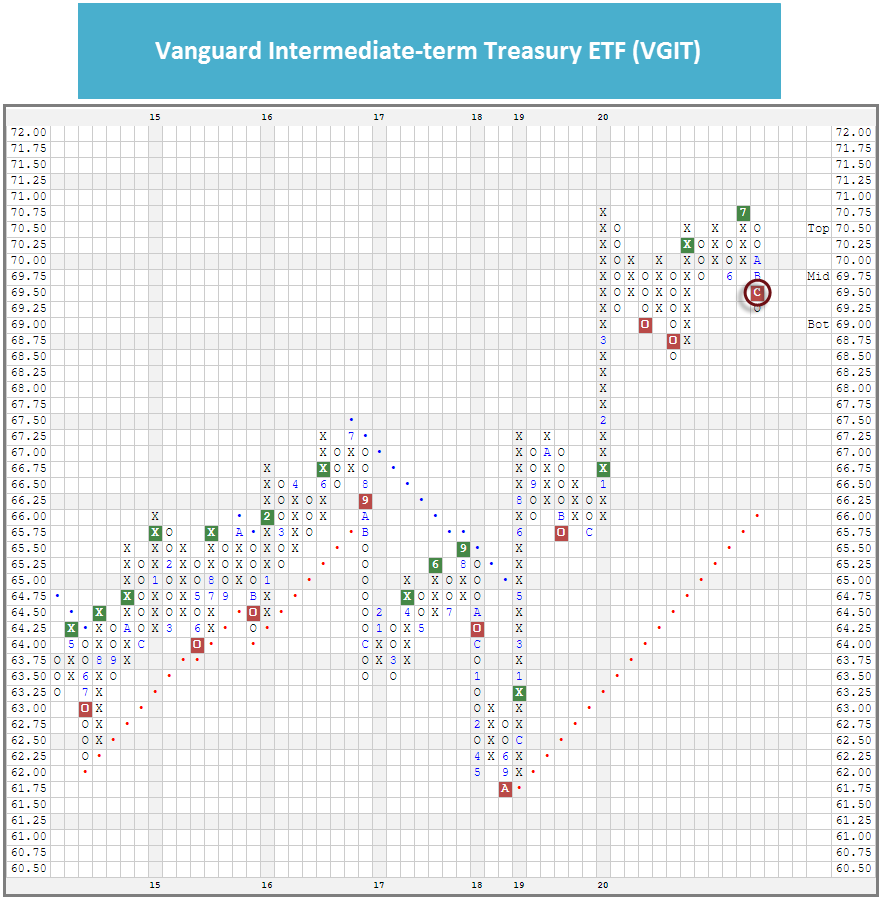
Although there has been little or no movement on the charts of the major US yield indices, there were a handful of sell signals on the charts of medium and long-term bond funds over the last week.
The Vanguard Intermediate-term Treasury ETF VGIT broke a triple bottom at $69.50 last week, taking out support that had been in place since March. VGIT currently has an unfavorable 1.99 fund score and a negative -3.28 score direction. From here, the next level of support sits at $68.50.
The iShares Barclays 10-20 Year Treasury Bond ETF TLH also returned to a sell signal last week when it broke a double bottom at $157.50. TLH currently has a 1.60 fund score and a negative -3.41 score direction. TLH’s next level of support sits at $157.
Finally, the Vanguard Long-term Bond ETF BLV broke a spread quad bottom at $109, taking out support that dated back to September. BLV currently has a 2.33 fund score and negative -2.00 score direction. Its next level of support sits at $106.50.
Since the beginning of November, the score of the US Fixed Income Long Duration group in the Asset Class Group Scores has declined from 0.4 points from 3.36 to its current level of 2.96.
Interestingly, while the intermediate- and long-term bond fund mentioned above each gave sell signals last week. The iShares iBoxx $ Investment Grade Corp. Bond ETF LQD returned to a buy signal on 12/24 when it broke a double top at $137.75.
We quite often see investment grade corporate bonds make similar directional moves to US Treasuries as they also tend be sensitive to changing interest rates. However, while Treasury yields have risen over the recent term, US corporate bond spreads (the difference in yield between corporate bonds and Treasuries) has narrowed further, mitigating (or perhaps even outstripping) the effect rising yields has had on corporate bonds.

One possible explanation for this is that the bond market interprets the recent news about COVID-19 vaccines as a positive for the US economy and thus expects that, at some point the Fed’s monetary policy will tighten, resulting in higher Treasury yields. Meanwhile, a stronger economy means that corporate borrowers are less likely to default and thus investors demand less of a premium to hold corporate bonds over US Treasuries, driving down corporate spreads.
Remember, these are technical comments only. Just as you must be aware of fundamental data for the stocks we recommend based on technical criteria in the report, so too must you be aware of important data regarding delivery, market moving government releases, and other factors that may influence commodity pricing. We try to limit our technical comments to the most actively traded contracts in advance of delivery, but some contracts trade actively right up to delivery while others taper off well in advance. Be sure you check your dates before trading these contracts. For questions regarding this section or additional coverage of commodities email james.west@dorseywright.com.
Data represented in the table below is through 12/29/2020:
Broad Market Commodities Report
| Symbol | Name | Price | PnF Trend | RS Signal | RS Col. | 200 Day MA | Weekly Mom |
|---|---|---|---|---|---|---|---|
| CL/ | Crude Oil Continuous | 48.01 | Positive | Buy | O | 36.68 | +7W |
| DBLCIX | Deutsche Bank Liquid Commodities Index | 304.73 | Negative | Sell | O | 264.33 | +7W |
| DWACOMMOD | DWA Continuous Commodity Index | 581.46 | Positive | Buy | O | 486.25 | -203W |
| GC/ | Gold Continuous | 1882.10 | Negative | Buy | O | 1827.66 | +2W |
| HG/ | Copper Continuous | 3.55 | Positive | Buy | X | 2.83 | -1W |
| ZG/ | Corn (Electronic Day Session) Continuous | 466.25 | Positive | Buy | X | 357.71 | +2W |
As discussed towards the end of 2019, the decade of the “2010s” was predominantly dominated by strength in equities and weakness in alternatives – a lost decade for commodities some say. From 12/31/2009 – 12/31/2019, commodities, broadly represented by the Continuous Commodity Index (UV/Y), posted a cumulative return of -13.21% compared to the S&P 500’s (SPX) price return 190%. If including dividends for the S&P 500 (TR.SPXX), this jumps to 257%. The iShares US Core Bond ETF (AGG.TR) gained 43% on a total return basis over the same timeframe. Furthermore, the commodities fund group found on the Asset Class Group Scores (ACGS) page has generally remained below the 3.0 fund score threshold despite numerous attempts to break through, with the latest happening in September of this year (shown below). However, the 2000s were much kinder to the asset class, along with parts of 2020. Although broad, equal-weight commodities exposure has generally lagged this year (especially crude oil), should commodities continue higher and/or establish further leadership it would be prudent to adapt and go with the trends, as they can be quite persistent.
Additional commentary on the recent movements in commodities is also in the DALI section of today’s research report. To reference the “2020 Timeline” published a few weeks ago in the Alternative Assets update, click here.


Average Level
40.88
| AGG | iShares US Core Bond ETF |
| USO | United States Oil Fund |
| DIA | SPDR Dow Jones Industrial Average ETF |
| DVY | iShares Dow Jones Select Dividend Index ETF |
| DX/Y | NYCE U.S.Dollar Index Spot |
| EFA | iShares MSCI EAFE ETF |
| FXE | Invesco CurrencyShares Euro Trust |
| GLD | SPDR Gold Trust |
| GSG | iShares S&P GSCI Commodity-Indexed Trust |
| HYG | iShares iBoxx $ High Yield Corporate Bond ETF |
| ICF | iShares Cohen & Steers Realty ETF |
| IEF | iShares Barclays 7-10 Yr. Tres. Bond ETF |
| LQD | iShares iBoxx $ Investment Grade Corp. Bond ETF |
| IJH | iShares S&P 400 MidCap Index Fund |
| ONEQ | Fidelity Nasdaq Composite Index Track |
| QQQ | Invesco QQQ Trust |
| RSP | Invesco S&P 500 Equal Weight ETF |
| IWM | iShares Russell 2000 Index ETF |
| SHY | iShares Barclays 1-3 Year Tres. Bond ETF |
| IJR | iShares S&P 600 SmallCap Index Fund |
| SPY | SPDR S&P 500 Index ETF Trust |
| TLT | iShares Barclays 20+ Year Treasury Bond ETF |
| GCC | WisdomTree Continuous Commodity Index Fund |
| VOOG | Vanguard S&P 500 Growth ETF |
| VOOV | Vanguard S&P 500 Value ETF |
| EEM | iShares MSCI Emerging Markets ETF |
| XLG | Invesco S&P 500 Top 50 ETF |
Relative strength is a measure of how a stock is performing when compared to something else, in this case the S&P 500 Equal Weighted Index (SPXEWI). Each day the stock's closing price is divided by that of the SPXEWI, the resulting numbers decimal is moved two places and then plotted on a Point & Figure chart. Whenever the relative strength chart shows a double top buy signal (e.g. RS Buy or Positive Relative Strength), it suggests the stock is likely to outperform the market for the foreseeable future. Conversely, whenever the relative strength chart gives a double bottom sell signal (e.g. RS Sell or Negative Relative Strength) it suggests the stock will under-perform the market. Relative strength signals tend to last roughly 18 to 24 months on average. Consequently, changes from buy signals to sell signals (and vice versa) are important to be aware of as they are longer-term implications of a stock's likely performance versus the indices. Using the Point & Figure chart along with the relative strength chart will allow you to better ascertain risk-reward and other trade management tools, but we always want to over-weight our portfolios toward those stocks that are on RS buy signals, giving us the best chance of outperforming the broader market.
In the Optionable Universe, this week we saw 18 relative strength buy signals compared to 33 last week.
On the sell side, there were 10 relative strength sell signals compared to 10 last week.
Relative Strength Changes for the Week
Stocks Moving to an RS Buy Signal
Symbol
Company
Sector
Price
RS vs Market Signal
RS vs Market Column
RS vs Peer Signal
RS vs Peer Column
Tech Attrib
COF
Capital One Financial Corporation
Financial Services
96.180
Buy
X
Sell
X
4
![]()
HWC
Hancock Whitney Corp
Banks
33.500
Buy
X
Buy
X
5
![]()
FLY
Babcock & Brown Air Limited
Industrial Goods & Svcs
9.670
Buy
X
Sell
X
3
![]()
ERII
Energy Recovery Incorporation.
Industrial Goods & Svcs
13.110
Buy
X
Sell
X
4
![]()
GRPN
Groupon Inc.
Retail
38.340
Buy
X
Sell
X
4
![]()
MTRX
Matrix Service Company
Oil Drilling, Equipment Svcs
11.130
Buy
X
Sell
X
3
![]()
MYE
Myers Industries Inc
Industrial Goods & Svcs
19.880
Buy
X
Sell
X
4
![]()
PDCE
PDC Energy Inc
Oil Drilling, Equipment Svcs
20.200
Buy
X
Buy
X
5
![]()
EYPT
EyePoint Pharmaceuticals Inc.
Pharmaceuticals
5.410
Buy
X
Sell
X
3
![]()
UIS
Unisys Corp
Technology Services
19.530
Buy
X
Sell
X
4
![]()
WBAI
500.com Limited
Cyclical Goods and Services
5.740
Buy
X
Buy
X
5
![]()
ATUS
Altice USA, Inc. Class A
Media
37.900
Buy
X
Buy
X
4
![]()
SMPL
Simply Good Foods Co
Noncyclical Goods and Svcs
29.750
Buy
X
Sell
X
4
![]()
ATUS.TR
Altice USA, Inc. Class A TR
Media
37.900
Buy
X
Buy
X
4
![]()
UIS.TR
Unisys Corp TR
Technology Services
19.530
Buy
X
Sell
X
4
![]()
NRZ.TR
New Residential Investment Corp. TR
Financial Services
10.373
Buy
X
Buy
X
5
![]()
IPOC
Social Capital Hedosophia Holdings Corp. III Class A
Financial Services
16.240
Buy
X
Sell
X
4
![]()
TRIT
Triterras, Inc. Class A
Financial Services
12.630
Buy
X
Sell
X
3
![]()
Stocks Moving to a RS Sell Signal
Symbol
Company
Sector
Price
RS vs Market Signal
RS vs Market Column
RS vs Peer Signal
RS vs Peer Column
Tech Attrib
EQT
EQT Corporation
Gas Utilities
12.460
Sell
O
Buy
O
1
![]()
APEI
American Public Education Inc.
Noncyclical Goods and Svcs
29.550
Sell
O
Sell
O
0
![]()
CYRX
CryoPort, Inc.
Medical Products
42.840
Sell
O
Sell
O
0
![]()
RENN
Renren Inc.
Technology Services
5.110
Sell
O
Sell
O
1
![]()
XONE
The ExOne Company
Industrial Goods & Svcs
9.365
Sell
O
Buy
O
2
![]()
ARCT
Arcturus Therapeutics Ltd.
Pharmaceuticals
42.360
Sell
O
Sell
O
0
![]()
BABA
Alibaba Group Holding Ltd (China) ADR
Retail
236.260
Sell
O
Sell
O
0
![]()
KMPHD
Kempharm Inc
Pharmaceuticals
12.300
Sell
O
Sell
O
0
![]()
APVO
Aptevo Therapeutics Inc.
Biotechnology
34.850
Sell
O
Sell
O
1
![]()
ZM
Zoom Video Communications, Inc. Class A
Fixed Line Communications
353.750
Sell
O
Buy
O
2
![]()
| Symbol | Company | Sector | Current Price | Action Price | Target | Stop | Notes |
|---|---|---|---|---|---|---|---|
| DE | Deere & Company | Machinery and Tools | $265.34 | 250s to low 270s | 348 | 208 | 5 for 5'er, ATH, pos trend, top 25% of DWAMACH, triple top breakout |
| PWR | Quanta Services, Inc. | Electronics | $70.62 | hi 60s - low 70s | 86 | 58 | 5 for 5'er, top 20% of favored ELEC sector matrix, triple top breakout, pullback from ATH |
| PLAN | Anaplan, Inc. | Internet | $73.31 | upper 60s to mid 70s | 84 | 58 | 4 for 5'er, pullback from ATH, consec buy signals, top 25% DWAINET, pos weekly and mon mom |
| TGT | Target Corporation | Retailing | $175.04 | 160s - 170s | 186 | 140 | 4 for 5'er, favored RETA sector, multiple buy signals, pullback from ATH, 1.6% yield |
| ITW | Illinois Tool Works Inc. | Machinery and Tools | $200.41 | high 190s to high 220s | 266 | 160 | 4 for 5'er, fav DWAMACH, LT market RS buy, consec buy signals, pullback from ATH, Earn. 1/29 |
| HOG | Harley-Davidson, Inc. | Leisure | $36.46 | hi 30s - low 40s | 66 | 32 | 4 for 5'er, top 50% of favored LEIS sector matrix, pullback from 52-week high, R-R>4.0, pot. cov. write Earnings 1/26/21 |
| TXRH | Texas Roadhouse, Inc. | Restaurants | $78.96 | high 70s to high 80s | 115 | 67 | 4 for 5'er, pullback from ATH, consec buy signals, LT market RS buy signal |
| BX | The Blackstone Group Inc | Finance | $64.54 | low-to-mid 60s | 69 | 54 | 4 for 5''er, favored WALL sector, LT pos mkt RS, multiple buy signals, pos monthly mom flip, 2.9% yield Earnings 1/28/21 |
| CLGX | CoreLogic, Inc. | Insurance | $76.32 | mid to upper 70s to low 80s | 105 | 64 | 5 for 5'er, consec buy signals, pullback from ATH, top half of DWAINSU, 1.7% yield |
| STM | SGS-Thomson Microelectronics N.V (France) ADR | Semiconductors | $36.78 | mid-to-high 30s | 52 | 30 | 4 for 5'er, LT pos mkt RS, bullish catapult, potential covered write, good R-R |
| Symbol | Company | Sector | Current Price | Action Price | Target | Stop | Notes |
|---|
| Symbol | Company | Sector | Current Price | Action Price | Target | Stop | Notes |
|---|---|---|---|---|---|---|---|
| JCI | Johnson Controls International PLC | Protection Safety Equipment | $45.90 | mid 40s | 58 | 39 | OK to add or maintain exposure here. Abide by $39 stop. Earn. 1/29 |
| Comment |
|---|
| TGTX TG Therapeutics, Inc. R ($53.54) - Biomedics/Genetics - We will now raise our stop to $49, the first potential sell signal on TGTX's default chart. |
| ENPH Enphase Energy Inc R ($175.05) - Electronics - With no visible support between $166 and $126, we will raise our stop to $164, the first potential sell signal on ENPH's default chart. |
| APPS Digital Turbine Inc. R ($55.76) - Computers - We will now raise our stop to $51, the first potential buy signal on APPS's default chart. |
| CVNA Carvana Company R ($251.69) - Autos and Parts - After hitting our $244 stop in yesterday's trading, CVNA reversed up today offering a potential exit opportunity for those with open long exposure. |
STM SGS-Thomson Microelectronics N.V (France) ADR R ($37.52) - Semiconductors - STM is a 4 for 5'er that has been on a market RS buy signal since 2016. After completing a bullish catapult, STMS reached a multi-year high on its default chart earlier this month, before pulling back to the middle of its trading band. The stock carries a 0.5% yield and offers a potential covered write opportunity on the April '21 call options. Long exposure may be added in the mid-to-upper $30s and we will set our initial stop at $30, the first potential sell signal on STM's default chart; combined with the bullish price objective of $52, this gives us a reward-to-risk ratio just under 2.0.
| 14 | 15 | 16 | 17 | 18 | 19 | 20 | |||||||||||||||||||||||||||||||||||||||||||||||
| 41.00 | X | 41.00 | |||||||||||||||||||||||||||||||||||||||||||||||||||
| 40.00 | C | O | 40.00 | ||||||||||||||||||||||||||||||||||||||||||||||||||
| 39.00 | X | O | 39.00 | ||||||||||||||||||||||||||||||||||||||||||||||||||
| 38.00 | X | O | 38.00 | ||||||||||||||||||||||||||||||||||||||||||||||||||
| 37.00 | X | O | 37.00 | ||||||||||||||||||||||||||||||||||||||||||||||||||
| 36.00 | X | O | Mid | 36.00 | |||||||||||||||||||||||||||||||||||||||||||||||||
| 35.00 | X | X | O | 35.00 | |||||||||||||||||||||||||||||||||||||||||||||||||
| 34.00 | X | O | B | 34.00 | |||||||||||||||||||||||||||||||||||||||||||||||||
| 33.00 | X | O | X | 33.00 | |||||||||||||||||||||||||||||||||||||||||||||||||
| 32.00 | • | A | O | X | 32.00 | ||||||||||||||||||||||||||||||||||||||||||||||||
| 31.00 | 2 | • | X | 8 | X | O | 31.00 | ||||||||||||||||||||||||||||||||||||||||||||||
| 30.00 | X | O | • | X | O | X | O | X | 30.00 | ||||||||||||||||||||||||||||||||||||||||||||
| 29.00 | X | O | • | 7 | O | X | O | X | 29.00 | ||||||||||||||||||||||||||||||||||||||||||||
| 28.00 | 1 | O | • | X | O | 9 | X | Bot | 28.00 | ||||||||||||||||||||||||||||||||||||||||||||
| 27.00 | • | X | O | • | X | 6 | O | 27.00 | |||||||||||||||||||||||||||||||||||||||||||||
| 26.00 | X | • | X | O | • | X | O | X | 26.00 | ||||||||||||||||||||||||||||||||||||||||||||
| 25.00 | 1 | X | 6 | O | • | C | 3 | X | • | X | O | X | 25.00 | ||||||||||||||||||||||||||||||||||||||||
| 24.00 | B | O | 3 | O | 5 | O | • | B | O | X | O | • | X | 5 | 24.00 | ||||||||||||||||||||||||||||||||||||||
| 23.00 | X | O | X | O | X | O | • | X | O | X | O | • | X | 23.00 | |||||||||||||||||||||||||||||||||||||||
| 22.00 | X | 2 | X | O | X | O | • | X | O | X | O | X | X | 22.00 | |||||||||||||||||||||||||||||||||||||||
| 21.00 | X | O | 4 | 8 | • | A | O | X | O | X | O | X | X | • | 21.00 | ||||||||||||||||||||||||||||||||||||||
| 20.00 | A | O | • | X | O | O | X | O | X | O | X | • | 20.00 | ||||||||||||||||||||||||||||||||||||||||
| 19.50 | X | O | • | X | X | O | O | X | O | X | • | 19.50 | |||||||||||||||||||||||||||||||||||||||||
| 19.00 | X | 9 | X | • | • | X | O | X | O | X | 4 | • | 19.00 | ||||||||||||||||||||||||||||||||||||||||
| 18.50 | X | O | X | O | • | X | • | X | O | 9 | O | X | X | • | 18.50 | ||||||||||||||||||||||||||||||||||||||
| 18.00 | X | O | X | O | • | X | O | • | 7 | 8 | X | • | O | X | O | X | • | 18.00 | |||||||||||||||||||||||||||||||||||
| 17.50 | 9 | O | A | X | O | X | • | X | O | X | • | O | X | O | X | • | 17.50 | ||||||||||||||||||||||||||||||||||||
| 17.00 | X | X | O | 2 | X | X | 5 | X | O | X | O | • | O | X | O | X | • | 17.00 | |||||||||||||||||||||||||||||||||||
| 16.50 | 5 | O | X | O | X | O | X | O | X | O | X | O | 6 | • | O | O | X | • | 16.50 | ||||||||||||||||||||||||||||||||||
| 16.00 | 3 | X | O | 7 | O | X | X | O | X | O | 4 | O | O | X | • | O | X | • | 16.00 | ||||||||||||||||||||||||||||||||||
| 15.50 | X | O | X | 6 | X | O | B | O | X | X | 3 | O | X | O | X | • | O | X | • | 15.50 | |||||||||||||||||||||||||||||||||
| 15.00 | X | O | X | O | X | O | X | O | C | O | X | O | X | • | O | • | O | • | 15.00 | ||||||||||||||||||||||||||||||||||
| 14.50 | X | 4 | O | O | X | O | X | O | X | O | • | • | • | 14.50 | |||||||||||||||||||||||||||||||||||||||
| 14.00 | 2 | O | O | X | O | X | • | 14.00 | |||||||||||||||||||||||||||||||||||||||||||||
| 13.50 | X | O | O | X | • | 13.50 | |||||||||||||||||||||||||||||||||||||||||||||||
| 13.00 | X | O | X | • | 13.00 | ||||||||||||||||||||||||||||||||||||||||||||||||
| 12.50 | X | • | 1 | X | • | 12.50 | |||||||||||||||||||||||||||||||||||||||||||||||
| 12.00 | X | • | O | • | 12.00 | ||||||||||||||||||||||||||||||||||||||||||||||||
| 11.50 | 1 | • | • | 11.50 | |||||||||||||||||||||||||||||||||||||||||||||||||
| 11.00 | X | • | 11.00 | ||||||||||||||||||||||||||||||||||||||||||||||||||
| 10.50 | • | C | • | 10.50 | |||||||||||||||||||||||||||||||||||||||||||||||||
| 10.00 | 5 | • | • | B | • | 10.00 | |||||||||||||||||||||||||||||||||||||||||||||||
| 9.50 | • | 4 | O | 3 | • | X | • | 9.50 | |||||||||||||||||||||||||||||||||||||||||||||
| 9.00 | O | 2 | O | 2 | O | X | • | 9.00 | |||||||||||||||||||||||||||||||||||||||||||||
| 8.50 | O | X | 7 | X | O | A | • | 8.50 | |||||||||||||||||||||||||||||||||||||||||||||
| 8.00 | A | X | 8 | 1 | 4 | 9 | • | 8.00 | |||||||||||||||||||||||||||||||||||||||||||||
| 7.50 | B | • | 9 | X | 7 | 8 | • | 7.50 | |||||||||||||||||||||||||||||||||||||||||||||
| 7.00 | • | A | X | 8 | 7 | • | 7.00 | ||||||||||||||||||||||||||||||||||||||||||||||
| 6.50 | O | 9 | X | • | 6.50 | ||||||||||||||||||||||||||||||||||||||||||||||||
| 6.00 | 1 | X | • | 6.00 | |||||||||||||||||||||||||||||||||||||||||||||||||
| 5.50 | 2 | • | 5.50 | ||||||||||||||||||||||||||||||||||||||||||||||||||
| 14 | 15 | 16 | 17 | 18 | 19 | 20 |
| ALGT Allegiant Travel Company ($185.16) - Aerospace Airline - ALGT completed a spread triple top buy signal on Wednesday, marking the stock’s second consecutive buy signal. ALGT is a 4 for 5’er within the favored aerospace airline sector. From here, support sits at $178. Earnings are expected on 1/27/21. |
| BAC Bank of America ($30.06) - Banks - BAC broke through prior resistance going back to June with a move to $30. This 4 for 5'er has been in a positive trend since June and on an RS buy signal versus the market since March of 2012. Recent price action has put BAC into heavily overbought territory, so those wishing to initiate a position may be best served to wait for a pullback or price normalization. Support is offered at $23 with overhead resistance at $35. BAC offers a yield of 2.39%. |
| CAL Caleres Inc. ($15.35) - Textiles/Apparel - CAL broke a double top at $15, which marks the stock’s second consecutive buy signal. CAL is a 5 for 5’er within the favored textiles/apparel sector that just experienced a flip to positive weekly momentum. From here, support sits at $11.50. |
| CCK Crown Holdings, Inc. ($100.01) - Business Products - CCK broke a spread quadruple top at $100 in Wednesday's trading, taking out resistance that had been in place since November and marking new all-time high for the stock. The technical picture for CCK is positive as it is a 3 for 5'er that ranks in the top quintile of the favored business products sector matrix. It also sits one box away from returning to a market RS buy signal for the first time since 2017, which would elevate it to a 4 for 5'er. The first sell signal would come with a move to $94. |
| DAR Darling Ingredients Inc. ($58.88) - Food Beverages/Soap - Shares of DAR sharply advanced on Wednesday, reversing up into a column of Xs to give an eighth consecutive buy signal and print a new all-time chart high. The 5 for 5'er ranks in the top decile of the food beverages/soap stock sector matrix and has been on an RS buy signal versus the market for over two years now. The weight of the evidence is positive; however, those looking to initiate new long exposure may look for a pullback from current levels. Initial support is offered around $54. |
| FLGT Fulgent Genetics Inc ($50.87) - Biomedics/Genetics - FLGT shares pushed higher today to break a double top at $52 to mark its fourth consecutive buy signal. This 5 for 5'er has been in a positive trend since November and on an RS buy signal versus the market since April. FLGT is actionable at current levels with a weekly overbought/oversold reading of 31%. From here, support is offered at $43. |
| GPI Group 1 Automotive, Inc. ($130.26) - Autos and Parts - GPI returned to a buy signal with a double top breakout at $128 before moving higher to $130. GPI is a 3 for 5’er within the favored autos and parts sector that has support offered at $116. |
| MSTR MicroStrategy Inc ($389.97) - Software - Shares of MSTR reversed up into a column of Xs Wednesday and broke a double top at $380, marking a fourth consecutive buy signal and its highest level since 2000. This 4 for 5'er ranks 1st out of 120 names in the software sector RS matrix and has been in a positive trend since July. The weight of the technical evidence is overwhelmingly positive here, however, MSTR is now in heavily overbought territory so those looking to add exposure may be best served to wait for a pullback or normalization of the trading band. Initial support can be found at $344 with further support found at $324, $288, $280 and $276. Note that earnings are expected on 1/26/2021. |
| TSLA Tesla Inc. ($694.00) - Autos and Parts - TSLA broke a double top at $688 before moving higher to $696 today, marking the stock’s fourth consecutive buy signal and new all-time high. TSLA is a perfect 5 for 5’er that ranks #1 out of 53 names in the favored autos and parts sector. TSLA expects earnings on 1/27/21. From here, support sits at $656. |
| V Visa Inc. ($218.36) - Finance - V moved higher Wednesday to break a spread quadruple top at $220, which also marked a new all-time high. This 4 for 5'er moved to a positive trend in November and has been on an RS buy signal against the market since 2012. The overall weight of the evidence is positive here. Exposure may be considered at current levels, with initial support offered at $204. Note that earnings are expected on 1/28/2021. |
| Name | Option Symbol | Action | Stop Loss |
|---|---|---|---|
| International Paper Company - $49.64 | IP2116D47.5 | Buy the April 47.50 calls at 4.50 | 46.00 |
| Name | Option | Action |
|---|---|---|
| Freeport-McMoRan Inc. ( FCX) | Jan. 16.00 Calls | Raise the option stop loss to 8.45 (CP: 10.45) |
| Johnson Controls International PLC ( JCI) | Jan. 42.00 Calls | Raise the option stop loss to 2.70 (CP: 4.20) |
| Apple Inc. ( AAPL) | Apr. 120.00 Calls | Stopped at 19.25 (CP: 18.55) |
| Monster Beverage Corp. ( MNST) | Mar. 85.00 Calls | Raise the option stop loss to 6.80 (CP: 8.80) |
| Name | Option Symbol | Action | Stop Loss |
|---|---|---|---|
| Digital Realty Trust, Inc. - $138.35 | DLR2116P140 | Buy the April 140.00 puts at 9.90 | 146.00 |
| Name | Option | Action |
|---|---|---|
| Gilead Sciences, Inc. (GILD) | Mar. 60.00 Puts | Initiate a stock price stop of 62.00 (CP: 56.59) |
| Name | Option Sym. | Call to Sell | Call Price | Investment for 500 Shares | Annual Called Rtn. | Annual Static Rtn. | Downside Protection |
|---|---|---|---|---|---|---|---|
| Sysco Corporation $72.83 | SYY2121E75 | May. 75.00 | 5.50 | $34,288.95 | 21.32% | 17.66% | 6.43% |
| Name | Action |
|---|---|
| Marathon Petroleum Corp. (MPC) - 40.73 | Sell the April 45.00 Calls. |
| Phillips-Van Heusen Corporation (PVH) - 93.44 | Sell the March 90.00 Calls. |
| Comerica Incorporated (CMA) - 55.22 | Sell the April 57.50 Calls. |
| American International Group, Inc. (AIG) - 37.16 | Sell the May 40.00 Calls. |
| L Brands Inc. (LB) - 37.59 | Sell the May 40.00 Calls. |
| Synovus Financial Corp. (SNV) - 31.78 | Sell the March 32.00 Calls. |
| Citizens Financial Group Inc (CFG) - 34.88 | Sell the March 35.00 Calls. |
| Snap Inc (SNAP) - 51.23 | Sell the March 55.00 Calls. |
| Ballard Power Systems, Inc. (BLDP) - 22.07 | Sell the March 24.00 Calls. |
| Kimco Realty Corporation (KIM) - 14.50 | Sell the April 15.00 Calls. |
| Freeport-McMoRan Inc. (FCX) - 24.74 | Sell the April 26.00 Calls. |
| Name | Covered Write |
|---|---|
|
|
|
Daily Equity & Market Analysis
Loading, Please Wait...
