
With just one trading day left in the calendar year, today we want to review some recent notable chart action that has taken place as well as provide an overview of where we stand as we enter 2021.
Portfolio View - Major Market ETFs
| Symbol | Name | Price | Yield | PnF Trend | RS Signal | RS Col. | Fund Score | 200 Day MA | Weekly Mom |
|---|---|---|---|---|---|---|---|---|---|
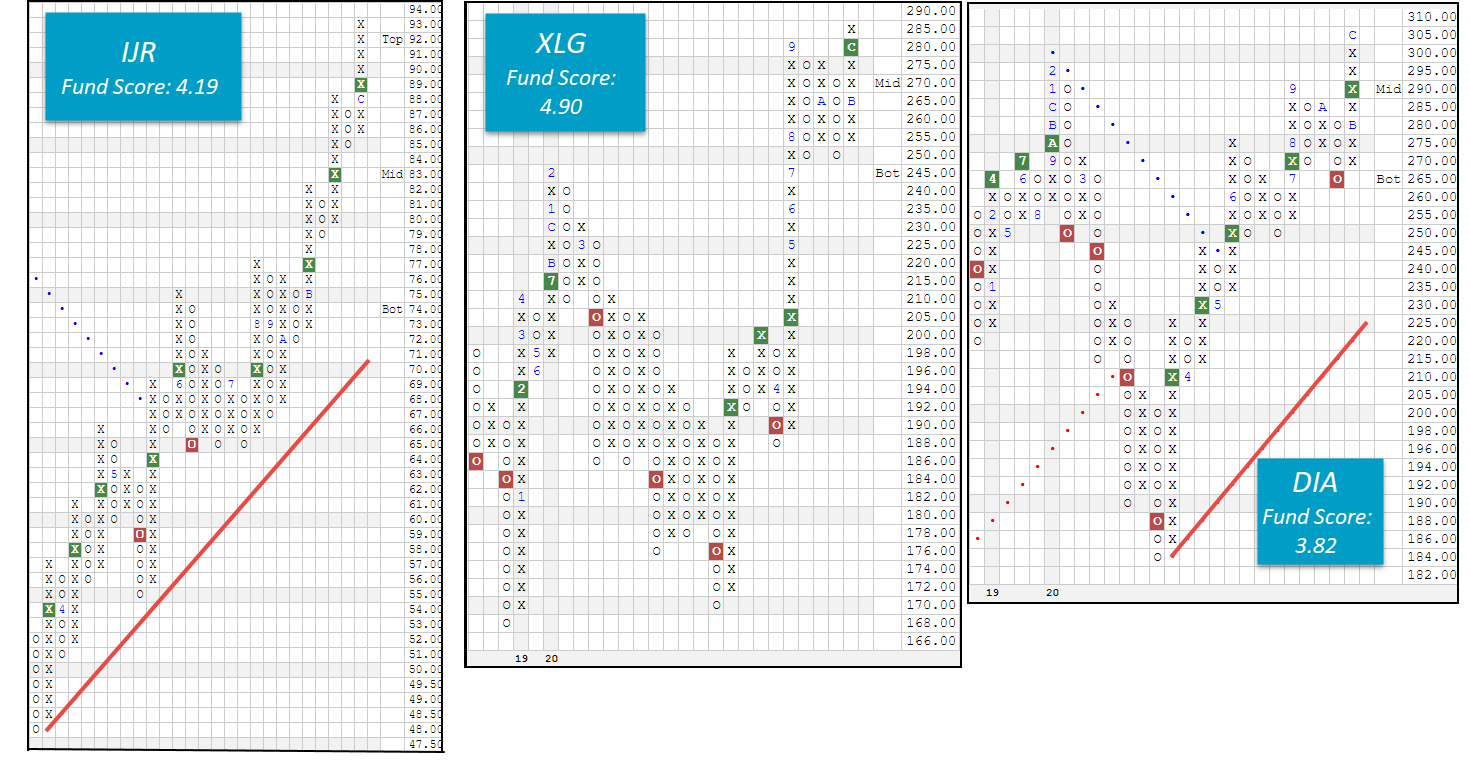
| DIA | SPDR Dow Jones Industrial Average ETF Trust | 303.46 | 2.03 | Positive | O | 3.82 | 266.44 | -2W | |
| EEM | iShares MSCI Emerging Markets ETF | 51.02 | 2.38 | Positive | Sell | O | 5.24 | 42.51 | -2W |
| EFA | iShares MSCI EAFE ETF | 73.42 | 2.31 | Positive | Sell | O | 3.14 | 62.62 | -2W |
| FM | iShares MSCI Frontier 100 ETF | 28.53 | 2.90 | Positive | Sell | O | 1.19 | 24.74 | -3W |
| IJH | iShares S&P MidCap 400 Index Fund | 227.66 | 1.48 | Positive | Buy | O | 4.33 | 184.72 | -1W |
| IJR | iShares S&P SmallCap 600 Index Fund | 90.84 | 1.40 | Positive | Buy | O | 4.19 | 71.13 | -1W |
| QQQ | Invesco QQQ Trust | 312.96 | 0.56 | Positive | Buy | X | 4.80 | 258.21 | +6W |
| RSP | Invesco S&P 500 Equal Weight ETF | 125.83 | 1.73 | Positive | Buy | X | 4.24 | 106.14 | -2W |
| SPY | SPDR S&P 500 ETF Trust | 371.46 | 1.53 | Positive | O | 4.09 | 321.59 | -1W | |
| XLG | Invesco S&P 500 Top 50 ETF | 285.43 | 1.28 | Positive | O | 4.49 | 247.72 | +6W |
Additional Comments:
The last week of market action was generally a positive one as eight of the 10 major market funds covered in this report finished the week in the black while just two finished in negative territory. The winner for the week was the iShares MSCI EAFE ETF EFA with a gain of 2.60%. The iShares S&P SmallCap 600 Index Fund IJR and the iShares S&P MidCap 400 Index Fund IJH each tied for the worst-performing fund over the last seven days with respective losses of -0.31%. With just one trading day left in the calendar year, today we want to review some recent notable chart action that has taken place as well as provide an overview of where we stand as we enter 2021.

This week, we saw the iShares S&P SmallCap 600 Index Fund IJR, Invesco S&P 500 Top 50 ETF XLG, and SPDR Dow Jones Industrial Average ETF Trust DIA each print new all-time highs on their respective default trend charts as equity markets continue to move higher. As a result, all seven of the US major market funds are now trading well above their bullish support lines on Point & Figure buy signals and currently sit at record highs. Furthermore, despite the drastic COVID-19 sell-off in the first quarter of the year, each US major market fund is positioned to finish out 2020 with gains in excess of 6% and fund scores above the coveted 3.00-threshold.
On the international side of things, today, we’ve seen the iShares MSCI EAFE ETF EFA move to $74, which marks a new multi-year high on the chart. Similarly, EEM has continued to hold steady at $51 all month, a high watermark last recorded in early 2018. Despite each of these international funds sitting at rally highs, we have seen considerable outperformance from emerging markets this year when compared to their developed counterparts with EEM posting a gain of 13.71% versus EFA’s 5.73%. Additionally, EEM is outscoring EFA by over two whole score points. In fact, EEM is the highest-scoring of all major market funds at this time with a score of 5.24, followed by the QQQ’s score of 4.8. On the other side of the coin, the iShares MSCI Frontier 100 ETF FM is the only major market fund set to finish the year in the red with a current year-to-date return of -6% and is the only major market fund that is scoring below the 3.00 threshold at 1.19.

As we finish up the final two trading days of 2020, we find that the major market ETFs are on the overbought side of the distribution curve with an average OBOS% reading of 61.70%. The EFA is the most heavily overbought fund with an OBOS% reading of 90%, followed by the IJR’s OBOS% reading of 83%. We will continue to monitor these areas of the global equity market for potential pullbacks and price normalization as we move into the new year.
![]()
In the table below, we have provided an update to the initial support levels for all ten major market ETFs. If you have any questions on any of these charts, please do not hesitate to reach out to our analyst team by phone (804-320-8511) or by email (dwa@dorseywright.com).

