
Most Requested Symbols

As we do each year, today we've created a list of candidates for tax loss selling bounce plays.
Today's featured stock is Enphase Energy Inc (ENPH)
CRWD, ESTC, ALRM, ALGT, AN, CPRI, GES, JWN, RCL, YETI, TWST, & ALGN.
Call: Etsy, Inc. (ETSY), Put: International Business Machines (IBM), Covered Write: The TJX Companies (TJX)
Beginners Series Webinar: Join us on Friday, December 4th, at 2 PM (ET) for our NDW Beginners Series Webinar. This week's topic is Creating a Custom Model. Register Here.
We are excited to announce phase three of the Nasdaq Dorsey Wright Model Builder with the launch of Matrix and FSM-based Relative Strength (RS) Testing Service. As part of this launch, we are granting you free access to the Service for the remainder of 2020. The tool is designed to help you more easily design, test, implement, and monitor custom models powered by the Nasdaq Dorsey Wright methodology. Through the end of December, be sure to join us each Thursday at 1 pm EST for a custom modeler demo presented by the analyst team.
11/12/2020: Matrix Model Builder Demo Replay- Click here
11/5/2020: FSM Model Builder Demo Replay – Click here
Click here to register for future Nasdaq Dorsey Wright Model Builder Demos
December is historically a strong month for stocks (and the momentum factor), producing positive S&P 500 (SPX) returns in 46 of the past 62 years, the highest count of any other month. However, after a monumental rally for equities many wonder if there is any gas left in the tank for the popular benchmark. While we cannot know for sure, looking at Novembers past we do see that after a positive month December still closed in the black 73% of the time, on par with its raw average. This “win percentage” only drops slightly if we look at Novembers where SPX gained over 5%, as 67% of Decembers were still positive. Although one thing to keep in mind is that December has historically produced an average return of 1.39% since 1958, and following a positive or strongly positive (5%+) November the returns are slightly below the historic monthly average.
When we increased our timeframe, a positive November also signaled a favorable path for equities in the new year with 80% of returns positive six months out. Note the medians are higher in each instance as well, indicating a positive skew. So if historical precedent decides to mean revert at the end of 2020, we could likely see another positive month but perhaps not to the same degree as usual.


This is the time of year when investors sell laggard stocks from their portfolio to realize losses before the end of the of year and offset any taxable gains they may have. Last Friday, we published an article on tax loss harvesting with a list of stocks that may be good candidates to sell for this purpose. When many investors are selling the same underperforming stocks in the last few months of the year it creates the potential for those stocks to become oversold and bounce as tax selling subsides.
Here are a few guidelines about tax loss harvesting which are also good to bear in mind when attempting tax loss bounce plays as the tax rules can impact when investors sell (and potentially repurchase) these stocks. First, consult your CPA for the specific long-term and short-term holding periods as well as how the tax rates affect your customers. If selling a long position for a taxable loss, the trade date must be on, or before, December 31st, 2019. The IRS requires that the trade date be the 31st (this year), not the settlement date, which is a source of some confusion each year. Current tax laws also limit the window for avoiding wash sale treatment, whereby an investor must have transacted buys in November (or before) to double a position, in order to sell a matching position for a capital loss on December 31st. Also, to avoid other aspects of the wash sale restrictions, you cannot repurchase a stock sold for a loss for 30 days following your tax loss sale. We certainly are not tax professionals and do not solicit tax advice, but those are some tax basics for this time of year. Again, we recommend that you consult your CPA for the specific rules.
To reiterate, the basic concept of tax loss bounce plays is to capitalize on saturation of supply caused by tax-loss selling of weak, depressed, often small-cap stocks. Those are the stocks most prone to being sold (typically towards the end of the year) to offset gains in one's portfolio (for tax reasons). Typical tax-loss selling brings a weakened stock down even further as we near the end of the year - this is part of the “Pre-January Effect” - but eventually, all those that want to sell for tax reasons have already done so, and the stock finds a bottom. Here’s an example – Adtalem Global Education Inc. ATGE.
ATGE Adtalem Global Education Inc. ($28.93) - Business Products - is a 0 for 5’er that ranks 84th out of 92 names in the business products sector matrix. The stock has been trading in a negative trend since May of 2019. ATGE is down just over 18% this year and around 50% from its 2019 peak, making it a prime candidate for tax loss harvesting. There are already some indications that ATGE may have found a near-term bottom and that demand has increased as it formed but did not break a double bottom at $24 in October, before reversing up and giving a double top buy signal at $28. ATGE is currently trading around $29 and does not face any overhead resistance on its default chart until $33, where its bullish support line currently sits. The nearest support is more than 20% away, so those interested playing a potential bounce may wish to use a dollar or percent-based stop.
![]()
Keep in mind that most of these plays should be considered aggressive in nature (more of a bottom fish play), as they are typically both counter-trend, and often have negative RS, and therefore are specific just to short-term holdings. You need to be willing to take profits upon getting a bounce, sticking to the reason why you are buying the stock, especially if a bounce does not impact a change in trend or RS. Furthermore, if you get to the 3rd or 4th week in January and you have not seen a bounce in the stock you are playing, then sell it. As well, be sure to look at the chart of any names you choose to buy in order to set a stop loss point on the downside. In some instances, you will need to set a dollar amount stop loss point if no viable PnF breakdown or violation of support is available. With that, here is this year's list for tax loss selling bounce candidates, with the focus on Small Cap stocks. This list can be found under "DWA Portfolios" in the Portfolio tool and it is called "Tax Loss Selling Bounce Plays 12.3.20” or by clicking here.
| Symbol | Name | Recent Price | DWA Sector | Tech Attrib | YTD Perf. |
| AJRD | Aerojet Rocketdyne Holdings Inc. | $38.50 | Aerospace Airline | 0 | -15.68 |
| ALKS | Alkermes Incorporated | $18.82 | Biomedics/Genetics | 0 | -7.74 |
| ARCH | Arch Resources Inc | $36.41 | Oil | 1 | -49.25 |
| ATGE | Adtalem Global Education Inc. | $28.61 | Business Products | 0 | -18.19 |
| AUPH | Aurinia Pharmaceuticals Inc | $14.66 | Drugs | 1 | -27.64 |
| AVA | Avista Corporation | $37.43 | Utilities/Electricity | 0 | -22.17 |
| BEN | Franklin Resources, Inc. | $22.49 | Wall Street | 0 | -13.43 |
| BLKB | Blackbaud, Inc. | $55.09 | Software | 0 | -30.79 |
| BLUE | Bluebird Bio | $46.19 | Biomedics/Genetics | 0 | -47.36 |
| BMRN | BioMarin Pharmaceutical Inc. | $79.86 | Biomedics/Genetics | 0 | -5.55 |
| BTI | British American Tobacco Sp-Adr (United Kingdom) ADR | $35.99 | Food Beverages/Soap | 0 | -15.24 |
| CARA | Cara Therapeutics Inc | $14.90 | Biomedics/Genetics | 0 | -7.51 |
| CARG | CarGurus, Inc. Class A | $24.98 | Retailing | 0 | -28.99 |
| CBD | Brasil Distr Pao Acu-Spr Adr (Brazil) ADR | $12.80 | Food Beverages/Soap | 0 | -41.47 |
| CINF | Cincinnati Financial Corporation | $79.93 | Insurance | 0 | -23.98 |
| COG | Cabot Oil & Gas Corporation | $17.05 | Oil | 0 | -2.07 |
| COLL | Collegium Pharmaceuticals Inc | $18.70 | Drugs | 0 | -9.16 |
| CONN | Conn's, Inc. | $11.93 | Retailing | 0 | -3.71 |
| DLX | Deluxe Corporation | $26.00 | Business Products | 0 | -47.92 |
| EHTH | eHealth, Inc. | $75.76 | Insurance | 0 | -21.15 |
| EPZM | Epizyme | $13.38 | Biomedics/Genetics | 1 | -45.61 |
| FCN | FTI Consulting, Inc. | $104.47 | Business Products | 0 | -5.59 |
| GBDC | Golub Capital BDC LLC | $14.06 | Finance | 0 | -23.81 |
| GBT | Global Blood Therapeutics Inc | $44.78 | Drugs | 0 | -43.67 |
| GILD | Gilead Sciences, Inc. | $61.13 | Biomedics/Genetics | 0 | -5.92 |
| GSK | GlaxoSmithKline Plc. (United Kingdom) ADR | $37.40 | Drugs | 0 | -20.41 |
| HE | Hawaiian Electric Industries, Inc. | $36.29 | Utilities/Electricity | 0 | -22.56 |
| IBM | International Business Machines Corp. | $124.62 | Computers | 0 | -7.03 |
| IFF | International Flavors & Fragrances Inc. | $112.51 | Chemicals | 0 | -12.8 |
| INCY | Incyte Genomics, Inc. | $82.27 | Biomedics/Genetics | 0 | -5.78 |
| INTC | Intel Corporation | $49.90 | Semiconductors | 0 | -16.62 |
| INVA | Theravance Inc | $10.45 | Drugs | 0 | -26.24 |
| IONS | Ionis Pharmaceuticals Inc. | $51.31 | Biomedics/Genetics | 0 | -15.06 |
| JOBS | 51job, Inc. (China) ADR | $72.80 | Business Products | 0 | -14.25 |
| KL | Kirkland Lake Gold Inc | $41.22 | Precious Metals | 1 | -6.47 |
| LNTH | Lantheus Holdings Inc | $13.49 | Healthcare | 0 | -34.23 |
| LUMN | Lumen Technologies Inc. | $10.50 | Telephone | 0 | -20.51 |
| MLCO | Melco Crown Entertainment Ltd. (Hong Kong) ADR | $18.21 | Gaming Bear Alert | 0 | -24.66 |
| MO | Altria Group Inc. | $40.02 | Food Beverages/Soap | 0 | -19.82 |
| NBIX | Neurocrine Biosciences | $97.17 | Biomedics/Genetics | 0 | -9.6 |
| NEWR | New Relic Inc | $60.35 | Software | 0 | -8.16 |
| NFG | National Fuel Gas Company | $40.84 | Gas Utilities | 0 | -12.25 |
| NTCT | NetScout Systems, Inc. | $24.03 | Software | 0 | -0.17 |
| NUVA | NuVasive, Inc. | $46.90 | Biomedics/Genetics | 0 | -39.36 |
| OMER | Omeros Corporation | $12.43 | Biomedics/Genetics | 0 | -11.78 |
| POR | Portland General Electric Company | $41.71 | Utilities/Electricity | 0 | -25.24 |
| PRGO | Perrigo Co. PLC | $47.96 | Drugs | 0 | -7.16 |
| SAP | SAP AG (Germany) ADR | $122.50 | Software | 0 | -8.57 |
| SIMO | Silicon Motion Technology Corporation (Taiwan) ADR | $38.94 | Semiconductors | 0 | -23.21 |
| TDC | Teradata Corporation | $21.46 | Computers | 0 | -19.84 |
| TDS | Telephone & Data Systems Inc | $19.13 | Telephone | 0 | -24.77 |
| THS | TreeHouse Foods, Inc. | $40.36 | Food Beverages/Soap | 0 | -16.78 |
| TNK | Teekay Tankers, Ltd. | $11.52 | Transports/Non Air | 0 | -51.94 |
| TRP | TransCanada Corporation | $44.99 | Gas Utilities | 1 | -15.61 |
| UVE | Universal Insurance Holdings, Inc. | $14.27 | Insurance | 0 | -49.02 |
| WAFD | Washington Federal, Inc. | $24.45 | Savings & Loans | 1 | -33.29 |
| ZGNX | Zogenix, Inc. | $21.49 | Drugs | 0 | -58.78 |
| ZUO | Zuora, Inc. Class A | $11.58 | Software | 0 | -19.19 |
Data as of 12/2/20.
As we’ve seen a broadening out of the equity markets from domestic and international or large and small, fixed income as an asset class has weakened from an asset class group scores perspective. Currently, there is only one fixed income group that has a positive score direction which is Convertible Bonds. It’s probably not a coincidence that this is a group with a strong positive correlation to equity markets. Even a group that was extremely strong over the past few months has weakened significantly, as the Inflation Protection group has a negative score direction of 2.12 despite a continuation to the downside for the US Dollar. The low rate environment has investors struggling to find areas of strength to fill out their fixed-income allocations.
With fixed income weakening as an asset class, there a good number of groups with high overbought/oversold readings. A few of these groups are All Municipals, Floating Rate, Corporate Bond High Yield, and a few global fixed income groups. These groups are also exhibiting shorter-term momentum characteristics as they all have held on average positive weekly momentum for three or more weeks.
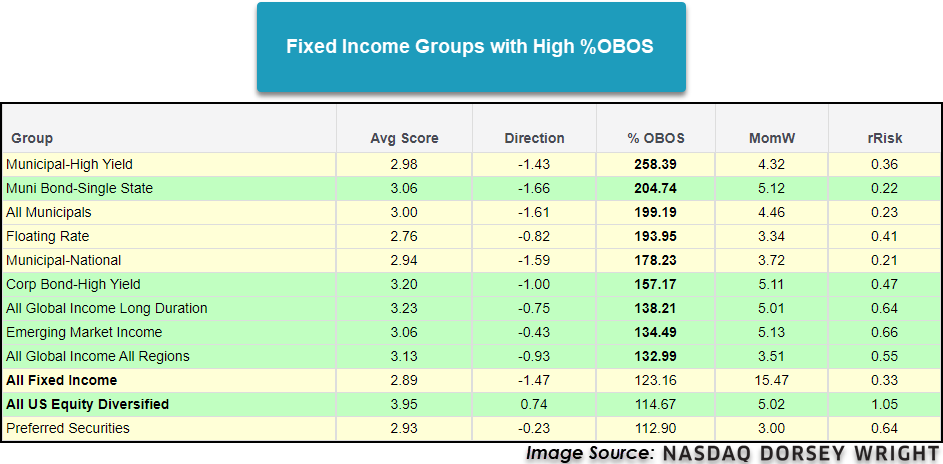
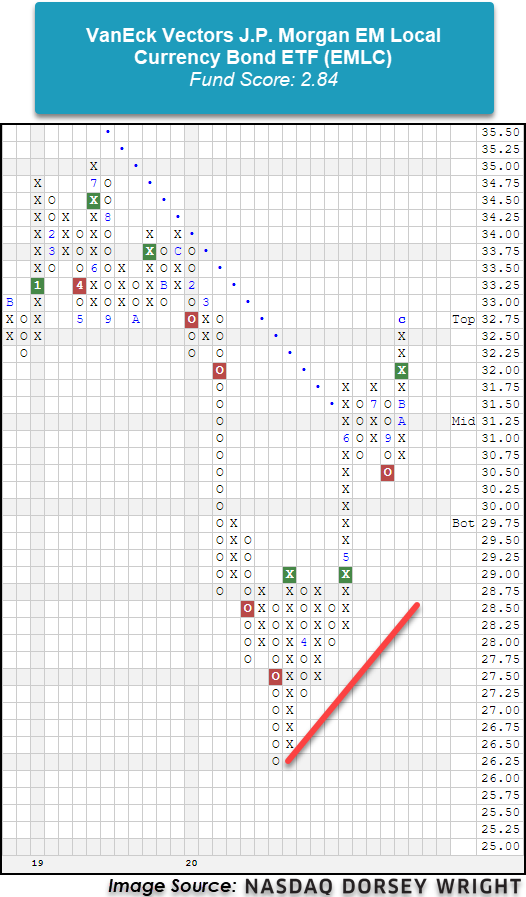
The Emerging Market Income group is one area that has an average group score above 3.00, and more specifically local currency bond funds have seen tailwinds from the falling dollar environment. One such fund is the VanEck Vectors J.P. Morgan EM Local Currency Bond ETF EMLC which has a suboptimal fund score of 2.84 but a highly positive score direction of 2.19 highlighting its improvement over the last six months. Recent price action has put the fund into heavily overbought territory with a weekly overbought/oversold reading of 81%. EMLC offers a yield of 5.27%. Even though EMLC isn’t scoring above the 3.00 threshold, it will be a fund to monitor as strong and improving areas within fixed income are fairly slim.
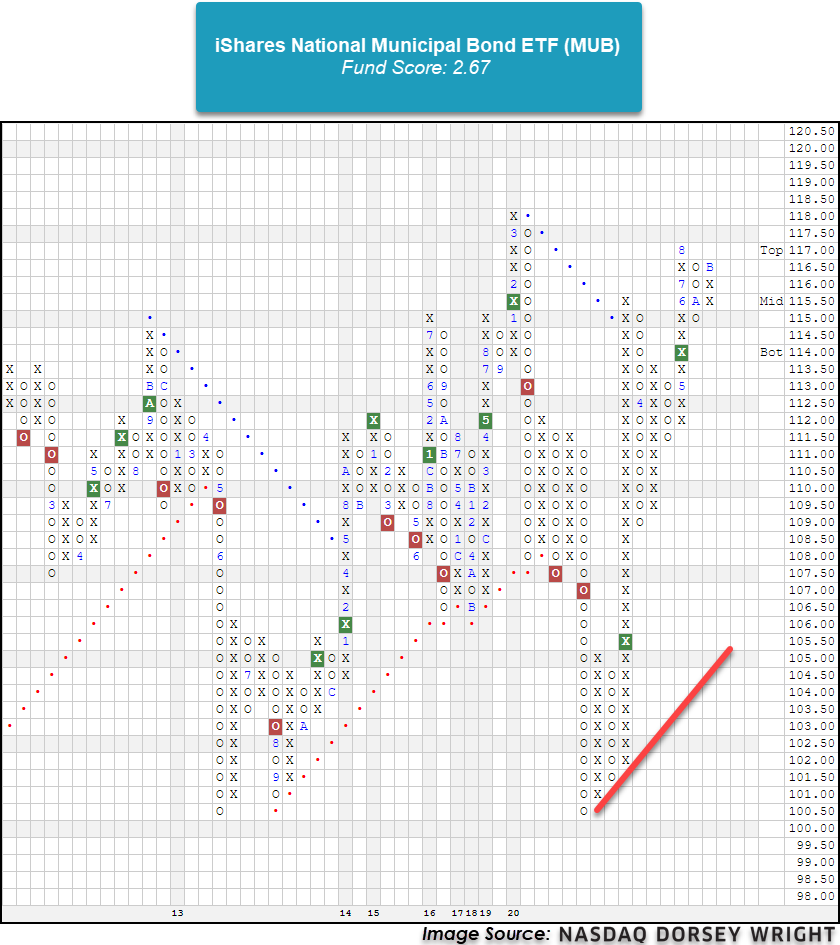
Municipals are another area that, despite score deterioration, have positive weekly momentum along with high weekly overbought/oversold readings. The All Municipals group has an average group score of 3.00 but a negative score direction of 1.61. The group has an average overbought/oversold reading of 199% with average weekly momentum of 4.46. The iShares National Municipal Bond ETF MUB has a fund score of 2.67 and is trading in a positive trend. In terms of its trading band, MUB is actionable with a weekly overbought/oversold reading of 61% and offers a yield of 2.18%.
With fixed income as an asset class taking a backseat to domestic and international equities, these are a few areas to keep an eye on as potential areas to fill out your client’s fixed income sleeve. Equities have taken the lion’s share of attention as of late, but it is still important to monitor fixed income as it is typically a portion of clients’ portfolios. A few of the areas discussed may not be ideal in terms of average scores or direction, but they could potentially be additive in the future. As always, be sure to visit the Asset Class Group Scores page to stay on top of market trends and changes.

Average Level
44.70
| AGG | iShares US Core Bond ETF |
| USO | United States Oil Fund |
| DIA | SPDR Dow Jones Industrial Average ETF |
| DVY | iShares Dow Jones Select Dividend Index ETF |
| DX/Y | NYCE U.S.Dollar Index Spot |
| EFA | iShares MSCI EAFE ETF |
| FXE | Invesco CurrencyShares Euro Trust |
| GLD | SPDR Gold Trust |
| GSG | iShares S&P GSCI Commodity-Indexed Trust |
| HYG | iShares iBoxx $ High Yield Corporate Bond ETF |
| ICF | iShares Cohen & Steers Realty ETF |
| IEF | iShares Barclays 7-10 Yr. Tres. Bond ETF |
| LQD | iShares iBoxx $ Investment Grade Corp. Bond ETF |
| IJH | iShares S&P 400 MidCap Index Fund |
| ONEQ | Fidelity Nasdaq Composite Index Track |
| QQQ | Invesco QQQ Trust |
| RSP | Invesco S&P 500 Equal Weight ETF |
| IWM | iShares Russell 2000 Index ETF |
| SHY | iShares Barclays 1-3 Year Tres. Bond ETF |
| IJR | iShares S&P 600 SmallCap Index Fund |
| SPY | SPDR S&P 500 Index ETF Trust |
| TLT | iShares Barclays 20+ Year Treasury Bond ETF |
| GCC | WisdomTree Continuous Commodity Index Fund |
| VOOG | Vanguard S&P 500 Growth ETF |
| VOOV | Vanguard S&P 500 Value ETF |
| EEM | iShares MSCI Emerging Markets ETF |
| XLG | Invesco S&P 500 Top 50 ETF |
| Symbol | Company | Sector | Current Price | Action Price | Target | Stop | Notes |
|---|---|---|---|---|---|---|---|
| LPX | Louisiana-Pacific Corporation | Forest Prods/Paper | $34.21 | low 30s | 45.50 | 27 | 4 for 5'er, top third of FORE sector matrix, bullish triangle, pos wkly mom flip, 1.8% yield |
| TGTX | TG Therapeutics, Inc. | Biomedics/Genetics | $27.13 | upper 20s to mid 30s | 45.50 | 25 | 5 for 5'er, bullish triangle pattern, consec buy signals, testing multi-year high, pos trend |
| MXL | MaxLinear, Inc. | Semiconductors | $31.21 | 28 - 31 | 41 | 24 | 4 for 5'er, top third of SEMI sector matrix, spread six top breakout, R-R>2.0 |
| AOS | A.O. Smith Corporation | Building | $54.87 | mid to upper 50s | 72 | 47 | 4 for 5'er, four consec buy signals, mutli-year high, market RS buy signal since 9/2008, 1.86% yield |
| GOOS | Canada Goose Holdings Inc. | Textiles/Apparel | $32.49 | mid-to-upper 30s | 39.50 | 30 | 4 for 5'er, top 25% of favored TEXT sector matrix, triple top breakout, pot. cov. write |
| ALLY | Ally Financial Inc. | Finance | $31.05 | $29 - $32 | 33 | 25 | 5 for 5'er, top 10% of FINA sector matrix, mutliple consec buy signals, 2.45% yield, pot. cov. write |
| SPWR | Sunpower Corporation | Electronics | $21.65 | low 20s | 33.50 | 18 | 5 for 5'er, #3 of 59 names in ELEC sector matrix, pos wkly mom flip, pot cov. write |
| BECN | Beacon Roofing Supply, Inc. | Building | $36.43 | 36 - 40 | 56 | 30 | 4 for 5'er, top third of fav DWABUIL, consec buy signals, 52 week highs, pos weekly mom flip |
| AMRC | Ameresco Inc. | Machinery and Tools | $44.47 | low-to-mid 40s | 58 | 37 | 5 for 5'er, top 10% of favored MACH sector matrix, multiple buy signals, pullback from ATH |
| ENPH | Enphase Energy Inc | Electronics | $127.93 | low 130s to low 150s | 214 | 108 | 5 for 5'er, pullback from ATH, consec buy signals, pos weekly momentum, top 25% of DWAELEC |
| Symbol | Company | Sector | Current Price | Action Price | Target | Stop | Notes |
|---|
| Symbol | Company | Sector | Current Price | Action Price | Target | Stop | Notes |
|---|---|---|---|---|---|---|---|
| SAIL | SailPoint Technologies Holdings, Inc. | Software | $45.98 | mid 40s | $66 | $48 | See follow comment. |
| Comment |
|---|
| HSBC HSBC Holding PLC (United Kingdom) ADR ($28.27) R - Banks - HSBC moved to a buy signal. We will close our position. |
| FIVE Five Below Inc ($163.73) R - Household Goods - Raise stop to $138, the first sell signal on the chart. |
| SAIL SailPoint Technologies Holdings, Inc. R ($48.47) - Software - Okay to add new exposure here. We will raise our stop to $40, the first potential sell signal on the chart. |
ENPH Enphase Energy Inc R ($130.80) - Electronics - ENPH is a perfect 5 for 5’er that ranks in the top quartile of the electronics sector stock matrix. ENPH has maintained long-term strength versus its peers since moving to a buy signal in January 2019. Additionally, ENPH continues to trade well above the bullish support line and has given three consecutive buy signals, confirming that demand is in control. After completing a bullish triangle pattern at $124, ENPH rallied to $148, marking a new all-time high on the chart. This was followed by a pullback to $122, well above initial support offered at $116. With today’s market action, ENPH has reversed back up into Xs to $132. Okay to add new exposure in the low $130s to low $150s. We will set our initial stop at $108, which would violate multiple levels of support on the default chart. We will use a modified bullish price objective of $214 as our near-term price target.
| 148.00 | X | 148.00 | ||||||||||||||||||||||||||||||||||||||||||||||||||||
| 146.00 | X | O | 146.00 | |||||||||||||||||||||||||||||||||||||||||||||||||||
| 144.00 | X | O | 144.00 | |||||||||||||||||||||||||||||||||||||||||||||||||||
| 142.00 | X | O | 142.00 | |||||||||||||||||||||||||||||||||||||||||||||||||||
| 140.00 | X | O | 140.00 | |||||||||||||||||||||||||||||||||||||||||||||||||||
| 138.00 | X | O | 138.00 | |||||||||||||||||||||||||||||||||||||||||||||||||||
| 136.00 | X | O | 136.00 | |||||||||||||||||||||||||||||||||||||||||||||||||||
| 134.00 | X | O | 134.00 | |||||||||||||||||||||||||||||||||||||||||||||||||||
| 132.00 | X | C | x | 132.00 | ||||||||||||||||||||||||||||||||||||||||||||||||||
| 130.00 | X | O | x | 130.00 | ||||||||||||||||||||||||||||||||||||||||||||||||||
| 128.00 | X | X | O | x | 128.00 | |||||||||||||||||||||||||||||||||||||||||||||||||
| 126.00 | X | O | X | O | x | 126.00 | ||||||||||||||||||||||||||||||||||||||||||||||||
| 124.00 | X | O | X | O | x | 124.00 | ||||||||||||||||||||||||||||||||||||||||||||||||
| 122.00 | X | O | X | X | O | 122.00 | ||||||||||||||||||||||||||||||||||||||||||||||||
| 120.00 | X | O | X | O | X | 120.00 | ||||||||||||||||||||||||||||||||||||||||||||||||
| 118.00 | X | X | O | X | O | X | 118.00 | |||||||||||||||||||||||||||||||||||||||||||||||
| 116.00 | X | O | X | O | X | O | 116.00 | |||||||||||||||||||||||||||||||||||||||||||||||
| 114.00 | X | O | X | O | X | 114.00 | ||||||||||||||||||||||||||||||||||||||||||||||||
| 112.00 | X | O | X | O | X | 112.00 | ||||||||||||||||||||||||||||||||||||||||||||||||
| 110.00 | X | X | O | X | O | 110.00 | ||||||||||||||||||||||||||||||||||||||||||||||||
| 108.00 | X | O | X | O | X | X | Mid | 108.00 | ||||||||||||||||||||||||||||||||||||||||||||||
| 106.00 | X | O | X | O | X | O | X | X | 106.00 | |||||||||||||||||||||||||||||||||||||||||||||
| 104.00 | X | O | X | O | X | O | X | X | X | O | X | 104.00 | ||||||||||||||||||||||||||||||||||||||||||
| 102.00 | X | O | O | X | O | X | O | X | O | X | O | X | 102.00 | |||||||||||||||||||||||||||||||||||||||||
| 100.00 | X | O | X | O | X | O | X | O | X | O | X | 100.00 | ||||||||||||||||||||||||||||||||||||||||||
| 99.00 | X | O | X | O | X | O | X | O | X | O | X | 99.00 | ||||||||||||||||||||||||||||||||||||||||||
| 98.00 | X | O | X | O | O | X | O | X | O | X | 98.00 | |||||||||||||||||||||||||||||||||||||||||||
| 97.00 | X | O | X | O | X | O | B | O | X | 97.00 | ||||||||||||||||||||||||||||||||||||||||||||
| 96.00 | X | O | X | O | O | X | O | X | 96.00 | |||||||||||||||||||||||||||||||||||||||||||||
| 95.00 | X | O | X | O | X | O | X | 95.00 | ||||||||||||||||||||||||||||||||||||||||||||||
| 94.00 | X | O | X | O | O | 94.00 | ||||||||||||||||||||||||||||||||||||||||||||||||
| 93.00 | X | O | 93.00 | |||||||||||||||||||||||||||||||||||||||||||||||||||
| 92.00 | X | 92.00 | ||||||||||||||||||||||||||||||||||||||||||||||||||||
| 91.00 | X | 91.00 | ||||||||||||||||||||||||||||||||||||||||||||||||||||
| 90.00 | X | 90.00 | ||||||||||||||||||||||||||||||||||||||||||||||||||||
| 89.00 | X | 89.00 | ||||||||||||||||||||||||||||||||||||||||||||||||||||
| 88.00 | X | 88.00 | ||||||||||||||||||||||||||||||||||||||||||||||||||||
| 87.00 | X | 87.00 | ||||||||||||||||||||||||||||||||||||||||||||||||||||
| 86.00 | X | 86.00 | ||||||||||||||||||||||||||||||||||||||||||||||||||||
| 85.00 | A | 85.00 | ||||||||||||||||||||||||||||||||||||||||||||||||||||
| 84.00 | X | 84.00 | ||||||||||||||||||||||||||||||||||||||||||||||||||||
| 83.00 | X | 83.00 | ||||||||||||||||||||||||||||||||||||||||||||||||||||
| 82.00 | X | 82.00 | ||||||||||||||||||||||||||||||||||||||||||||||||||||
| 81.00 | X | • | 81.00 | |||||||||||||||||||||||||||||||||||||||||||||||||||
| 80.00 | 9 | X | • | 80.00 | ||||||||||||||||||||||||||||||||||||||||||||||||||
| 79.00 | X | O | X | • | 79.00 | |||||||||||||||||||||||||||||||||||||||||||||||||
| 78.00 | X | X | O | X | • | 78.00 | ||||||||||||||||||||||||||||||||||||||||||||||||
| 77.00 | X | X | O | X | O | X | • | 77.00 | ||||||||||||||||||||||||||||||||||||||||||||||
| 76.00 | X | X | X | O | X | O | X | O | X | X | • | 76.00 | ||||||||||||||||||||||||||||||||||||||||||
| 75.00 | X | O | X | O | X | O | X | O | X | O | X | O | X | • | 75.00 | |||||||||||||||||||||||||||||||||||||||
| 74.00 | X | O | X | O | X | O | X | O | X | O | X | O | X | X | • | 74.00 | ||||||||||||||||||||||||||||||||||||||
| 73.00 | X | O | X | O | O | O | O | X | O | X | O | X | • | 73.00 | ||||||||||||||||||||||||||||||||||||||||
| 72.00 | X | O | X | O | X | O | X | O | X | • | 72.00 | |||||||||||||||||||||||||||||||||||||||||||
| 71.00 | X | O | X | O | X | O | X | O | X | • | 71.00 | |||||||||||||||||||||||||||||||||||||||||||
| 70.00 | X | O | X | O | X | X | O | X | O | X | • | 70.00 | ||||||||||||||||||||||||||||||||||||||||||
| 69.00 | X | O | X | O | X | O | X | O | X | O | X | • | 69.00 | |||||||||||||||||||||||||||||||||||||||||
| 68.00 | X | O | O | X | O | X | O | X | O | • | 68.00 | |||||||||||||||||||||||||||||||||||||||||||
| 67.00 | X | O | X | O | X | O | X | • | 67.00 | |||||||||||||||||||||||||||||||||||||||||||||
| 66.00 | • | X | O | X | O | X | O | • | 66.00 | |||||||||||||||||||||||||||||||||||||||||||||
| 65.00 | • | X | X | O | X | O | • | 65.00 | ||||||||||||||||||||||||||||||||||||||||||||||
| 64.00 | • | X | X | O | X | O | X | • | 64.00 | |||||||||||||||||||||||||||||||||||||||||||||
| 63.00 | • | X | O | X | O | X | O | X | • | 63.00 | ||||||||||||||||||||||||||||||||||||||||||||
| 62.00 | • | X | O | X | O | X | X | O | X | • | Bot | 62.00 | ||||||||||||||||||||||||||||||||||||||||||
| 61.00 | • | X | O | X | O | X | O | 8 | O | X | • | 61.00 | ||||||||||||||||||||||||||||||||||||||||||
| 60.00 | X | • | X | O | O | X | O | X | O | X | • | 60.00 | ||||||||||||||||||||||||||||||||||||||||||
| 59.00 | O | 6 | O | • | X | O | X | O | X | O | • | 59.00 | ||||||||||||||||||||||||||||||||||||||||||
| 58.00 | O | X | O | • | X | X | O | X | O | • | 58.00 | |||||||||||||||||||||||||||||||||||||||||||
| 57.00 | O | X | O | X | O | X | O | • | 57.00 | |||||||||||||||||||||||||||||||||||||||||||||
| 56.00 | O | O | X | O | X | • | 56.00 | |||||||||||||||||||||||||||||||||||||||||||||||
| 55.00 | O | X | X | X | O | X | • | 55.00 | ||||||||||||||||||||||||||||||||||||||||||||||
| 54.00 | O | X | O | X | O | X | O | X | • | 54.00 | ||||||||||||||||||||||||||||||||||||||||||||
| 53.00 | O | X | O | X | O | X | O | X | • | 53.00 | ||||||||||||||||||||||||||||||||||||||||||||
| 52.00 | O | X | O | X | O | X | O | • | 52.00 | |||||||||||||||||||||||||||||||||||||||||||||
| 51.00 | O | O | X | O | X | • | 51.00 | |||||||||||||||||||||||||||||||||||||||||||||||
| 50.00 | O | X | O | X | • | 50.00 | ||||||||||||||||||||||||||||||||||||||||||||||||
| 49.00 | O | X | O | X | 7 | • | 49.00 | |||||||||||||||||||||||||||||||||||||||||||||||
| 48.00 | O | X | O | X | O | X | • | 48.00 | ||||||||||||||||||||||||||||||||||||||||||||||
| 47.00 | O | X | O | X | O | X | • | 47.00 | ||||||||||||||||||||||||||||||||||||||||||||||
| 46.00 | O | O | X | O | X | • | 46.00 | |||||||||||||||||||||||||||||||||||||||||||||||
| 45.00 | O | X | O | X | • | 45.00 | ||||||||||||||||||||||||||||||||||||||||||||||||
| 44.00 | O | X | O | • | 44.00 | |||||||||||||||||||||||||||||||||||||||||||||||||
| 43.00 | O | X | • | 43.00 | ||||||||||||||||||||||||||||||||||||||||||||||||||
| 42.00 | O | X | • | 42.00 | ||||||||||||||||||||||||||||||||||||||||||||||||||
| 41.00 | • | O | X | • | 41.00 | |||||||||||||||||||||||||||||||||||||||||||||||||
| 40.00 | • | O | X | • | 40.00 | |||||||||||||||||||||||||||||||||||||||||||||||||
| 39.00 | • | O | X | • | 39.00 | |||||||||||||||||||||||||||||||||||||||||||||||||
| 38.00 | • | O | • | 38.00 |

| ALGN Align Technology, Inc. ($511.72) - Healthcare - ALGN shares moved higher today to break a double top at $512 to mark its fifth consecutive buy signal and reach a new all-time high. This 5 for 5'er has been in a positive trend since June and on an RS buy signal since June. Recent price action has place ALGN into heavily overbought territory with a weekly overbought/oversold reading of 80%, so those wishing to initiate a long position may be best served to wait for a pullback or price normalization. From here, support is offered at $440. |
| ALGT Allegiant Travel Company ($180.72) - Aerospace Airline - ALGT broke a double top at $180, marking a new 52 week high as well as the stock’s second consecutive buy signal. ALGT is a strong 4 for 5’er within the favored aerospace airline sector that is trading in a positive trend. From here, support sits at $170. Note ALGT is heavily overbought at current levels. |
| ALRM Alarmcom Holdings ($77.38) - Business Products - ALRM moved higher Thursday to break a double top at $77. This 5 for 5'er moved to a positive trend last month and ranks in the top third of the business products sector RS matrix. The stock has also been on an RS buy signal against the market since early-2016. The weight of the evidence is decidedly positive here, however, the stock is now overbought so those looking to add exposure may look towards a pullback or normalization of the trading band. Initial support can be found at $72 with further support offered at $68. |
| AN Autonation Inc. ($66.40) - Autos and Parts - AN is a 5 for 5’er within the autos and parts sector that completed a bullish catapult pattern at $66 before moving higher to $67. Furthermore, AN just experienced a flip to positive weekly momentum, suggesting the potential for higher prices. From here, support sits at $61 while AN faces resistance at $69. |
| CPRI Capri Holdings Ltd ($39.34) - Retailing - CPRI broke a double top at $39 on Thursday, marking the fourth consecutive buy signal on the chart. CPRI is a 5 for 5’er within the favored retailing sector that is trading in a positive trend. Note CPRI is extremely overbought at current levels. From here, support sits at $35. |
| CRWD CrowdStrike Holdings, Inc. Class A ($161.93) - Software - Shares of CRWD reversed up Thursday following their earnings release to break a double top at $156 before advancing over 14% intraday to a new all-time high at $164. This 4 for 5'er moved to a positive trend in March and has been on an RS buy signal against the market since February. The overall weight of the evidence is positive here. Initial support can be found at $140, with further support coming at $130 and $120. |
| ESTC Elastic NV ($134.88) - Software - Shares of ESTC reversed up Thursday after their earnings release, breaking a double top at $126 before gaining over 12% intraday to mark a new all-time high at $142. This movement also caused ESTC to reverse back up into a column of Xs on its RS chart against the market, improving the stock to a 3 for 5'er from an attribute perspective. Weekly momentum just flipped positive as well, suggesting the potential for further upside from here. However, those looking to add exposure may be best served to wait for a pullback or normalization of the trading band as the stock is now in overbought territory. Initial support is offered at $116. |
| GES Guess Inc. ($18.88) - Textiles/Apparel - GES is a perfect 5 for 5’er within the favored retailing sector that broke a double top at $19 today. This is the stock’s third consecutive buy signal. GES has experienced three weeks of positive weekly momentum, suggesting the potential for higher prices. From here, support sits at $16. |
| JWN Nordstrom, Inc. ($29.78) - Retailing - JWN broke a double top at $30 on Thursday, making the stock’s third consecutive buy signal. JWN is a 4 for 5’er that ranks 3rd out of 88 names in the favored retailing sector. Last month, JWN returned to a positive trend and experienced a flip to positive monthly momentum. From here, support sits at $26. |
| RCL Royal Caribbean Cruises Ltd. ($84.53) - Leisure - RCL broke a double top at $83 before moving higher to $85 on Thursday. This recent breakout marks the stock’s third consecutive buy signal, confirming that demand is in control. RCL is a 4 for 5’er within the leisure sector that has support available at $76. |
| TWST Twist Bioscience Corp. ($122.34) - Biomedics/Genetics - TWST shares moved higher today to break a triple top at $122 to return to a buy signal and reach a new all-time high. This 5 for 5'er has been in a positive trend since November and on an RS buy signal versus the market since February. TWST is actionable at current levels with a weekly overbought/oversold reading of 53%. From here, support can be found at $110. |
| YETI YETI Holdings, Inc. ($64.61) - Leisure - YETI broke a double top at $65 and is now trading at new all-time highs. This breakout marks the third consecutive on the chart, confirming that demand is in control. YETI is a perfect 5 for 5’er within the favored leisure sector that has maintained a Peer RS buy signal since July 2019. From here, support sits at $61. |
| Name | Option Symbol | Action | Stop Loss |
|---|---|---|---|
| Etsy Inc - $154.74 | ETSY2119C150 | Buy the March 150.00 calls at 21.90 | 148.00 |
| Name | Option | Action |
|---|---|---|
| CSX Corporation ( CSX) | Jan. 77.50 Calls | Stopped at 13.45 (CP: 13.20) |
| Freeport-McMoRan Inc. ( FCX) | Jan. 16.00 Calls | Raise the option stop loss to 6.35 (CP: 8.35) |
| Viacom CBS Inc. ( VIAC) | Jan. 26.00 Calls | Raise the option stop loss to 8.35 (CP: 10.35) |
| NIKE, Inc. ( NKE) | Mar. 125.00 Calls | Raise the option stop loss to 13.85 (CP: 15.85) |
| IntercontinentalExchange Inc. ( ICE) | Mar. 100.00 Calls | Raise the option stop loss to 7.80 (CP: 9.80) |
| Royal Caribbean Cruises Ltd. ( RCL) | Mar. 75.00 Calls | Initiate an option stop loss of 14.75 (CP: 16.75) |
| Name | Option Symbol | Action | Stop Loss |
|---|---|---|---|
| International Business Machines Corp. - $123.61 | IBM2119O125 | Buy the March 125.00 puts at 8.45 | 136.00 |
| Name | Option | Action |
|---|---|---|
| Electronic Arts Inc. (EA) | Jan. 125.00 Puts | Stopped at 130.00 (CP: 129.36) |
| HSBC Holding PLC (United Kingdom) ADR (HSBC) | Mar. 26.00 Puts | Stopped at 28.00 (CP: 28.32) |
| Electronic Arts Inc. (EA) | Mar. 130.00 Puts | Stopped at 130.00 (CP: 129.36) |
| Name | Option Sym. | Call to Sell | Call Price | Investment for 500 Shares | Annual Called Rtn. | Annual Static Rtn. | Downside Protection |
|---|---|---|---|---|---|---|---|
| The TJX Companies, Inc. $65.00 | TJX2116D67.5 | Apr. 67.50 | 4.40 | $31,106.55 | 20.26% | 16.19% | 5.61% |
| Name | Action |
|---|---|
| The Chemours Company (CC) - 25.50 | Sell the April 24.00 Calls. |
| OneMain Holdings Inc. (OMF) - 40.36 | Sell the February 40.00 Calls. |
| Marathon Petroleum Corp. (MPC) - 40.58 | Sell the April 45.00 Calls. |
| JD.COM INC (JD) - 84.38 | Sell the March 90.00 Calls. |
| LM Ericsson Telephone Company (Sweden) ADR (ERIC) - 12.25 | Sell the April 13.00 Calls. |
| Welltower Inc. (WELL) - 62.48 | Sell the March 65.00 Calls. |
| Phillips-Van Heusen Corporation (PVH) - 83.29 | Sell the March 90.00 Calls. |
| Chevron Corporation (CVX) - 89.87 | Sell the March 92.50 Calls. |
| Name | Covered Write |
|---|---|
| QUALCOMM Incorporated ( QCOM - 149.98 ) | March 150.00 covered write. |
Daily Equity & Market Analysis
Loading, Please Wait...
