Most Requested Symbols

The US Dollar's decline has slowed over the last few months and saw a bid following the flare up in geopolitical tensions.
Last weekend's strike on Iran beg the question: what's next for assets around the globe? Today we break down how different securities have performed after major US strikes over time.
NDW Morning Update Video - March 5, 2026
NDW Morning Update Video – March 5, 2026.
Click here to download MP3
The US Dollar has been a focal point of talking heads and analysts alike, for plenty of different reasons. It’s clear that the weakening USD has been a tailwind for international equities over the last year. While we’ll spare the chicken or egg discussion around whether international equities are doing well because of a declining USD or whether the USD is declining because international equities became more attractive, the US Dollar Index (DX/Y) is important to watch for any developments to get a clearer picture of the weight of the evidence.
DX/Y reversed up in early February after reaching a multi-year low in January and has continued to add Xs in this column after the start of the conflict in Iran. DX/Y is now facing a key resistance area built by old support along with new resistance. A break above 100 would mark the index’s highest level since June of last year with a move to 102 reclaiming old support that has turned into resistance. While there has been plenty of fuss about the US Dollar losing its reserve currency status, it has consolidated in its current range for nine months and reacted as a reserve currency would be expected to act following a major geopolitical event. At the same time, there is not much evidence that the USD will look to move much higher to change its current downward trend as it still trades on five consecutive sell signals. This still paints a positive backdrop for international assets until the downward pressure on the US Dollar eases but the gale like tailwinds experienced last year have calmed down to a nice breeze.


If your office is anything like the Dorsey Wright office in Richmond, your clients have been calling in and asking for more context around recent movement. Markets seem to be moving back and forth at will, seeing massive intra-day up and downswings as more news comes out about the recent strikes in Iran. With that in mind, we thought it may be useful to look back at other historical instances of US escalation in historical military campaigns in an effort to contextualize what may be in store over the next year if conflict continues. Before going further, it’s worth mentioning that “war” looks different today than it has in the past- as has the speed at which information moves around the globe. Furthermore, finding concrete start and end dates to US involvement in conflict in a post 9/11 world can be quite difficult- a point to keep in mind when observing today’s tests. Regardless, today’s feature will look back at major campaigns from the last century in an effort to answer the question: Is increased US military presence around the globe a “bad” thing from a market perspective?
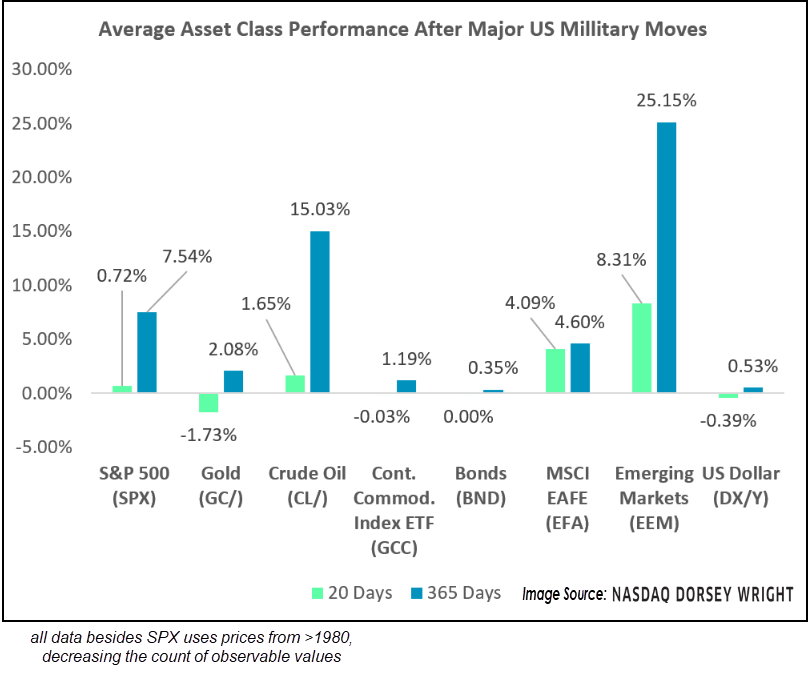
Before diving into specific asset classes, we will first break down returns for the broad market. There have been 12 “major” US related military strikes/large scale US involvement starting with Pearl Harbor on December 7th, 1941. This attack started direct US involvement in World War II, sending markets reeling over the following 5 day period. The surprise attack kicked off the worst 5-day stretch following heightened starts to conflict in our dataset, seeing SPX decline more than 6%. Things didn’t really improve over the next year, seeing SPX end roughly flat 365 days later. It is worth noting that Pearl Harbor is the only observed datapoint that saw SPX in the red over every observed timeframe (5 day, 20 day, 30 day, 90 day, 180 day & 1 year.) Besides that, markets have been quite resilient around wartime. In fact, SPX has landed in positive territory 1 year after the start of US involvement seven of eleven times (~64%) signaling that most often, markets are able to effectively shake off heighted global conflict. On average, forward one year returns are just that…. average…. clocking in around 7.54%. This average value includes a comparatively massive 26% decline around US involvement in Afghanistan in 2001, a decline most of us would associate with the burst of the dotcom bubble rather than US military conflict. Regardless- the main takeaway from this dataset is clear: Global conflict (on average) isn’t “bad” for financial markets, at least domestically.

What about volatility? Our next chart below breaks down how the market’s “fear gauge” reacts around conflict. Note- data from here on out uses a condensed data set starting for most asset classes in the 1980’s. With that said, our pool for observation is even more condensed, a point to keep in mind when making assumptions on our data. Regardless, the table below breaks down how the VIX moved over two defined periods: before and after US strikes. Interestingly enough, you’ll note that more often than not, volatility actually begins creeping higher notably before the strike before dissipating after. There are certainly several arguments for why this could be, but the most convincing is that markets are “pricing in” strikes ahead of time and then cooling off after things go “as planned.” Message from this table: If historical averages play out, markets should see the fear gauge contract over the next month or so.
Finally, we will journey into different asset classes to test how different securities normally perform (keep in mind the contracted dataset mentioned previously when computing our averages.) The table below includes 20-day and 365-day average performance metrics for various different asset classes. Most assets are roughly what you might expect, with a few notable outliers. Emerging markets have seen stout improvement following US focused conflict, a major difference to what we have seen since this weekend’s strikes on Iran. Crude is another major gainer, which makes sense considering many major conflicts are centered around high production areas.

Remember, our job is to help provide context around world events, not unnecessarily feed into the fear that is often present around these global events. While it goes without saying that each event is different and brings its own set of challenges to global markets, most assets have shown impressive resiliency around unrest. Remember, markets are forward looking and declines are generally driven by uncertainty more than any other factor. While no one roots for heightened conflict, once it begins uncertainty tends to fall… and markets keep moving.
Each week the analysts at NDW review and comment on all major asset classes in the global markets. Shown below is the summary or snapshot of the primary technical indicators we follow for multiple areas. Should there be changes mid-week we will certainly bring these to your attention via the report.
| Universe | BP Col & Level (actual) | BP Rev Level | PT Col & Level (actual) | PT Rev Level | HiLo Col & Level (actual) | HiLo Rev Level | 10 Week Col & Level (actual) | 10 Week Rev Level | 30 Week Col & Level (actual) | 30 Week Rev Level |
|---|---|---|---|---|---|---|---|---|---|---|
| ALL |
|
48% |
|
38% |
|
64% |
|
50% |
|
54% |
| NYSE |
|
60% |
|
54% |
|
80% |
|
60% |
|
68% |
| OTC |
|
36% |
|
34% |
|
56% |
|
46% |
|
50% |
| World |
|
52% |
|
44% |
|
|
|
52% |
|
58% |

Remember, these are technical comments only. Just as you must be aware of fundamental data for the stocks we recommend based on technical criteria in the report, so too must you be aware of important data regarding delivery, market moving government releases, and other factors that may influence commodity pricing. We try to limit our technical comments to the most actively traded contracts in advance of delivery, but some contracts trade actively right up to delivery while others taper off well in advance. Be sure you check your dates before trading these contracts. For questions regarding this section or additional coverage of commodities email james.west@nasdaq.com.
Data represented in the table below is through 03/03/2026:
| Symbol | Name | Price | PnF Trend | RS Signal | RS Col. | 200 Day MA | Weekly Mom |
|---|---|---|---|---|---|---|---|
| CL/ | Crude Oil Continuous | 74.56 | Positive | Sell | O | 62.66 | + 10W |
| DBLCIX | Deutsche Bank Liquid Commodities Index | 468.52 | Positive | Sell | O | 460.74 | - 34W |
| DWACOMMOD | NDW Continuous Commodity Index | 1108.39 | Positive | Buy | O | 1025.56 | - 4W |
| GC/ | Gold Continuous | 5107.40 | Positive | Buy | X | 3953.27 | - 2W |
| HG/ | Copper Continuous | 5.77 | Positive | Buy | X | 5.15 | - 6W |
| ZG/ | Corn (Electronic Day Session) Continuous | 434.25 | Positive | Sell | O | 423.16 | + 2W |
Average Level
13.10
| < - -100 | -100 - -80 | -80 - -60 | -60 - -40 | -40 - -20 | -20 - 0 | 0 - 20 | 20 - 40 | 40 - 60 | 60 - 80 | 80 - 100 | 100 - > |
|---|---|---|---|---|---|---|---|---|---|---|---|
|
Buy signalagg
|
|||||||||||
|
Buy signalIJH
|
|||||||||||
|
Buy signalVOOV
|
|||||||||||
|
Buy signalQQQ
|
Buy signalgcc
|
||||||||||
|
Buy signalXLG
|
Buy signalshy
|
Buy signalefa
|
Buy signalrsp
|
Buy signalGLD
|
|||||||
|
Sell signalVOOG
|
Buy signaldia
|
Buy signalEEM
|
Sell signallqd
|
Buy signalief
|
Sell signaldx/y
|
Buy signalgsg
|
|||||
|
Buy signalhyg
|
Buy signalfxe
|
Sell signalONEQ
|
Buy signalSPY
|
Buy signaliwm
|
Buy signalijr
|
Buy signaltlt
|
Buy signaldvy
|
Buy signalicf
|
Buy signaluso
|
||
| < - -100 | -100 - -80 | -80 - -60 | -60 - -40 | -40 - -20 | -20 - 0 | 0 - 20 | 20 - 40 | 40 - 60 | 60 - 80 | 80 - 100 | 100 - > |
| AGG | iShares US Core Bond ETF |
| USO | United States Oil Fund |
| DIA | SPDR Dow Jones Industrial Average ETF |
| DVY | iShares Dow Jones Select Dividend Index ETF |
| DX/Y | NYCE U.S.Dollar Index Spot |
| EFA | iShares MSCI EAFE ETF |
| FXE | Invesco CurrencyShares Euro Trust |
| GLD | SPDR Gold Trust |
| GSG | iShares S&P GSCI Commodity-Indexed Trust |
| HYG | iShares iBoxx $ High Yield Corporate Bond ETF |
| ICF | iShares Cohen & Steers Realty ETF |
| IEF | iShares Barclays 7-10 Yr. Tres. Bond ETF |
| LQD | iShares iBoxx $ Investment Grade Corp. Bond ETF |
| IJH | iShares S&P 400 MidCap Index Fund |
| ONEQ | Fidelity Nasdaq Composite Index Track |
| QQQ | Invesco QQQ Trust |
| RSP | Invesco S&P 500 Equal Weight ETF |
| IWM | iShares Russell 2000 Index ETF |
| SHY | iShares Barclays 1-3 Year Tres. Bond ETF |
| IJR | iShares S&P 600 SmallCap Index Fund |
| SPY | SPDR S&P 500 Index ETF Trust |
| TLT | iShares Barclays 20+ Year Treasury Bond ETF |
| GCC | WisdomTree Continuous Commodity Index Fund |
| VOOG | Vanguard S&P 500 Growth ETF |
| VOOV | Vanguard S&P 500 Value ETF |
| EEM | iShares MSCI Emerging Markets ETF |
| XLG | Invesco S&P 500 Top 50 ETF |

| Symbol | Company | Sector | Current Price | Action Price | Target | Stop | Notes |
|---|---|---|---|---|---|---|---|
| ABBV | AbbVie Inc. | Drugs | $233.86 | 210s - low 230s | 284 | 188 | 5 for 5'er, favored DRUG sector, LT pos peer & mkt RS, breakout from consec sell signals, 2.9% yield |
| AB | AllianceBernstein Holding LP | Wall Street | $39.12 | low 40s | 64 | 32 | 3 TA rating, LT mkt RS buy, LT pos trend, top 50% of WALL sector matrix, consec buy signals, buy-on-pullback, yield > 8% |
| PKG | Packaging Corp of America | Forest Prods/Paper | $231.42 | hi 200s - mid 230s | 358 | 184 | 4 TA rating, top 20% of FORE sector RS matrix, LT RS buy, buy-on-pullback |
| ZWS | Zurn Elkay Water Solutions Corp. | Machinery and Tools | $50.28 | hi 40s - lo 50s | 95 | 42 | 5 TA rating, LT pos trend, LT mkt RS buy, consec buy signals, buy-on-pullback |
| CACI | CACI International Inc. | Computers | $629.75 | 570s - 600s | 672 | 528 | 5 for 5'er, top 25% of COMP sector matrix, LT pos mkt RS, triple top breakout |
| CAKE | The Cheesecake Factory Incorporated | Restaurants | $63.52 | low-to-mid 60s | 96 | 52 | 5 for 5'er, top 20% of REST sector matrix, LT pos mkt RS, multiple buy signals, R-R>2.5, 1.8% yield |
| WBS | Webster Financial Corporation | Banks | $68.77 | hi 60s - low 70s | 91 | 58 | 4 for 5'er, top 25% of BANK sector matrix, one box from peer RS buy, buy on pullback, 2.2% yield |
| Symbol | Company | Sector | Current Price | Action Price | Target | Stop | Notes |
|---|---|---|---|---|---|---|---|
| CPRT | Copart Incorporated | Autos and Parts | $38.48 | hi 30s | 28 | 42 | 1 TA rating, bottom 50% of AUTO sector matrix, NT and mkt RS sell last month, consec sell signals |
| Comment | |||||||
|---|---|---|---|---|---|---|---|
|
|
|||||||
WBS Webster Financial Corporation R ($70.16) - Banks - WBS is a 4 for 5'er that ranks in the top quartile of the favored banks sector matrix and sits one box away from giving a peer RS buy signal, which would promote it to a 5 for 5'er. On its default chart, WBS has completed three consecutive buy signals and reached an all-time high last month. The stock has subsequently pulled back to near the middle of its trading band, offering an entry point for long exposure. Positions may be added in the upper $60s to low $70s and we will set our initial stop at $58, which would violate WBS's bullish support line. We will use the bullish price objective, $91, as our target price, WBS also carries a 2.2% yield.
| 26 | |||||||||||||||||||||||||||||
| 74.00 | X | 74.00 | |||||||||||||||||||||||||||
| 73.00 | X | O | 73.00 | ||||||||||||||||||||||||||
| 72.00 | X | O | 72.00 | ||||||||||||||||||||||||||
| 71.00 | X | 3 | 71.00 | ||||||||||||||||||||||||||
| 70.00 | X | O | 70.00 | ||||||||||||||||||||||||||
| 69.00 | X | O | 69.00 | ||||||||||||||||||||||||||
| 68.00 | X | 68.00 | |||||||||||||||||||||||||||
| 67.00 | X | 2 | Mid | 67.00 | |||||||||||||||||||||||||
| 66.00 | 1 | X | O | X | 66.00 | ||||||||||||||||||||||||
| 65.00 | X | O | X | O | X | 65.00 | |||||||||||||||||||||||
| 64.00 | • | X | O | X | O | 64.00 | |||||||||||||||||||||||
| 63.00 | X | • | • | • | X | O | 63.00 | ||||||||||||||||||||||
| 62.00 | X | X | O | X | • | A | • | X | 62.00 | ||||||||||||||||||||
| 61.00 | X | O | X | O | X | O | X | O | • | C | 61.00 | ||||||||||||||||||
| 60.00 | X | O | X | 9 | X | O | X | O | • | X | 60.00 | ||||||||||||||||||
| 59.00 | X | O | X | O | O | O | X | • | X | • | Bot | 59.00 | |||||||||||||||||
| 58.00 | • | X | O | X | O | X | O | B | • | X | • | 58.00 | |||||||||||||||||
| 57.00 | • | X | 8 | X | O | X | O | X | O | X | • | 57.00 | |||||||||||||||||
| 56.00 | • | 7 | O | O | • | O | X | O | X | • | 56.00 | ||||||||||||||||||
| 55.00 | • | X | X | • | O | X | O | X | • | 55.00 | |||||||||||||||||||
| 54.00 | • | X | O | X | • | O | X | O | • | 54.00 | |||||||||||||||||||
| 53.00 | X | • | 6 | O | X | • | O | • | • | 53.00 | |||||||||||||||||||
| 52.00 | X | O | X | O | X | • | • | 52.00 | |||||||||||||||||||||
| 51.00 | X | O | X | O | • | 51.00 | |||||||||||||||||||||||
| 50.00 | X | O | • | 50.00 | |||||||||||||||||||||||||
| 49.00 | X | 5 | • | 49.00 | |||||||||||||||||||||||||
| 48.00 | X | O | X | • | 48.00 | ||||||||||||||||||||||||
| 47.00 | X | O | X | • | 47.00 | ||||||||||||||||||||||||
| 46.00 | X | X | O | • | 46.00 | ||||||||||||||||||||||||
| 45.00 | X | O | X | • | 45.00 | ||||||||||||||||||||||||
| 44.00 | X | O | X | • | 44.00 | ||||||||||||||||||||||||
| 43.00 | X | O | X | • | 43.00 | ||||||||||||||||||||||||
| 42.00 | X | O | • | 42.00 | |||||||||||||||||||||||||
| 41.00 | X | • | 41.00 | ||||||||||||||||||||||||||
| 26 |
| AMR Alpha Metallurgical Resources Inc. ($184.23) - Oil - After giving five consecutive sell signals, AMR returned to a buy signal Wednesday when it completed a bearish signal reversal at $184. The outlook for the stock remains unfavorable, however, as AMR is a 0 for 5'er that ranks 48th of 55 names in the oil sector matrix. From here, the first level of support sits at $158. |
| CDNS Cadence Design Systems, Inc. ($305.53) - Software - CDNS advanced Wednesday to break a double top at $308. This also moved the stock back to a positive trend, promoting it to a 4 for 5 TA rating. The technical picture is now favorable. However, the stock is at resistance at the current position. Further confirmation would be seen with appreciation to $312 or higher. Initial support is seen at $288 and $280. |
| CENX Century Aluminum Co ($53.62) - Metals Non Ferrous - CENX returned to a buy signal and reached a new multi-year high Wednesday when it broke a quadruple top at $56. The breakout adds to an already strong technical picture as CENX is a 5 for 5'er that ranks in the top quintile of the non-ferrous metals sector matrix. From here, support sits at $49. |
| COIN Coinbase Global, Inc. Class A ($210.26) - Software - COIN pushed higher Wednesday to break a triple top at $188 before rising over 15% intraday to $212. This 3 for 5 TA stock showed near-term improvement against the market and its peers last week. Weekly momentum also recently flipped positive, suggesting the potential for further upside from here. The weight of the technical evidence is mixed but improving. Initial support is seen at $174 with further support seen at $172. Overhead resistance may be found initially at $252, the current location of the bearish resistance line, and at $260. |
| NEU NewMarket Corporation ($636.61) - Chemicals - After giving five consecutive sell signals, NEU gave an initial buy signal Wednesday when it broke a double top at $640. The outlook for the stock remains unfavorable despite Tuesday's move as NEU is a 2 for 5'er that ranks 40th of 45 names in the chemicals sector matrix. From here, the next level of overhead resistance is NEU's bearish resistance line at $720. Meanwhile, support can be found at $608. |
| PSX Phillips 66 ($164.91) - Oil Service - PSX completed a shakeout pattern Wednesday with a triple top break at $164. Wednesday's move adds to a modestly positive technical picture as PSX is a 3 for 5'er. However, the stock has now pushed into heavily overbought territory with a weekly OBOS reading north of 90%. From here, the first level of support sits at $150. |
| ROST Ross Stores, Inc. ($211.56) - Retailing - ROST reversed into Xs and broke a double top at $208 for a sixth buy signal as shares rallied to new chart highs at $216. The stock has been a 5 for 5'er since November last year and current ranks within the top decile of the Retailing sector matrix. Those seeking to initiate expsoure will look for consolidation around the $200 range along with a normalization of the 10-week trading band before considering. Initial support lies at $196, while additional can be found at $186. |
| SYY Sysco Corporation ($87.62) - Food Beverages/Soap - SYY has improved dramatically in recent months, but the stock finally moved back to a sell signal tpday with a break of a double bottom at $87. However, the 3 for 5'er is still in hold territory given its positive trend and peer relative strength. Additionally, reversal into Xs would initiate the start of a shakeout pattern. From here, initial support comes from the bullish support line at $77, with further support at $76 and $72. |
| Name | Option Symbol | Action | Stop Loss |
|---|---|---|---|
| GE Aerospace - $339.80 | O: 26E340.00D15 | Buy the May 340.00 calls at 22.40 | 308.00 |
| Name | Option | Action |
|---|---|---|
|
|
||
| Name | Option Symbol | Action | Stop Loss |
|---|---|---|---|
| Copart Incorporated - $37.86 | O: 26Q40.00D15 | Buy the May 40.00 puts at 3.30 | 42.00 |
| Name | Option | Action |
|---|---|---|
| General Mills, Inc. ( GIS) | Jun. 47.50 Puts | Raise the option stop loss to 2.70 (CP: 4.70) |
| Shopify Inc ( SHOP) | May. 120.00 Puts | Stopped at 128.00 (CP: 129.89) |
| Name | Option Sym. | Call to Sell | Call Price | Investment for 500 Shares | Annual Called Rtn. | Annual Static Rtn. | Downside Protection |
|---|---|---|---|---|---|---|---|
| Cameco Corporation $ 117.79 | O: 26D120.00D17 | Apr. 120.00 | 10.00 | $ 55,771.20 | 53.96% | 53.96% | 7.23% |
| Name | Action |
|---|---|
| Intel Corporation ( INTC) - 43.10 | Sell the May 49.00 Calls. |
| The Gap, Inc. ( GAP) - 27.25 | Sell the March 29.00 Calls. |
| Freeport-McMoRan Inc. ( FCX) - 65.57 | Sell the June 65.00 Calls. |
| Kinross Gold Corporation ( KGC) - 33.80 | Sell the April 36.00 Calls. |
| Micron Technology, Inc. ( MU) - 379.68 | Sell the June 420.00 Calls. |
| Moderna, Inc. ( MRNA) - 49.83 | Sell the April 55.00 Calls. |
| Bunge Limited ( BG) - 116.62 | Sell the July 120.00 Calls. |
| Name | Covered Write |
|---|---|
|
|
|
Daily Equity & Market Analysis
Loading, Please Wait...
