
As the end of the calendar year approaches, so too do discussions regarding any unrealized gains or losses of substance sitting within taxable accounts. It is probably a safe assumption that your clients prefer to pay less in taxes whenever possible, and there are a few simple strategies that can be applied within the portfolio to help in that endeavor. "Tax Loss Harvesting" is among them, and while it is not exactly an advanced accounting strategy, it is an effective way to both offset gains and rid the portfolio of laggard positions before the calendar flips to 2021.
As the end of the calendar year approaches, so too do discussions regarding any unrealized gains or losses of substance sitting within taxable accounts. It is probably a safe assumption that your clients prefer to pay less in taxes whenever possible, and there are a few simple strategies that can be applied within the portfolio to help in that endeavor. "Tax Loss Harvesting" is among them, and while it is not exactly an advanced accounting strategy, it is an effective way to both offset gains and rid the portfolio of laggard positions before the calendar flips to 2021.
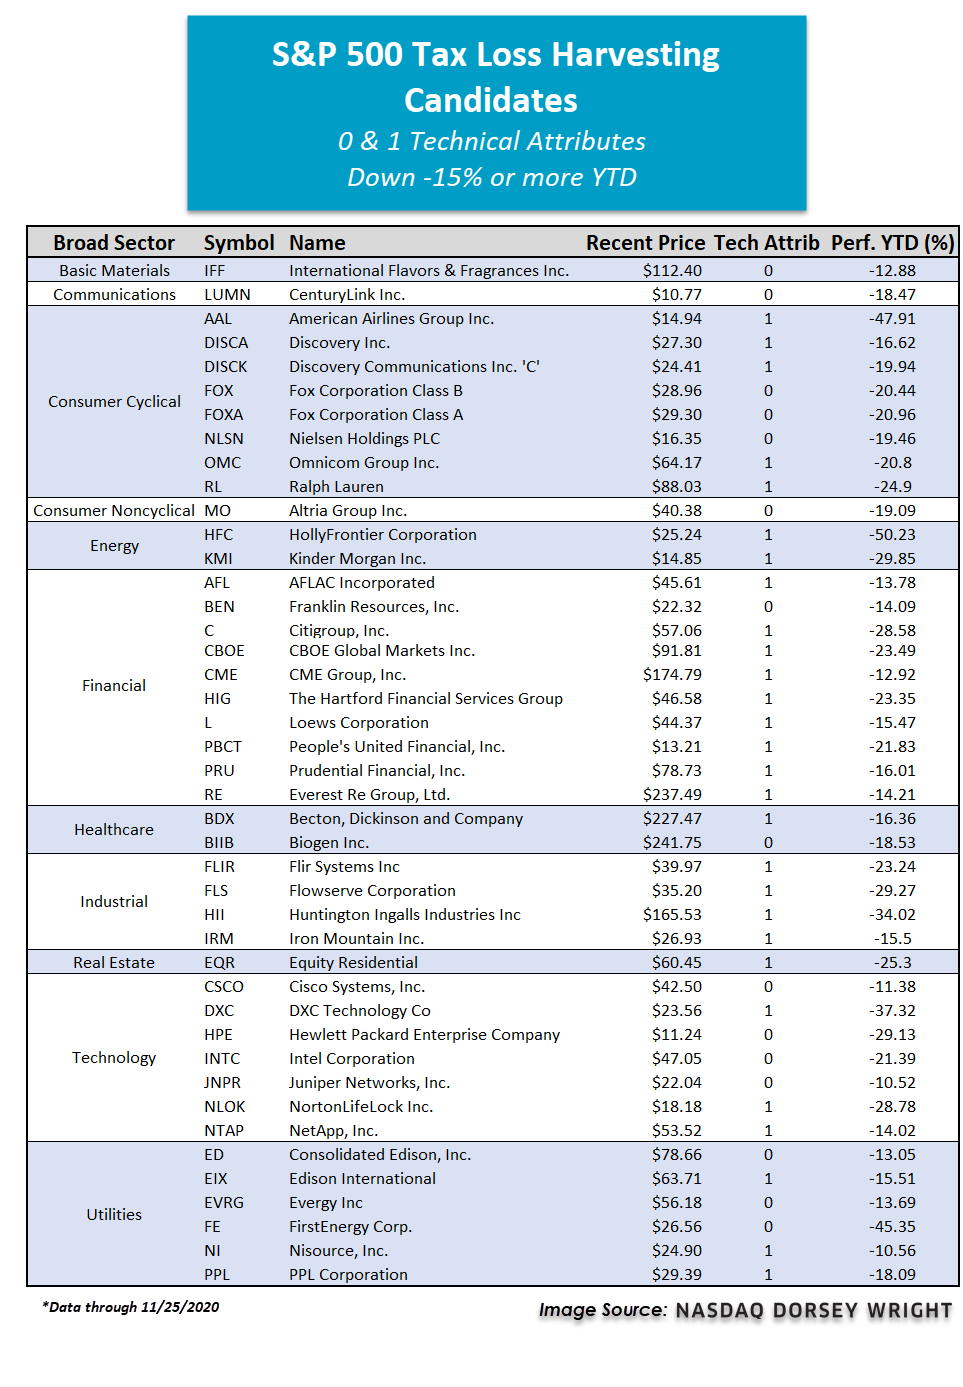
In some years, finding losses to harvest is easier than others. Given the elevated market volatility throughout much of the year, there is no shortage of stocks that are in negative territory on a year-to-date basis. We want to highlight stocks that are widely owned, so we’ve used the S&P 500 as a starting point. Because we only want to sell stocks that are technically weak, we filtered our screen to only include stocks that have a 0 or 1 technical attribute rating. From that group, we identified 43 individual names that are down -15% or more on a year-to-date basis (through 11/25).
Losses from these positions may be used to offset some of the gains already taken in the calendar year or can be "carried forward" in many cases. The harvesting of losses is a straight-forward approach, which can be combined with the practical portfolio review measure of weeding out technically weak holdings. Below the table, we've highlighted a few individual names that are ripe for potential loss harvesting.
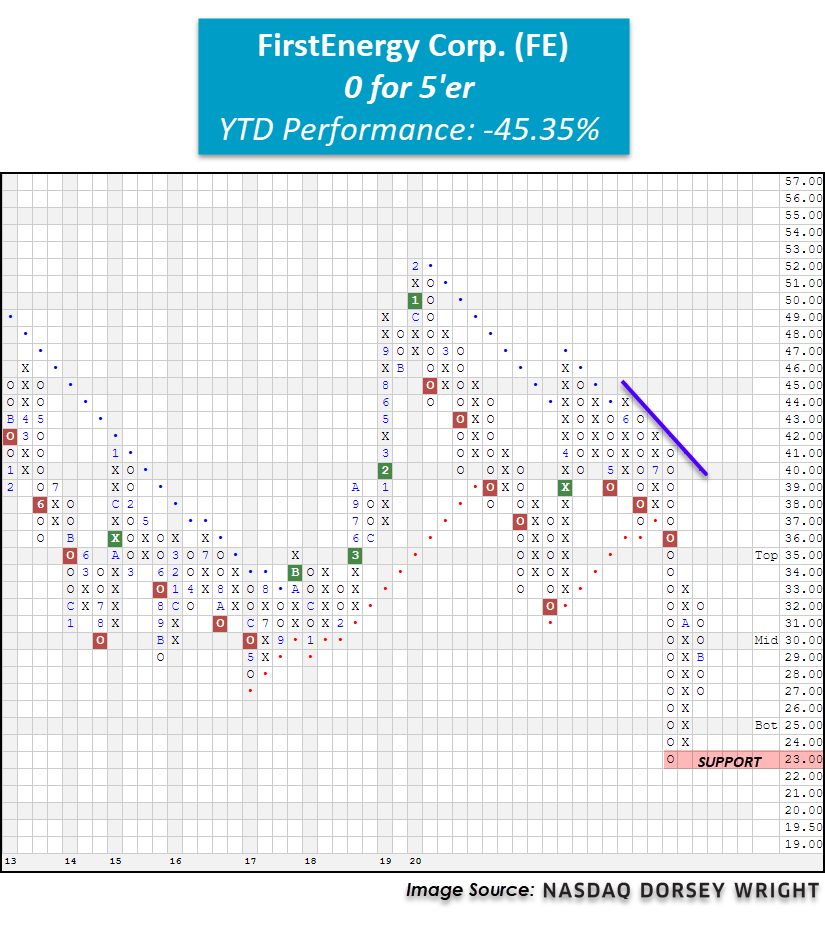
FE FirstEnergy Corp. ($26.62) - Utilities/Electricity
FirstEnergy Corp FE is one of the S&P 500 names we consider to be a strong candidate for potential tax-loss harvesting. FE started the year strong when it printed a multi-year high in February at $52 before moving to a sell signal at $45. FE gave a total of five consecutive sell signals throughout the next month before returning to a buy signal in March. This rally was short-lived, however, as in May, FE returned to a sell signal and has since given a total of three consecutive sell signals, confirming that supply is in control. Furthermore, FE moved into a negative trend in July when it fell to print a multi-year low at $23 before bouncing to $33 in October. With action this month, FE has returned to a column of Os at $27. With 0 positive attributes in its favor, selling FE can both improve the overall technical health of your portfolio and potentially help offset gains from other positions. Year-to-date, FE is down a whopping -45.35% while the S&P 500 Index SPX is up 12.35%.
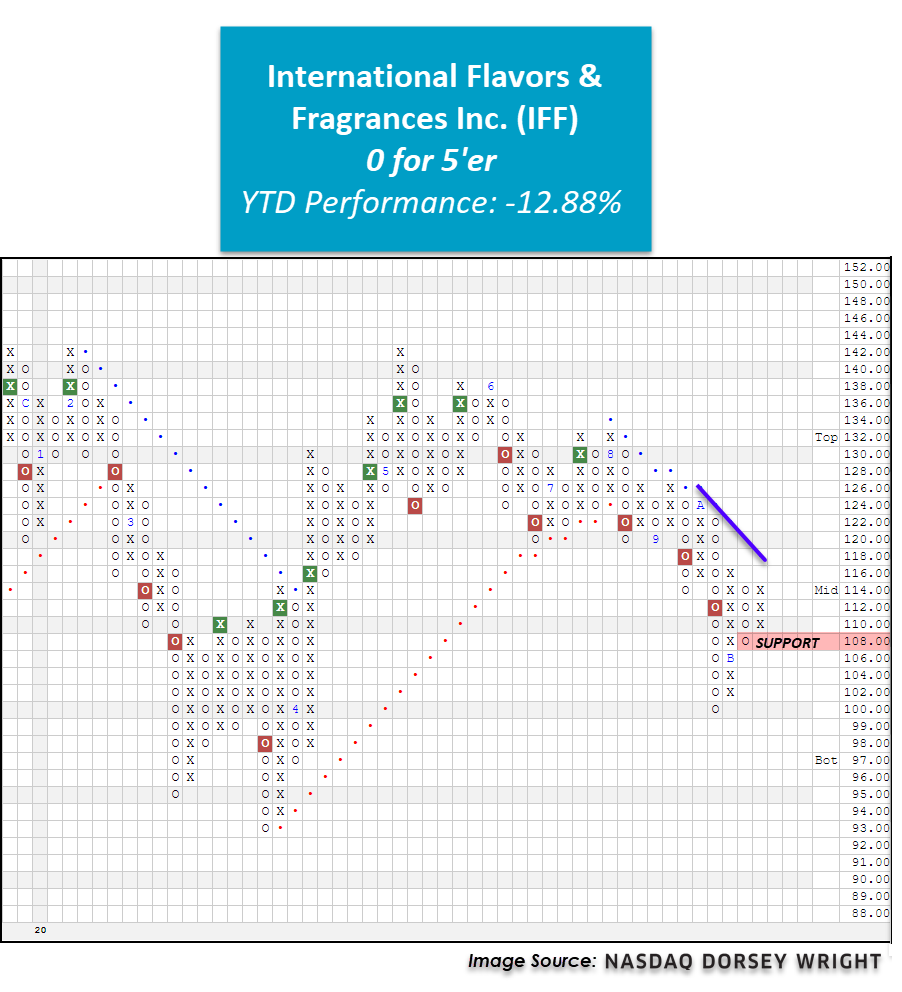
IFF International Flavors & Fragrances Inc. ($112.72) - Chemicals
IFF sold off in February and March along with the broader market before showing signs of life in late March through June. After some back and forth action in July and August, IFF moved to a sell signal at $122 and has since given a total of three consecutive sell signals. Currently, IFF is an unacceptable 0 for 5’er that ranks dead last in the chemicals sector stock matrix. Additionally, monthly momentum has been negative for two months, suggesting the potential for lower prices. Year-to-date, IFF is down -12.88%, making this stock an ideal candidate for potential tax-loss harvesting.
KMI Kinder Morgan Inc. ($14.76) - Oil Service
KMI is a weak 1 for 5’er that ranks 14th out of 16 names in the oil service sector RS matrix. KMI has maintained a long-term market RS sell signal since October 2013 and is currently trading in an overall negative trend. After moving as high as $22 in February, shares of KMI began to fall, and the stock returned to a sell signal at $18 in March before moving as low as $9.50, which marked a new all-time low on the chart. In April, KMI returned to a buy signal and showed follow through with a second consecutive buy signal; however, in September, the stock returned to a sell signal and moved back into a negative trend. With recent market action, KMI has reversed back up into Xs at $15; however, it remains well below the bearish resistance line. KMI’s year-to-date (through 11/25) return of -29.85% makes this stock a prime tax-loss candidate. Even when factoring in KMI’s yield of about 7%, the stock is down double digits with a loss of -24.80% on a total return basis this year, underperforming the S&P 500 Index Total Return TR.SPXX by over -39%.

