
Most Requested Symbols

We are excited to announce a new addition to our lineup of guided of models, the NDW Tactical + Ladders Fixed Income Model (LADDERS).
The average distribution reading is 13.19% overbought.
Today's featured stock is Zillow Group Inc. Class C (Z)
CRI, EAT, EXPE, TRUP, HEI, & SWK
Call: T-Mobile (TMUS), Put: Equity Residential (EQR), Covered Write: Lowe's Companies (LOW)
Wells Fargo Advisors: You can find a CAR approved version of last Thursday’s quarterly newsletter under the "Other" section of the "Media & Education" page. The CAR ref number is CAR-1020-01326.
Beginners Series Webinar: Join us on Friday, October 16th, at 2 PM (ET) for our NDW Beginners Series Webinar. This week's topic is Navigating the Dynamic Asset Level Investing (DALI) & Asset Class Group Scores (ACGS) pages. Register here.
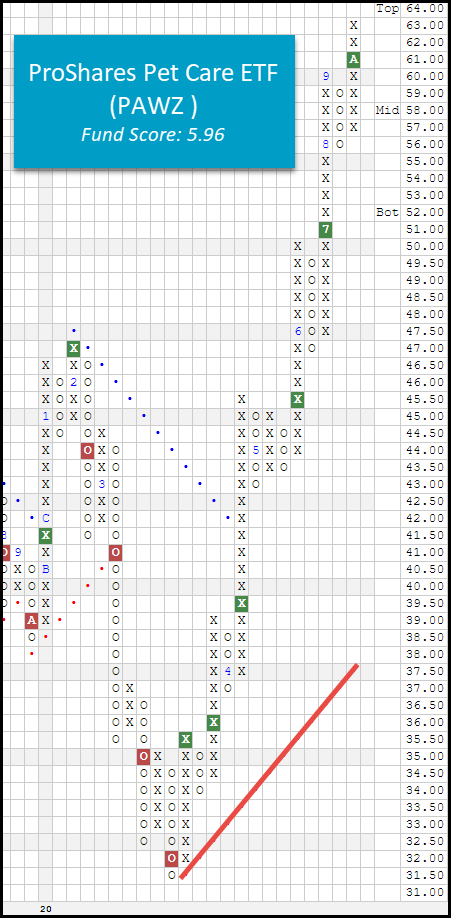
The pandemic continues to unexpectedly shift supply and demand curves, the latest observation coming from the pet care industry. With individuals being encouraged to spend greater amounts of time at home, pet ownership has climbed, along with demand for related services offered by animal-health companies (Source: wsj.com). Take for example a name like Freshpet FRPT, an American business that manufactures refrigerated food and treats for animals, their stock is up over 100% this year (through 10/14). Another example is a company called IDEXX Laboratories IDXX that develops, manufactures, and distributes products to the animal veterinary markets, their stock is up over 60% this year. Both of these names returned to strong attribute territory (technical attribute of 3+) in the middle of March and have not looked back.
FRPT and IDXX are the two largest holdings in the ProShares Pet Care ETF PAWZ, a strategy that stands to benefit from people’s passions for their pets (Source: proshares.com). PAWZ hit a fresh all-time high today (10/15) and carries a stellar 5.96 fund score atop a positive score direction of 0.97, adding technical merit to its thematic strength. Despite the favorable picture, PAWZ is pushing into extended territory so those looking to initiate new long exposure may consider dollar-cost averaging in or entering on a contraction. Initial support is offered at $56.

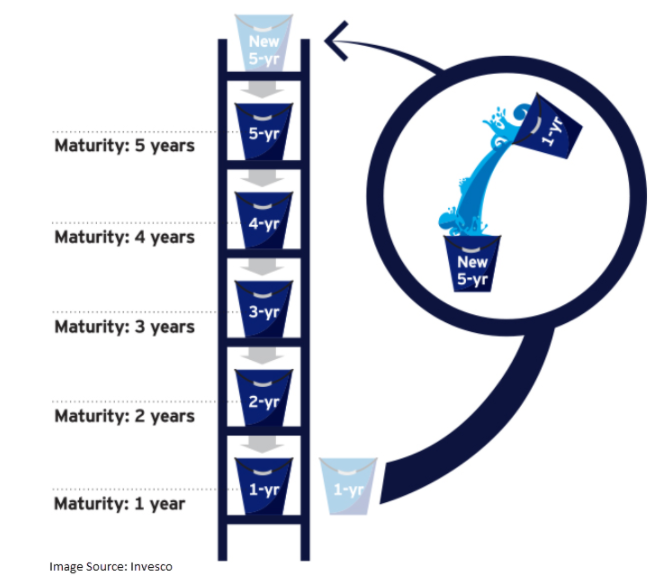
We are excited to announce a new addition to our lineup of guided models, the NDW Tactical + Ladders Fixed Income Model LADDERS. The LADDERS model combines the State Street Fixed Income Model SSFIXED.TR with two “ladders” composed of BulletShares target maturity ETFs, one investment-grade CORPLADDER, the other high yield HYLADDER. The model weighting is 30% SSFIXED.TR, 30% HYLADDER, 40% CORPLADDER.
The ladders’ role in the portfolio is to provide stability and a steady stream of income. The target maturity funds that make up the ladders hold individual bonds that each mature or are expected to be called in the same year. Each ladder has five equally weighted “rungs,” i.e. holds five ETFs with target maturities from one to five years. The ETFs in the ladders are held until maturity at which point the proceeds from the maturing fund are reinvested out to the furthest rung on the ladder. The model is rebalanced once per year when the current year’s BulletShares funds mature. Because one-fifth of each ladder matures every year they produce a series of known cash flows, which can be a useful tool for investors, like retirees, that need to make regular withdrawals from their portfolio. Target maturity funds also protect against capital losses due to rising interest rates. As long as the ETFs are held to maturity, investors receive their share of the par value of the underlying bonds (after fees and expenses and excepting for any defaults). The ladder structure also has the effect of increasing the yield of the portfolio over time. All else being equal, five-year bonds have a higher yield than one-year bonds and after five years, the entire portfolio will be made up of bonds that were purchased when they had five years until maturity. Therefore, assuming rates remain constant, the yield of the “seasoned” portfolio should be higher than it was at inception. The individual funds within each ladder are not rebalanced as the goal is to hold them to maturity thereby mitigating the interest rate risk of the portfolio.
The role of the State Street Fixed Income Model is generating alpha. SSFIXED has an inventory of over 20 ETFs covering virtually every area of the fixed income market from convertible bonds to emerging market bonds to long-term Treasuries. The model utilizes a relative strength matrix to evaluate the inventory, identify areas or strength, and avoid areas of weakness in the market. Because of its highly differentiated inventory and tactical nature SSFIXED’s yield can vary greatly depending on which funds are in the model portfolio at any given and can exhibit higher volatility than more vanilla fixed income portfolios, which can be problematic for some investors. However, by combining SSFIXED with the laddered portfolios we can achieve a relatively consistent yield and dampen the overall portfolio volatility while retaining the opportunity for outperformance via SSFIXED’s tactical rotation.

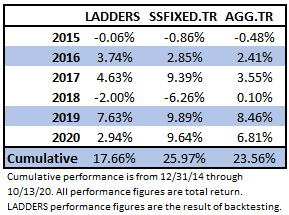
Over the trailing three years (which includes backtested history for the LADDERS model) SSFIXED has had a standard deviation of 6.17%, while LADDERS had a standard deviation of 4.43%. Below is the annual total return performance for the LADDERS model (backtested), SSFIXED, and the iShares US Core Bond ETF AGG.TR. LADDERS has underperformed SSFIXED on a cumulative basis, which is in-line with what we would expect to see. However, in its worst year (2018), LADDERS was down -2.0%, while SSFIXED was down more than 6%. Since 2015, LADDERS has also underperformed AGG. This is at least partially because we have been in a falling interest rate for most of the last five years, which benefits funds with a relatively long duration like AGG. We can also see that year-to-date LADDERS has trailed both SSFIXED and AGG, this is partially due to the model’s high yield component. High yield spreads widened dramatically during the volatility in Q1, and while they have narrowed considerably, they remain elevated relative to 2019 levels. Even though the underlying bonds in the high yield funds are expected to be held to maturity, they are exchange-traded, and therefore the market value and NAV of the funds are still affected by changes in interest rates/credit spreads. However, ultimately, as the bonds near maturity, any price impairment due to wider credit spreads should disappear, the NAV of the funds will move toward the par value of their holdings and, excepting for any defaults, the fund will receive and distribute par value for its bonds.
As mentioned above, the LADDERS model is made up of SSFIXED, CORPLADDER, and HYLADDER, in a 30-40-30 allocation. However, this may not be the optimal weighting scheme for everyone. If you want to combine in them in different weights, leave out a piece, or even use a different tactical fixed income model, you can, using the underlying model symbols.
The DALI Style view of the Asset Class Group Scores (ACGS) page depicts only those major market areas that are meant to represent the broad investible asset classes globally. The S&P 500 Index Funds group has remained in the top position in these rankings over the past several weeks, with its recent score posting of 4.72 placing it in 10th out of all 135+ groups tracked on the ACGS system. US Money Market, the cash representative in this breakdown, still ranks lower than any other of the DALI Style groups at a position of 125 among all groups with an average score of 2.11. Commodities and Global Currency make up the other groups south of the favorable 3.00 score threshold, as the remaining equity and fixed income-related groups are all found in the “green” or “blue” zone.
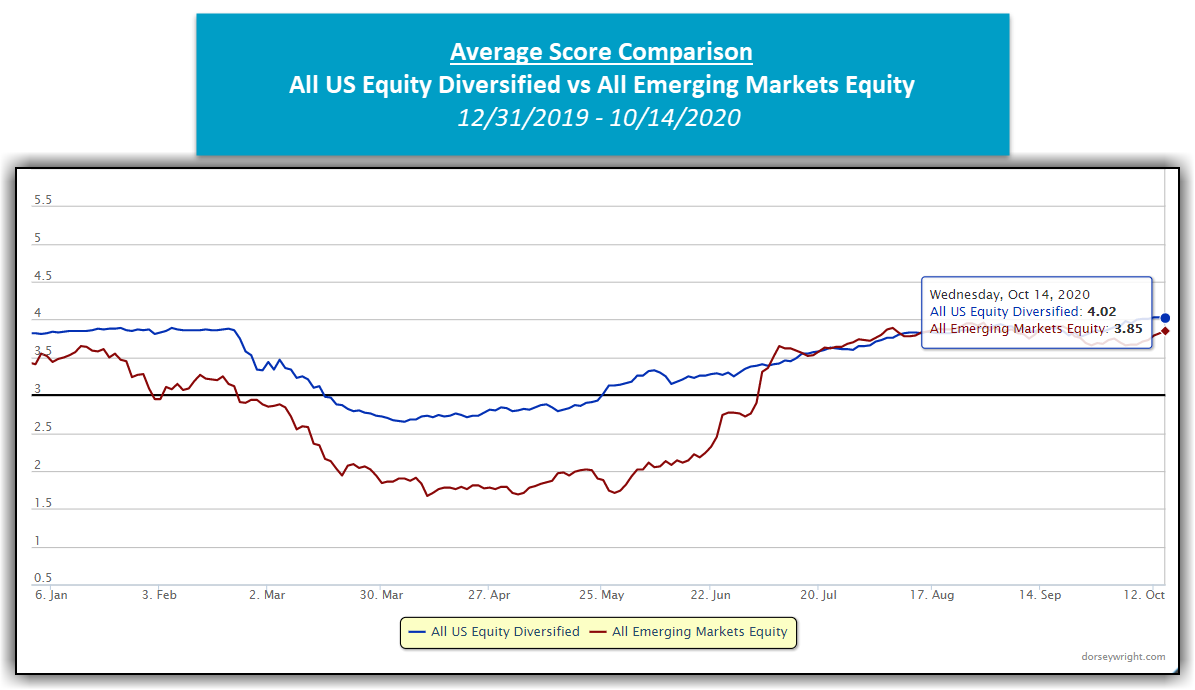
One group that has shown recent strength is the All Emerging Markets Equity group, which currently is positioned just south of the 4.00 threshold with an average score of 3.85. This group also possesses the highest average score direction of any of the DALI Style groups, with a recent directional posting of 2.16.
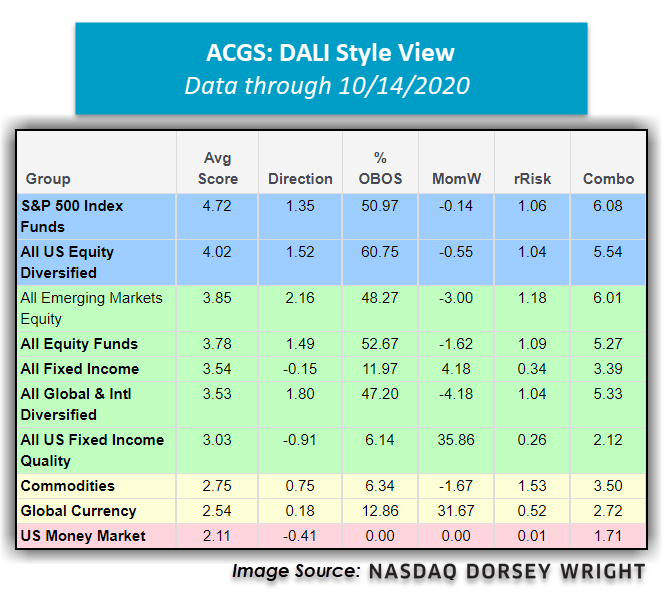
The emerging markets equity space had been positioned in line with the all US Equity Diversified group throughout much of the global equity rally, however, the volatility that ensued in September led to a weakening score from the emerging markets representative. After being positioned above all US Equity Diversified in mid-September with an average score of 3.91, Emerging Markets Diversified fell slightly south but has shown recent improvement to bring the group back to relatively the same position. The All US Equity Diversified group has continued to move steadily higher, but the domestic representative has not advanced as quickly as the emerging markets group in recent weeks. This relationship will be important to monitor as we head through the final months of 2020.

Average Level
13.19
| AGG | iShares US Core Bond ETF |
| USO | United States Oil Fund |
| DIA | SPDR Dow Jones Industrial Average ETF |
| DVY | iShares Dow Jones Select Dividend Index ETF |
| DX/Y | NYCE U.S.Dollar Index Spot |
| EFA | iShares MSCI EAFE ETF |
| FXE | Invesco CurrencyShares Euro Trust |
| GLD | SPDR Gold Trust |
| GSG | iShares S&P GSCI Commodity-Indexed Trust |
| HYG | iShares iBoxx $ High Yield Corporate Bond ETF |
| ICF | iShares Cohen & Steers Realty ETF |
| IEF | iShares Barclays 7-10 Yr. Tres. Bond ETF |
| LQD | iShares iBoxx $ Investment Grade Corp. Bond ETF |
| IJH | iShares S&P 400 MidCap Index Fund |
| ONEQ | Fidelity Nasdaq Composite Index Track |
| QQQ | Invesco QQQ Trust |
| RSP | Invesco S&P 500 Equal Weight ETF |
| IWM | iShares Russell 2000 Index ETF |
| SHY | iShares Barclays 1-3 Year Tres. Bond ETF |
| IJR | iShares S&P 600 SmallCap Index Fund |
| SPY | SPDR S&P 500 Index ETF Trust |
| TLT | iShares Barclays 20+ Year Treasury Bond ETF |
| GCC | WisdomTree Continuous Commodity Index Fund |
| VOOG | Vanguard S&P 500 Growth ETF |
| VOOV | Vanguard S&P 500 Value ETF |
| EEM | iShares MSCI Emerging Markets ETF |
| XLG | Invesco S&P 500 Top 50 ETF |
| Symbol | Company | Sector | Current Price | Action Price | Target | Stop | Notes |
|---|---|---|---|---|---|---|---|
| SHW | The Sherwin-Williams Company | Building | $693.99 | 670 - 710 | 840 | 552 | 4 for 5'er, top half of favored BUIL sector matrix, LT pos market RS, multiple buy signals, pullback from ATH Earnings 10/27 |
| CHRW | C.H. Robinson Worldwide, Inc. | Transports/Non Air | $104.82 | hi 90s - low 100s | 146 | 82 | 4 for 5'er, #6 of 43 names in TRAN sector matrix, one box from mkt RS buy signal, spread triple top, 2% yield Earnings 10/27 |
| LOGI | Logitech International S.A. | Computers | $80.15 | mid-to-high 70s | 91 | 64 | 5 for 5'er, top 20% of favored COMP sector matrix, triple top breakout, 1.1% yield, LT pos mkt RS |
| BLDR | Builders FirstSource, Inc. | Building | $33.91 | low-to-mid 30s | 54.50 | 27 | 5 for 5'er, #4 of 74 in BUIL sector matrix, multiple buy signals, R-R>3.0, pot. covered write. Earn. 10/29 |
| SWKS | Skyworks Solutions, Inc. | Semiconductors | $153.31 | low 140s to low 160s | 196 | 122 | 4 for 5'er, pullback from ATH, top 25% of DWASEMI, pos weekly momentum flip Earnings 11/10 |
| VEEV | Veeva Systems Inc. | Software | $300.61 | 270s to 300s | 328 | 232 | 5 for 5'er, pullback from AT high, consec buy signals, long-term market RS buy signal, top 25% DWASOFT |
| ARNC | Arconic Corp. | Metals Non Ferrous | $22.48 | low 20s | 29.50 | 18 | 5 for 5'er, #2 of 14 in favored META sector matrix, triple top breakout, pot. covered write |
| LEN | Lennar Corporation | Building | $83.32 | low to mid 80s | 94 | 67 | 5 for 5'er, pullback from ATH, consec buy signals, pos trend, pos weekly mom flip, 1.19% yield |
| BJ | BJ's Wholesale Club Holdings Inc | Retailing | $40.01 | low to mid 40s | 52 | 32 | 4 for 5'er, favored retailing sector, consec buy signals, pullback from ATH |
| Z | Zillow Group Inc. Class C | Real Estate | $102.87 | low to mid 100s | 152 | 82 | 5 for 5'er, #1 in DWA Real Estate matrix, consec buy signals, pullback from ATH |
| Symbol | Company | Sector | Current Price | Action Price | Target | Stop | Notes |
|---|
| Symbol | Company | Sector | Current Price | Action Price | Target | Stop | Notes |
|---|---|---|---|---|---|---|---|
| QCOM | QUALCOMM Incorporated | Semiconductors | $129.88 | mid $110s to upper $120s | $161 | 104 | See follow comment below. |
| Comment |
|---|
| QCOM QUALCOMM Incorporated R ($128.11) - Semiconductors - QCOM has moved outside of our actionable range. We will raise our stop to $104, which would take out multiple levels of support on QCOM's default chart. Earnings are expected on 11/4. |
Z Zillow Group Inc. Class C R ($102.00) - Real Estate - Z is a perfect 5 for 5’er that currently ranks #1 out of 122 names in the real estate sector stock matrix. Z has given five consecutive buy signals, confirming that demand is in control. Earlier this month, Z printed a new all-time high at $112 before exhaling slightly to $100. With today’s market action, Z has reversed back up into Xs to $106. Okay to add new exposure in the low to mid 100s. We will set our initial stop at $82, which would take out multiple levels of support on the chart. We will use a modified price objective of $152 as our near-term price target.
| 112.00 | X | 112.00 | ||||||||||||||||||||||||||||||||||||||||||||||||||||
| 110.00 | X | O | 110.00 | |||||||||||||||||||||||||||||||||||||||||||||||||||
| 108.00 | X | O | 108.00 | |||||||||||||||||||||||||||||||||||||||||||||||||||
| 106.00 | A | O | x | 106.00 | ||||||||||||||||||||||||||||||||||||||||||||||||||
| 104.00 | X | O | x | 104.00 | ||||||||||||||||||||||||||||||||||||||||||||||||||
| 102.00 | X | X | O | x | 102.00 | |||||||||||||||||||||||||||||||||||||||||||||||||
| 100.00 | X | O | X | O | 100.00 | |||||||||||||||||||||||||||||||||||||||||||||||||
| 99.00 | X | O | X | 99.00 | ||||||||||||||||||||||||||||||||||||||||||||||||||
| 98.00 | X | X | O | X | 98.00 | |||||||||||||||||||||||||||||||||||||||||||||||||
| 97.00 | X | X | O | X | O | X | 97.00 | |||||||||||||||||||||||||||||||||||||||||||||||
| 96.00 | X | O | X | O | X | O | X | 96.00 | ||||||||||||||||||||||||||||||||||||||||||||||
| 95.00 | X | O | X | O | X | O | X | 95.00 | ||||||||||||||||||||||||||||||||||||||||||||||
| 94.00 | X | O | X | O | X | O | 94.00 | |||||||||||||||||||||||||||||||||||||||||||||||
| 93.00 | X | O | X | O | X | 93.00 | ||||||||||||||||||||||||||||||||||||||||||||||||
| 92.00 | X | X | O | O | 92.00 | |||||||||||||||||||||||||||||||||||||||||||||||||
| 91.00 | X | O | X | 91.00 | ||||||||||||||||||||||||||||||||||||||||||||||||||
| 90.00 | X | O | X | Mid | 90.00 | |||||||||||||||||||||||||||||||||||||||||||||||||
| 89.00 | X | O | X | 89.00 | ||||||||||||||||||||||||||||||||||||||||||||||||||
| 88.00 | X | 9 | O | X | 88.00 | |||||||||||||||||||||||||||||||||||||||||||||||||
| 87.00 | X | O | X | O | X | 87.00 | ||||||||||||||||||||||||||||||||||||||||||||||||
| 86.00 | X | O | X | O | X | X | 86.00 | |||||||||||||||||||||||||||||||||||||||||||||||
| 85.00 | X | X | X | O | O | X | O | X | 85.00 | |||||||||||||||||||||||||||||||||||||||||||||
| 84.00 | X | O | X | O | X | O | X | X | O | X | 84.00 | |||||||||||||||||||||||||||||||||||||||||||
| 83.00 | X | O | X | O | X | O | X | O | X | O | 83.00 | |||||||||||||||||||||||||||||||||||||||||||
| 82.00 | X | O | X | O | X | O | X | O | X | 82.00 | ||||||||||||||||||||||||||||||||||||||||||||
| 81.00 | X | O | X | O | O | X | O | 81.00 | ||||||||||||||||||||||||||||||||||||||||||||||
| 80.00 | X | O | X | O | 80.00 | |||||||||||||||||||||||||||||||||||||||||||||||||
| 79.00 | X | O | X | 79.00 | ||||||||||||||||||||||||||||||||||||||||||||||||||
| 78.00 | X | O | X | X | 78.00 | |||||||||||||||||||||||||||||||||||||||||||||||||
| 77.00 | X | O | X | O | X | 77.00 | ||||||||||||||||||||||||||||||||||||||||||||||||
| 76.00 | X | O | X | O | X | • | 76.00 | |||||||||||||||||||||||||||||||||||||||||||||||
| 75.00 | X | O | O | X | • | 75.00 | ||||||||||||||||||||||||||||||||||||||||||||||||
| 74.00 | X | O | • | 74.00 | ||||||||||||||||||||||||||||||||||||||||||||||||||
| 73.00 | X | • | 73.00 | |||||||||||||||||||||||||||||||||||||||||||||||||||
| 72.00 | X | • | 72.00 | |||||||||||||||||||||||||||||||||||||||||||||||||||
| 71.00 | X | X | • | 71.00 | ||||||||||||||||||||||||||||||||||||||||||||||||||
| 70.00 | X | O | X | • | 70.00 | |||||||||||||||||||||||||||||||||||||||||||||||||
| 69.00 | X | X | O | X | • | 69.00 | ||||||||||||||||||||||||||||||||||||||||||||||||
| 68.00 | X | O | X | 8 | • | 68.00 | ||||||||||||||||||||||||||||||||||||||||||||||||
| 67.00 | X | O | X | • | 67.00 | |||||||||||||||||||||||||||||||||||||||||||||||||
| 66.00 | X | X | O | X | • | 66.00 | ||||||||||||||||||||||||||||||||||||||||||||||||
| 65.00 | X | X | O | X | O | • | 65.00 | |||||||||||||||||||||||||||||||||||||||||||||||
| 64.00 | X | O | X | X | X | O | X | X | • | Bot | 64.00 | |||||||||||||||||||||||||||||||||||||||||||
| 63.00 | X | O | X | O | X | O | X | X | O | X | O | X | • | 63.00 | ||||||||||||||||||||||||||||||||||||||||
| 62.00 | X | O | X | O | X | O | X | O | X | O | X | O | X | • | 62.00 | |||||||||||||||||||||||||||||||||||||||
| 61.00 | X | O | X | O | X | O | X | O | X | O | O | X | • | 61.00 | ||||||||||||||||||||||||||||||||||||||||
| 60.00 | X | X | 6 | O | X | O | X | O | O | X | O | X | • | 60.00 | ||||||||||||||||||||||||||||||||||||||||
| 59.00 | X | O | X | O | X | O | O | X | O | X | O | X | • | 59.00 | ||||||||||||||||||||||||||||||||||||||||
| 58.00 | X | O | X | O | X | O | X | O | 7 | O | X | • | 58.00 | |||||||||||||||||||||||||||||||||||||||||
| 57.00 | X | X | O | O | O | X | O | X | O | • | 57.00 | |||||||||||||||||||||||||||||||||||||||||||
| 56.00 | • | X | O | X | O | O | X | • | 56.00 | |||||||||||||||||||||||||||||||||||||||||||||
| 55.00 | • | X | O | X | O | • | 55.00 | |||||||||||||||||||||||||||||||||||||||||||||||
| 54.00 | • | X | O | X | • | 54.00 | ||||||||||||||||||||||||||||||||||||||||||||||||
| 53.00 | • | X | O | X | • | 53.00 | ||||||||||||||||||||||||||||||||||||||||||||||||
| 52.00 | • | X | O | X | X | • | 52.00 | |||||||||||||||||||||||||||||||||||||||||||||||
| 51.00 | X | O | X | O | X | • | 51.00 | |||||||||||||||||||||||||||||||||||||||||||||||
| 50.00 | X | O | X | O | X | • | 50.00 | |||||||||||||||||||||||||||||||||||||||||||||||
| 49.00 | X | O | X | O | • | 49.00 | ||||||||||||||||||||||||||||||||||||||||||||||||
| 48.00 | X | O | X | • | 48.00 | |||||||||||||||||||||||||||||||||||||||||||||||||
| 47.00 | X | O | X | • | 47.00 | |||||||||||||||||||||||||||||||||||||||||||||||||
| 46.00 | X | X | O | • | 46.00 | |||||||||||||||||||||||||||||||||||||||||||||||||
| 45.00 | X | O | X | • | 45.00 | |||||||||||||||||||||||||||||||||||||||||||||||||
| 44.00 | X | O | X | • | 44.00 | |||||||||||||||||||||||||||||||||||||||||||||||||
| 43.00 | X | O | X | • | 43.00 | |||||||||||||||||||||||||||||||||||||||||||||||||
| 42.00 | X | X | 5 | X | • | 42.00 | ||||||||||||||||||||||||||||||||||||||||||||||||
| 41.00 | O | X | O | X | O | • | 41.00 | |||||||||||||||||||||||||||||||||||||||||||||||
| 40.00 | O | X | O | X | • | 40.00 | ||||||||||||||||||||||||||||||||||||||||||||||||
| 39.00 | O | O | X | • | 39.00 | |||||||||||||||||||||||||||||||||||||||||||||||||
| 38.00 | O | X | • | 38.00 | ||||||||||||||||||||||||||||||||||||||||||||||||||
| 37.00 | O | X | • | 37.00 | ||||||||||||||||||||||||||||||||||||||||||||||||||
| 36.00 | O | X | • | 36.00 | ||||||||||||||||||||||||||||||||||||||||||||||||||
| 35.00 | O | X | • | 35.00 | ||||||||||||||||||||||||||||||||||||||||||||||||||
| 34.00 | O | • | 34.00 |

| CRI Carter's, Inc. ($83.36) - Textiles/Apparel - CRI broke a double bottom at $82 and successfully completed a bearish catapult pattern on Thursday. This stock is a weak 1 for 5’er that ranks 19th out of 22 names in the textiles/apparel sector RS matrix. Last week, CRI moved into a negative trend. The weight of the evidence is negative, and supply is in control. Avoid. From here, CRI has additional support available at the $77 level. |
| EAT Brinker International Inc ($48.73) - Restaurants - EAT broke a spread triple top at $49 before moving higher to $50. This marks the second consecutive buy signal on the chart as well as a new multi-year high. EAT is a perfect 5 for 5’er that ranks #1 in the favored restaurants sector. Demand is in control. Support sits at $45 and $41. |
| EXPE Expedia Group Inc. ($89.30) - Leisure - EXPE moved back into a negative trend on Thursday when the stock broke a double bottom at $88. EXPE is a 2 for 5’er within the leisure sector that has experienced four weeks of negative weekly momentum. From here, support sits at $86 and $81. Earnings are expected on 11/4. |
| HEI Heico Corporation ($114.38) - Aerospace Airline - Shares of HEI returned to a buy signal on Thursday with a spread triple top break at $116. The 5 for 5'er ranks in the top half of the favored aerospace airline stock sector matrix and demonstrates positive long-term relative strength versus the market, remaining on an RS buy signal since November of 2003. The weight of the evidence is positive and HEI is actionable at current levels. The next level of resistance resides around $118 while initial support is offered at $100. |
| SWK Stanley Black & Decker, Inc. ($176.35) - Machinery and Tools - SWK shares reversed down into a column of Os on Thursday, offering a buy on pullback opportunity for investors. The 4 for 5'er ranks in the top third of the machinery and tools stock sector matrix and recently returned to a relative strength buy signal versus the market earlier this month. Demand is in control. Initial support is offered around $154 while resistance can be found at $180, the all-time chart high. Note earnings are expected on October 27th. |
| TRUP Trupanion Inc. ($93.06) - Insurance - TRUP shares pushed higher today to break a double top at $93 to mark its third consecutive buy signal and reach a new all-time high. This 5 for 5'er has been in a positive trend since May and on an RS buy signal versus the market since March.TRUP is currently the number one ranked stock in the Insurance sector RS matrix. Those wishing to initiate a long position may be best served to wait for a pullback or price normalization as TRUP is on the verge of being heavily overbought with a weekly overbought/oversold reading of 69%. From here, support can be found at $89. Note that earnings are expected on 10/29. |
| Name | Option Symbol | Action | Stop Loss |
|---|---|---|---|
| T-Mobile US Inc. - $115.30 | TMUS2115A115 | Buy the January 115.00 calls at 8.20 | 102.00 |
| Name | Option | Action |
|---|---|---|
| Crocs, Inc. ( CROX) | Dec. 37.00 Calls | Raise the option stop loss to 11.20 (CP: 13.20) |
| Crocs, Inc. ( CROX) | Dec. 39.00 Calls | Raise the option stop loss to 11.20 (CP: 13.20) |
| Marvell Technology Group Ltd. ( MRVL) | Jan. 38.00 Calls | Stopped at 6.30 (CP: 6.20) |
| Name | Option Symbol | Action | Stop Loss |
|---|---|---|---|
| Equity Residential - $52.31 | EQR2115M55 | Buy the January 55.00 puts at 5.80 | 57.00 |
| Name | Option | Action |
|---|---|---|
| Walgreens Boots Alliance Inc. (WBA) | Jan. 42.50 Puts | Stopped at 6.40 (CP: 6.05) |
| Name | Option Sym. | Call to Sell | Call Price | Investment for 500 Shares | Annual Called Rtn. | Annual Static Rtn. | Downside Protection |
|---|---|---|---|---|---|---|---|
| Lowe's Companies, Inc. $173.61 | LOW2115A180 | Jan. 180.00 | 9.10 | $84,451.25 | 21.93% | 17.02% | 4.11% |
| Name | Action |
|---|---|
| Dynatrace, Inc. (DT) - 43.71 | Sell the December 45.00 Calls. |
| The Chemours Company (CC) - 22.96 | Sell the January 23.00 Calls. |
| Snap Inc (SNAP) - 27.32 | Sell the January 25.00 Calls. |
| Synchrony Financial (SYF) - 28.67 | Sell the January 28.00 Calls. |
| Twitter, Inc (TWTR) - 45.98 | Sell the January 47.00 Calls. |
| L Brands Inc. (LB) - 31.98 | Sell the January 35.00 Calls. |
| D.R. Horton, Inc. (DHI) - 78.27 | Sell the January 80.00 Calls. |
| Builders FirstSource, Inc. (BLDR) - 33.91 | Sell the January 34.00 Calls. |
| Dow, Inc. (DOW) - 48.83 | Sell the January 50.00 Calls. |
| Williams Companies Inc. (WMB) - 19.68 | Sell the January 20.00 Calls. |
| CSX Corporation (CSX) - 80.47 | Sell the January 82.50 Calls. |
| Name | Covered Write |
|---|---|
| VICI Properties Inc ( VICI - 23.68 ) | March 25.00 covered write. |
| eBay Inc. ( EBAY - 56.46 ) | January 60.00 covered write. |
Daily Equity & Market Analysis
Loading, Please Wait...
