
Most Requested Symbols

Although September is typically a poor month for equity investors, there can often be asset class or equity sector trends of which to take advantage. One of those trends over the last 30 years has been found in gold, as well as other areas that tend to have lower correlations to equities.
While the domestic equity improvement has been the major focus of most of our research over the past few weeks, there are certainly other risk-on assets showing near-term improvement, such as commodities.
Today's featured stock is Callaway Golf Company (ELY)
ADBE, AMED, FRPT, INTU, PAR, SEAS, V, BAND, RPD, & RST
Call: Visa (V), Put: Valero Energy (VLO) Covered Write: QUALCOMM Inc. (QCOM)
Beginners Series Webinar - Join us on Friday, August 21st, at 2 PM (ET) for our NDW Beginners Series Webinar. This week's topic is Using the Custom Modeler tool. Register here.
Monday Market Update Webinar Replay: Missed Monday's (8/17) webcast? Click the link(s) below for a recap:
If you previously used the “Other Ideas” tool/link on the NDW Research Platform and found yourself puzzled in recent weeks when it seemingly disappeared, rest assured it simply has a new home above the Point and Figure trend chart.
Just like before and as the name implies, the “Other Ideas” link/button is designed to provide a list of alternate investable options (stocks, ETFs, or funds); however, keep in mind that it also incorporates a few technical screens by default. In order to make the list a security must be: in the same sector, trading above their bullish support line, on a Point and Figure trend chart buy signal, and have a technical attribute or fund score above 3.0. Furthermore, with the “Other Ideas” window note that each column header is sortable and users have the option to send names to a portfolio, matrix, team, or quilt.
Perhaps a practical use case for the “Other Ideas” (now) blue button is this: you own(ed) a particular name yet it has suffered lately, resulting in a weak technical picture; however, you still want exposure within the space and would like to quickly see technically strong alternatives/substitutes. Another being: maybe you stumble across a technically strong name but it is heavily overbought and/or too volatile, using the “Other Ideas” button could provide a list of alternate yet similar choices.


We’re less than two weeks away from entering the month of September, which has earned a bad reputation with investors over the years. Historically, September has been the single worst-performing month for the S&P 500 Index SPX, the Dow Jones Industrial Average DJIA, and the Nasdaq Composite NASD (source: Stock Trader's Almanac 2020). The Almanac says “September is when leaves and stocks tend to fall; on Wall Street, it’s the worst month of all.”
As a result of the poor equity performance, many investors look for opportunities in assets with low correlations to equities in the month of September. One asset in particular that receives a lot of credit for helping investors through this frustrating month is gold, and the numbers below support this statement. Gold has posted a positive return in 21 out of the 33 Septembers since 1987. In other words, September has been a positive month for gold investments about 64% of the time. The average return for gold during all 33 Septembers measured comes out to 1.69%, with an average of 4.98% during positive Septembers.
In the table below, you will also see the historical September returns for different asset classes as far back as data exists in our system. Not surprisingly, areas like gold, crude oil, and bonds have provided the best returns. In fact, each asset class (with the exception of US large-cap and mid-cap) has a greater historical probability of producing a gain for the month of September than it does at producing a loss. However, up versus down is just half the story -- the degree of those moves is another thing to consider. Take a look at the two international equity proxies in the table (the developed and emerging stock indexes). Even though they have historically posted a gain more than 50% of the time, the losing years outweigh the winning years in terms of the magnitude of movement. For example, developed international stocks have seen gains in 58% of the Septembers going back to 1980, producing an average return of 3.62%. However, during the years when this index was down during September, the average loss was -5.44%. As a result, the average return for the month of September is in the red at -2.3%. Similar numbers can be seen for US small-cap stocks as well.

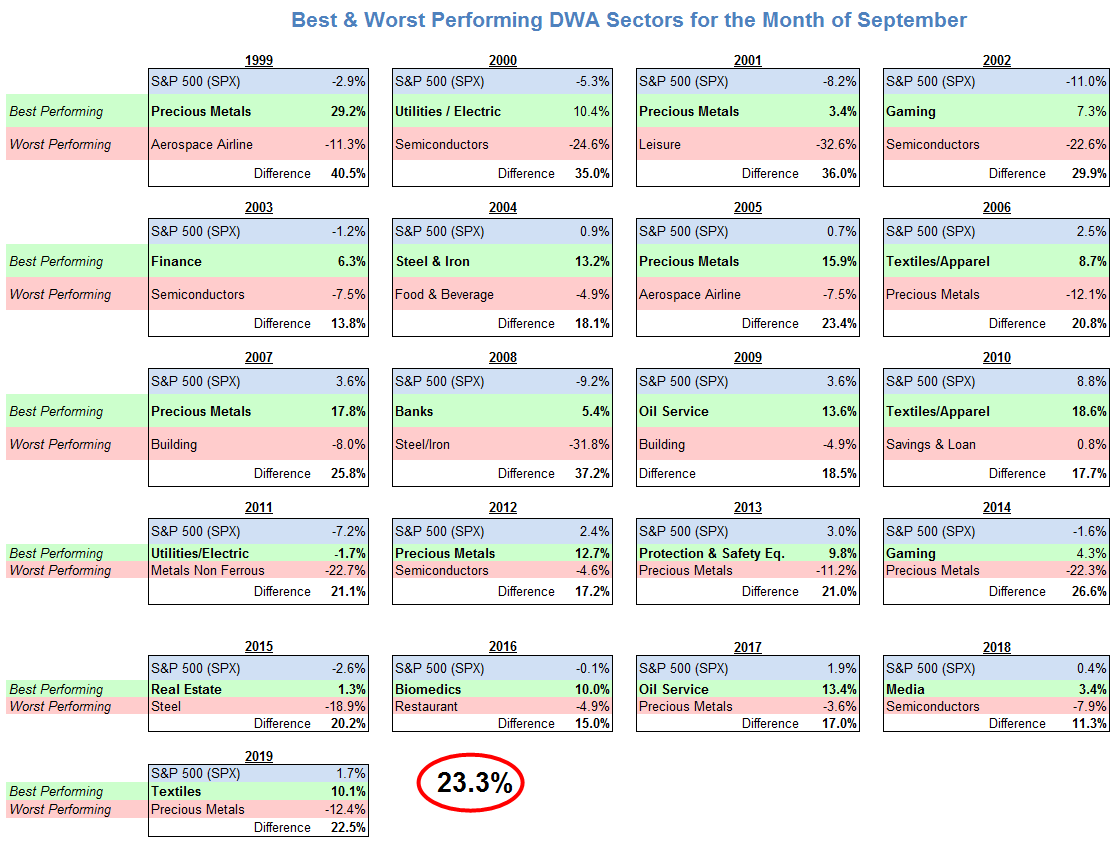
Although September is generally recognized as a poor month for equity investors, there have been a few impressive outlying Septembers, such as 2007, 2009, 2010, and 2013, all of which saw gains of 3% or greater for the SPX. Even though September has not generally been kind to the broad equity indexes, there have been opportunities provided by sector rotation. Take 2008 for instance. The SPX as a whole was down -9.20%, however, the DWA Bank Sector Index DWABANK actually provided a gain in excess of 5%. On the other side of the story, the Steel & Iron sector DWASTEE fell 31.8%, bringing the performance differential for September 2008 to 37.2%, the second-largest dispersion of all Septembers since 1999. On average, this differential is around 23% over the last 20 years. Last year, the DWA Textiles Index DWATEXT was up 10.1% while the DWA Precious Metals Index DWAPREC was the worst-performing, finishing down –12.4%. This was the largest difference between the best and the worst-performing in the last five years, although it was slightly below the average for the entire lookback period.
In the table below, you can see the best and worst-performing sectors during the month of September for each year going back to 1999. While Precious Metals has been the best performing sector five times, the most of any sector, it also tied for most Septembers as the worst performing sector with five; Semiconductors has also been the worst-performing sector in five Septembers.
We have no way of knowing whether this September will be positive or negative for the market and there are no shortage of factors this year that could sway performance one way or the other. However, it is beneficial to be aware of how September came to be known as the worst month for stocks and how other areas of the market have fared historically.
The domestic equity market has continued to push higher over the past week, with most major indexes either printing or nearing new all-time highs. This has led to further improvement from the US equity core percentile rank (CorePR), which has risen to a recent level of 92.96%, as those large cap names which make up the representative for this reading have outpaced most other investible areas of the market. This continued strength from risk-on assets has led to a further dampening of the money market percentile rank (MMPR), which comes in at a recent posting of 6.34%.
While the domestic equity improvement has been the major focus of most of our research over the past few weeks, there are certainly other risk-on assets showing near-term improvement, such as commodities. The commodities conversation has been largely centered around precious metals throughout most of the market rally, and rightfully so, as the precious metals group on the Asset Class Group Scores (ACGS) page remains in elevated score territory with a recent average score of 4.45. While this is not as high as the 5.12 score that the group posted earlier this month, the space has continued to maintain strength among the top 20 groups on the entire ACGS system. This slight downtick in score also led to normalization of the average overbought/oversold (OBOS) reading for the precious metals group, which climbed as high as 199% on August 6 before dropping to current levels at 71%, potentially providing a more opportune entry point for those looking to gain exposure to the space.

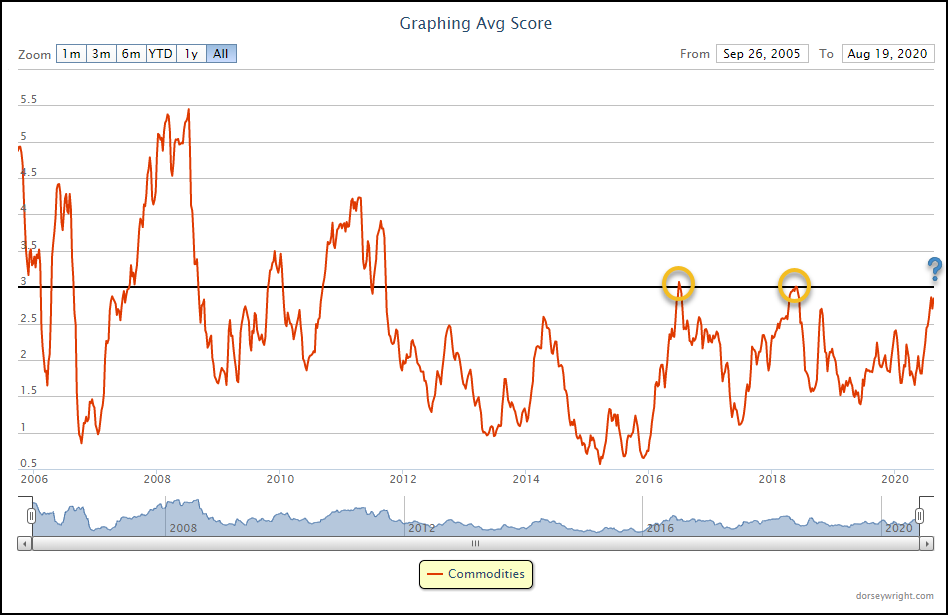
The continued strength of precious metals has led to further improvement from the broader commodities group, which is nearing the sought after 3.00 score threshold with an average score of 2.87. In looking at the score history of this group, we can see that commodities have had difficulty remaining above an average score of 3.00 since 2011. The group saw two occasions since that time where the score did move above 3.00, in July of 2016 and May of 2018, however, the group was unable to maintain a score above 3.00 for more than a couple of days in each instance. While we will see if this recent rise in score plays out differently, the near-term strength demonstrated by various areas within the commodities space certainly paints a positive picture for further improvement.
One of the other areas within commodities that have shown recent progress is agriculture. While this space has yet to move into favorable score territory with an average score of 2.11, we can see through the Group Score Report page that this group is the second most improved group on the entire ACGS page over the past 30 days, moving higher by 0.71 score points (through 8/20). Agriculture has some work left to do in order to reach its year-to-date score high of 2.45 and will be a place to monitor for more upside that has the potential to push the broader commodities space higher.

Average Level
32.02
| AGG | iShares US Core Bond ETF |
| USO | United States Oil Fund |
| DIA | SPDR Dow Jones Industrial Average ETF |
| DVY | iShares Dow Jones Select Dividend Index ETF |
| DX/Y | NYCE U.S.Dollar Index Spot |
| EFA | iShares MSCI EAFE ETF |
| FXE | Invesco CurrencyShares Euro Trust |
| GLD | SPDR Gold Trust |
| GSG | iShares S&P GSCI Commodity-Indexed Trust |
| HYG | iShares iBoxx $ High Yield Corporate Bond ETF |
| ICF | iShares Cohen & Steers Realty ETF |
| IEF | iShares Barclays 7-10 Yr. Tres. Bond ETF |
| LQD | iShares iBoxx $ Investment Grade Corp. Bond ETF |
| IJH | iShares S&P 400 MidCap Index Fund |
| ONEQ | Fidelity Nasdaq Composite Index Track |
| QQQ | Invesco QQQ Trust |
| RSP | Invesco S&P 500 Equal Weight ETF |
| IWM | iShares Russell 2000 Index ETF |
| SHY | iShares Barclays 1-3 Year Tres. Bond ETF |
| IJR | iShares S&P 600 SmallCap Index Fund |
| SPY | SPDR S&P 500 Index ETF Trust |
| TLT | iShares Barclays 20+ Year Treasury Bond ETF |
| GCC | WisdomTree Continuous Commodity Index Fund |
| VOOG | Vanguard S&P 500 Growth ETF |
| VOOV | Vanguard S&P 500 Value ETF |
| EEM | iShares MSCI Emerging Markets ETF |
| XLG | Invesco S&P 500 Top 50 ETF |
| Symbol | Company | Sector | Current Price | Action Price | Target | Stop | Notes |
|---|---|---|---|---|---|---|---|
| PII | Polaris Inc. | Leisure | $103.50 | low $100s to mid $110s | $138 | $84 | 5 for 5'er, one box from 5th consec buy signal, pos weekly mom flip, 2 mons pos month momentum, 2.36% yield |
| NRG | NRG Energy, Inc. | Utilities/Electricity | $35.41 | mid to upper 30s | $49 | $27 | 5 for 5'er, LT market RS buy signal, consec buy signals, pos mon and weekly momentum, 3.58% yield |
| CTAS | Cintas Corporation | Textiles/Apparel | $318.50 | low 300s to mid 330s | $400 | $252 | 5 for 5'er, top 25% of favored DWATEXT sector, pos mon & weekly mom, LT market/peer RS buy signals, up against ATH. |
| WMB | Williams Companies Inc. | Gas Utilities | $21.65 | 20 - 22 | 26.5 | 17 | 4 for 5'er, top 10% of GUTI sector matrix, 7.7% yield, pot. covered write |
| DXCM | Dexcom Inc. | Healthcare | $432.88 | 410s to 470s | 488 | 360 | 5 for 5'er, pullback from AT high, consec buy signals, LT market RS buy signal, top 1/3 of DWAHEAL |
| EBAY | eBay Inc. | Internet | $57.71 | mid-to-upper 50s | 100 | 46 | 5 for 5'er, top third of favored INET sector matrix, LT pos mkt RS, pullback from ATH |
| NKE | NIKE, Inc. | Textiles/Apparel | $108.39 | hi 90s - mid 100s | 112 | 89 | 4 for 5'er, top half of TEXT sector matrix, LT pos mkt RS, big base breakout to new ATH |
| DECK | Deckers Outdoor Corporation | Textiles/Apparel | $207.70 | low 200s to mid 230s | 284 | 178 | 5 for 5'er, pullback from ATH, consec buy signals, pos mon mom, top 10% of DWATEXT |
| PLD | ProLogis | Real Estate | $101.74 | hi 90s - mid 100s | 116 | 87 | 5 for 5'er, top third of REAL sector matrix, spread triple top, pos monthly mom flip, 2.2% yield |
| ELY | Callaway Golf Company | Leisure | $18.80 | mid/upper 10s | 27.50 | 14.50 | 4 for 5'er, 6 consec buy signals, pos mon mom, top 1/3 of DWALEIS |
| Symbol | Company | Sector | Current Price | Action Price | Target | Stop | Notes |
|---|---|---|---|---|---|---|---|
| THS | TreeHouse Foods, Inc. | Food Beverages/Soap | $42.58 | low to mid 40s | 36 | 53 | 0 for 5'er, consec sell signals, LT market RS sell signal, bottom quartile of DWAFOOD |
| Symbol | Company | Sector | Current Price | Action Price | Target | Stop | Notes |
|---|---|---|---|---|---|---|---|
| NOW | Servicenow Inc | Software | $437.13 | low 440s to upper 460s | $588 | $364 | See follow comment below. |
| Comment |
|---|
| SNPS Synopsys Inc R ($210.92) - Software - Raise stop to $176, which would take out multiple levels of support on the default chart. |
| NOW Servicenow Inc R ($451.19) - Software - Okay to initiate new positions here. We will raise our stop to $364, which would take out multiple levels of support. |
ELY Callaway Golf Company R ($18.72) - Leisure - ELY is a solid 4 for 5’er that ranks in the top third of the favored leisure sector RS matrix. In March, ELY returned to a buy signal at $9 and has since given a total of six consecutive buy signals, confirming that demand is in control. Monthly momentum has been positive for two months, suggesting the potential for higher prices. After breaking through resistance dating back to February at $20, ELY has pulled back slightly to $18 and remains well above initial support at $16.50. Okay to add new exposure in the mid to upper 10s. We will set our initial stop loss at $14.50, which would violate multiple levels of support on ELY’s default chart, and we will use a modified bullish price objective of $27.50 as our near-term price target.
| 15 | 16 | 17 | 18 | 19 | 20 | ||||||||||||||||||||||||||||||||||||||||||||||||
| 24.00 | 9 | • | 24.00 | ||||||||||||||||||||||||||||||||||||||||||||||||||
| 23.00 | X | O | • | • | 23.00 | ||||||||||||||||||||||||||||||||||||||||||||||||
| 22.00 | X | O | • | 1 | • | Top | 22.00 | ||||||||||||||||||||||||||||||||||||||||||||||
| 21.00 | X | A | • | X | O | • | 21.00 | ||||||||||||||||||||||||||||||||||||||||||||||
| 20.00 | X | 8 | B | • | X | X | X | O | • | X | 20.00 | ||||||||||||||||||||||||||||||||||||||||||
| 19.50 | 6 | O | X | O | • | X | O | X | O | X | 2 | X | • | 8 | O | 19.50 | |||||||||||||||||||||||||||||||||||||
| 19.00 | X | O | X | O | • | X | O | X | O | X | O | X | O | • | X | O | 19.00 | ||||||||||||||||||||||||||||||||||||
| 18.50 | 5 | 7 | O | • | X | X | O | 9 | A | X | O | X | O | • | X | O | 18.50 | ||||||||||||||||||||||||||||||||||||
| 18.00 | X | O | • | X | O | X | O | X | O | O | X | O | • | X | 7 | X | O | 18.00 | |||||||||||||||||||||||||||||||||||
| 17.50 | X | O | C | 3 | X | X | O | X | O | X | • | O | O | • | X | O | X | X | O | X | Mid | 17.50 | |||||||||||||||||||||||||||||||
| 17.00 | 4 | O | X | O | X | X | O | 4 | O | X | 8 | O | X | • | O | • | X | O | X | O | X | O | X | 17.00 | |||||||||||||||||||||||||||||
| 16.50 | 3 | O | X | O | X | O | X | O | X | O | X | O | • | O | • | 6 | O | X | O | X | O | 16.50 | |||||||||||||||||||||||||||||||
| 16.00 | X | O | O | 1 | O | X | O | X | 5 | 6 | • | 3 | • | X | O | X | O | 16.00 | |||||||||||||||||||||||||||||||||||
| 15.50 | X | 2 | O | X | 2 | X | O | • | O | X | • | O | • | X | O | X | 15.50 | ||||||||||||||||||||||||||||||||||||
| 15.00 | X | O | X | O | X | O | • | • | O | X | • | O | • | X | O | 15.00 | |||||||||||||||||||||||||||||||||||||
| 14.50 | A | O | X | O | • | O | • | O | X | X | 14.50 | ||||||||||||||||||||||||||||||||||||||||||
| 14.00 | X | B | X | • | • | O | X | O | X | 14.00 | |||||||||||||||||||||||||||||||||||||||||||
| 13.50 | 8 | 1 | • | O | X | O | X | 13.50 | |||||||||||||||||||||||||||||||||||||||||||||
| 13.00 | X | • | O | X | 5 | X | • | 13.00 | |||||||||||||||||||||||||||||||||||||||||||||
| 12.50 | X | X | • | O | X | O | X | • | Bot | 12.50 | |||||||||||||||||||||||||||||||||||||||||||
| 12.00 | X | O | 5 | • | O | X | X | O | X | • | 12.00 | ||||||||||||||||||||||||||||||||||||||||||
| 11.50 | X | X | O | 3 | • | O | X | O | X | X | O | X | • | 11.50 | |||||||||||||||||||||||||||||||||||||||
| 11.00 | 8 | O | X | C | X | • | O | X | X | O | X | O | X | O | • | 11.00 | |||||||||||||||||||||||||||||||||||||
| 10.50 | 6 | O | X | 2 | X | • | O | X | O | X | O | X | O | X | • | 10.50 | |||||||||||||||||||||||||||||||||||||
| 10.00 | 4 | X | 5 | B | O | • | O | X | O | X | O | O | • | 10.00 | |||||||||||||||||||||||||||||||||||||||
| 9.50 | O | 3 | O | A | O | 2 | • | O | X | 4 | • | 9.50 | |||||||||||||||||||||||||||||||||||||||||
| 9.00 | O | X | O | X | O | X | • | O | X | • | 9.00 | ||||||||||||||||||||||||||||||||||||||||||
| 8.50 | 4 | 2 | 7 | X | 1 | X | • | O | X | X | • | 8.50 | |||||||||||||||||||||||||||||||||||||||||
| 8.00 | 5 | X | 9 | O | • | O | X | O | X | • | 8.00 | ||||||||||||||||||||||||||||||||||||||||||
| 7.50 | 8 | X | • | • | O | X | O | X | • | 7.50 | |||||||||||||||||||||||||||||||||||||||||||
| 7.00 | A | • | O | X | O | • | 7.00 | ||||||||||||||||||||||||||||||||||||||||||||||
| 6.50 | • | O | X | • | 6.50 | ||||||||||||||||||||||||||||||||||||||||||||||||
| 6.00 | • | O | X | • | 6.00 | ||||||||||||||||||||||||||||||||||||||||||||||||
| 5.50 | O | X | • | 5.50 | |||||||||||||||||||||||||||||||||||||||||||||||||
| 5.00 | O | X | • | 5.00 | |||||||||||||||||||||||||||||||||||||||||||||||||
| 4.75 | O | • | 4.75 | ||||||||||||||||||||||||||||||||||||||||||||||||||
| 15 | 16 | 17 | 18 | 19 | 20 |

| ADBE Adobe Systems Incorporated ($473.96) - Software - Shares of ADBE moved higher Thursday to break a spread triple top at $472, marking its 10th consecutive buy signal and marking a new all-time high. This 5 for 5'er moved to a positive trend in April and ranks in the top half of the favored software sector RS matrix. The stock has also been on an RS buy signal against the market since mid-2015. Exposure may be considered at current levels, with initial support offered at $432 and further support offered at $424. Note that earnings are expected on 9/15. |
| AMED Amedisys, Inc. ($242.97) - Healthcare - AMED advanced Thursday to break a double top at $240 before pushing higher to a new all-time high at $244 intraday. This 5 for 5'er moved to a positive trend in June and ranks in the top third of the favored healthcare sector RS matrix. The stock has also been on an RS buy signal against the market since mid-2014. The overall weight of the evidence is certainly positive here, however, the recent movement has left the fund overbought with an intraday OBOS reading of 83.85% Thursday. Those looking to add exposure may look to wait for a pullback or normalization of the trading band. Initial support can be found at $224, with further support found at $198, $196 and $192. |
| BAND Bandwidth Inc. Class A ($158.90) - Software - BAND completed a shakeout pattern on Thursday with a triple top breakout at $158, marking a new all-time high on the chart. This stock is a strong 5 for 5’er within the favored software sector RS matrix. In addition, weekly momentum just flipped positive, suggesting the potential for higher prices. From here, initial support sits at $142. |
| FRPT Freshpet Inc ($114.77) - Food Beverages/Soap - FRPT continued higher Thursday to break a double top at $112 before marking a new all-time high intraday at $114. This 5 for 5'er moved to a positive trend in April and ranks 6th out of 72 names in the food beverages/soap sector RS matrix. Weekly and monthly momentum are also each positive, indicating the potential for further upside from here. The technical picture is strong, however, FRPT is now trading in heavily overbought territory so those looking to add exposure would be best served to wait for a pullback or normalization of the trading band. Initial support can be found at $99. |
| INTU Intuit Inc. ($318.21) - Software - Shares of INTU continued to advance Thursday and broke a spread triple top at $316, notching a new all-time high. This 4 for 5'er moved to a positive trend in April and has maintained an RS buy signal against the market since 2008. Weekly momentum also recently flipped positive, suggesting the potential for further upside from here. Exposure may be considered at current levels, with initial support offered at $300. Further support can be found at $288 and $284. Note that INTU has earnings expected on 8/25. |
| PAR Par Technology Corporation ($39.63) - Computers - PAR rose Thursday to break a double top at $37, marking its sixth consecutive buy signal before moving to a new all-time high at $39 intraday. This 4 for 5'er moved to a positive trend in May and ranks 4th out of 59 names in the favored computers sector RS matrix. Weekly and monthly momentum each recently flipped positive, suggesting the potential for higher prices. However, the intraday OBOS reading of 83% indicates the stock is now overbought, so those looking to add exposure would be best served to wait for a pullback or normalization of the trading band. Initial support can be found at $31 with further support found at $28. |
| RPD Rapid7 Inc. ($63.26) - Software - RPD broke a double top at $62 on Thursday before moving higher to $63. This marks the 10th consecutive buy signal on the chart, confirming that demand is in control. Weekly momentum has been positive for one week while monthly momentum has been positive for two months. From here, initial support sits at $57 while overhead resistance sits at $64. |
| RST Rosetta Stone, Inc. ($29.68) - Software - RST broke a double top at $29 on Thursday and is now trading at new multi-year highs. Today’s breakout marks the third consecutive buy signal on the chart, confirming that demand is in control. This stock is a 5 for 5’er within the favored software sector that ranks 5th out of 113 names in the sector stock matrix. Demand is in control however RST is trading in overbought territory. From here, initial support sits at $25. |
| SEAS SeaWorld Entertainment, Inc. ($19.26) - Leisure - SEAS moved higher Thursday to break a spread triple top at $19.50. This 3 for 5'er moved back to a positive trend last week and ranks in the top quartile of the favored leisure sector RS matrix. Weekly and monthly momentum also each recently flipped positive, suggesting the potential for further upside from here. The overall technical picture continues to improve. Initial support can be found at $17.50. Note that further support would not be found until the bullish support line, which currently resides at $15. |
| V Visa Inc. ($203.41) - Finance - V continued higher Thursday to break a spread quadruple top at $204. This 4 for 5'er moved to a positive trend in April and has maintained an RS buy signal against the market since late-2012. Weekly and monthly momentum also just flipped positive, indicating the potential for further price appreciation. Exposure may be considered at current levels, with initial support found at $190, which is also the current location of the bullish support line. Further overhead resistance may be found at the all-time high of $212 from February. |
| Name | Option Symbol | Action | Stop Loss |
|---|---|---|---|
| Visa Inc. - $204.15 | V2018L195 | Buy the December 195.00 calls at 18.15 | 186.00 |
| Name | Option | Action |
|---|---|---|
| Applied Materials, Inc. ( AMAT) | Oct. 55.00 Calls | Stopped at 6.70 (CP: 5.85) |
| Applied Materials, Inc. ( AMAT) | Oct. 60.00 Calls | Stopped at 5.50 (CP: 5.85) |
| D.R. Horton, Inc. ( DHI) | Nov. 60.00 Calls | Raise the option stop loss to 14.25 (CP: 16.25) |
| Name | Option Symbol | Action | Stop Loss |
|---|---|---|---|
| Valero Energy Corp - $52.70 | VLO2018X55 | Buy the December 55.00 puts at 7.50 | 57.00 |
| Name | Option | Action |
|---|---|---|
| Elanco Animal Health, Inc. (ELAN) | Oct. 25.00 Puts | Stopped at 27.00 (CP: 27.53) |
| Name | Option Sym. | Call to Sell | Call Price | Investment for 500 Shares | Annual Called Rtn. | Annual Static Rtn. | Downside Protection |
|---|---|---|---|---|---|---|---|
| QUALCOMM Incorporated $111.04 | QCOM2115A115 | Jan. 115.00 | 7.95 | $52,079.35 | 23.04% | 16.01% | 6.10% |
| Name | Action |
|---|---|
| Wendy's Company (WEN) - 21.18 | Sell the November 22.00 Calls. |
| Lennar Corporation (LEN) - 76.81 | Sell the November 75.00 Calls. |
| Teradyne, Inc. (TER) - 90.24 | Sell the January 97.50 Calls. |
| eBay Inc. (EBAY) - 57.71 | Sell the January 60.00 Calls. |
| Discover Financial Services (DFS) - 50.81 | Sell the January 60.00 Calls. |
| PulteGroup, Inc. (PHM) - 46.17 | Sell the January 50.00 Calls. |
| Electronic Arts Inc. (EA) - 141.86 | Sell the December 150.00 Calls. |
| Qorvo Inc. (QRVO) - 132.46 | Sell the November 135.00 Calls. |
| Name | Covered Write |
|---|---|
| Pennymac Mortgage Investment Trust ( PMT - 17.50 ) | January 20.00 covered write. |
Daily Equity & Market Analysis
Loading, Please Wait...
