
Most Requested Symbols

One technical characteristic that we monitor at NDW is momentum, which is a comparison between a short-term moving average versus a longer-term moving average. Recently, we've seen the monthly momentum of the S&P 500 Index (SPX) flip from negative to positive, along with many other US equities. Today, we'll discuss where these changes have been taking place and provide a list of actionable stocks that have experienced a flip to positive monthly momentum.
Today's featured stock is Xcel Energy Inc (XCEL).
CGNX, EYE, IIVI, NVDA, STAA, SYNH, TER, THO, TKR & VCEL.
Call: Astrazeneca (AZN); Put: Cigna Corp (CI); Covered Write: Hanesbrands (HBI).
If you are interested in ESG investing and would like to give us some feedback on your preferences, etc. to improve the NDW Research Platform offering, please email sara.mehle@dorseywright.com. Thanks in advance!
Replay Available for Mid-Year Market Outlook Webinar: In case you missed the Mid-Year Market Outlook webinar this past Wednesday, July 29th, we now have the replay and slides available on demand. This webinar featured an in-depth discussion between John Lewis, Jay Gragnani, Jamie West, and Chuck Fuller. Please see the links below for further information.
Monday Market Update Webinar Replay: Missed Monday's (8/3) webcast? Click the link(s) below for a recap:
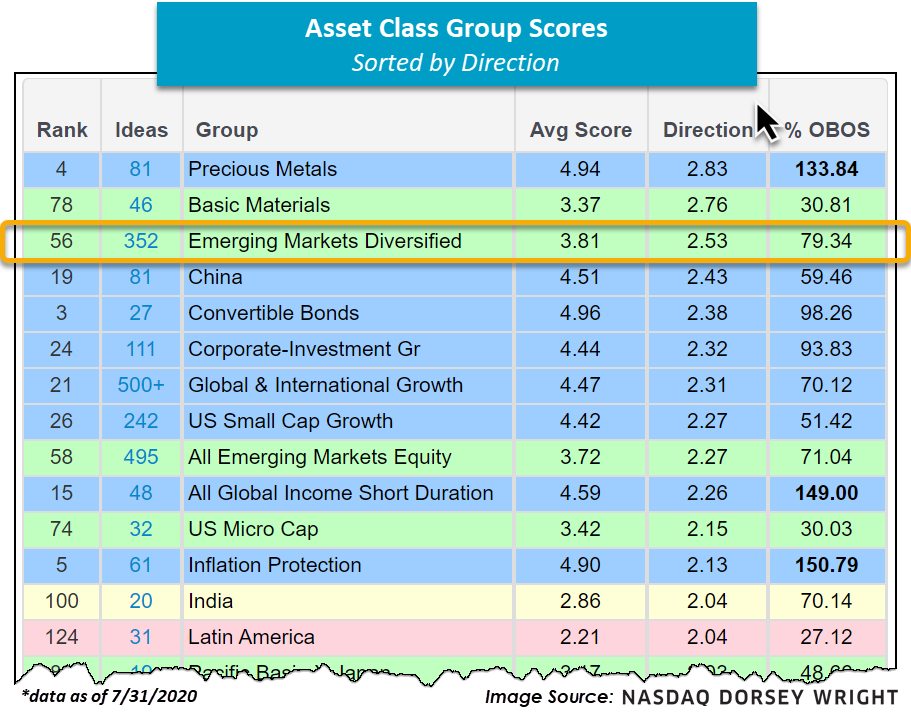
Odds and Ends: New Index Highs, Model Updates, and Emerging Markets

One technical characteristic that we monitor at NDW is momentum, which is simply a comparison between a short-term moving average versus a longer-term moving average. We track three types of momentum - daily, weekly, and monthly - and we do this for all stocks, ETFs, mutual funds, indices, and commodities. The daily momentum is a very short-term trading tool, while weekly momentum is used to help time trades, as it is an intermediate-term measure of strength. Generally speaking, though, it is the longer-term monthly momentum that allows us to identify trends in price movement, or at least the potential for these trends to develop. Recently, we've seen the monthly momentum for the S&P 500 Index SPX flip positive after having been negative for the five months prior, along with many other US equities. Today, we'll discuss where these changes have been taking place and provide a list of actionable stocks that have experienced a flip to positive monthly momentum.
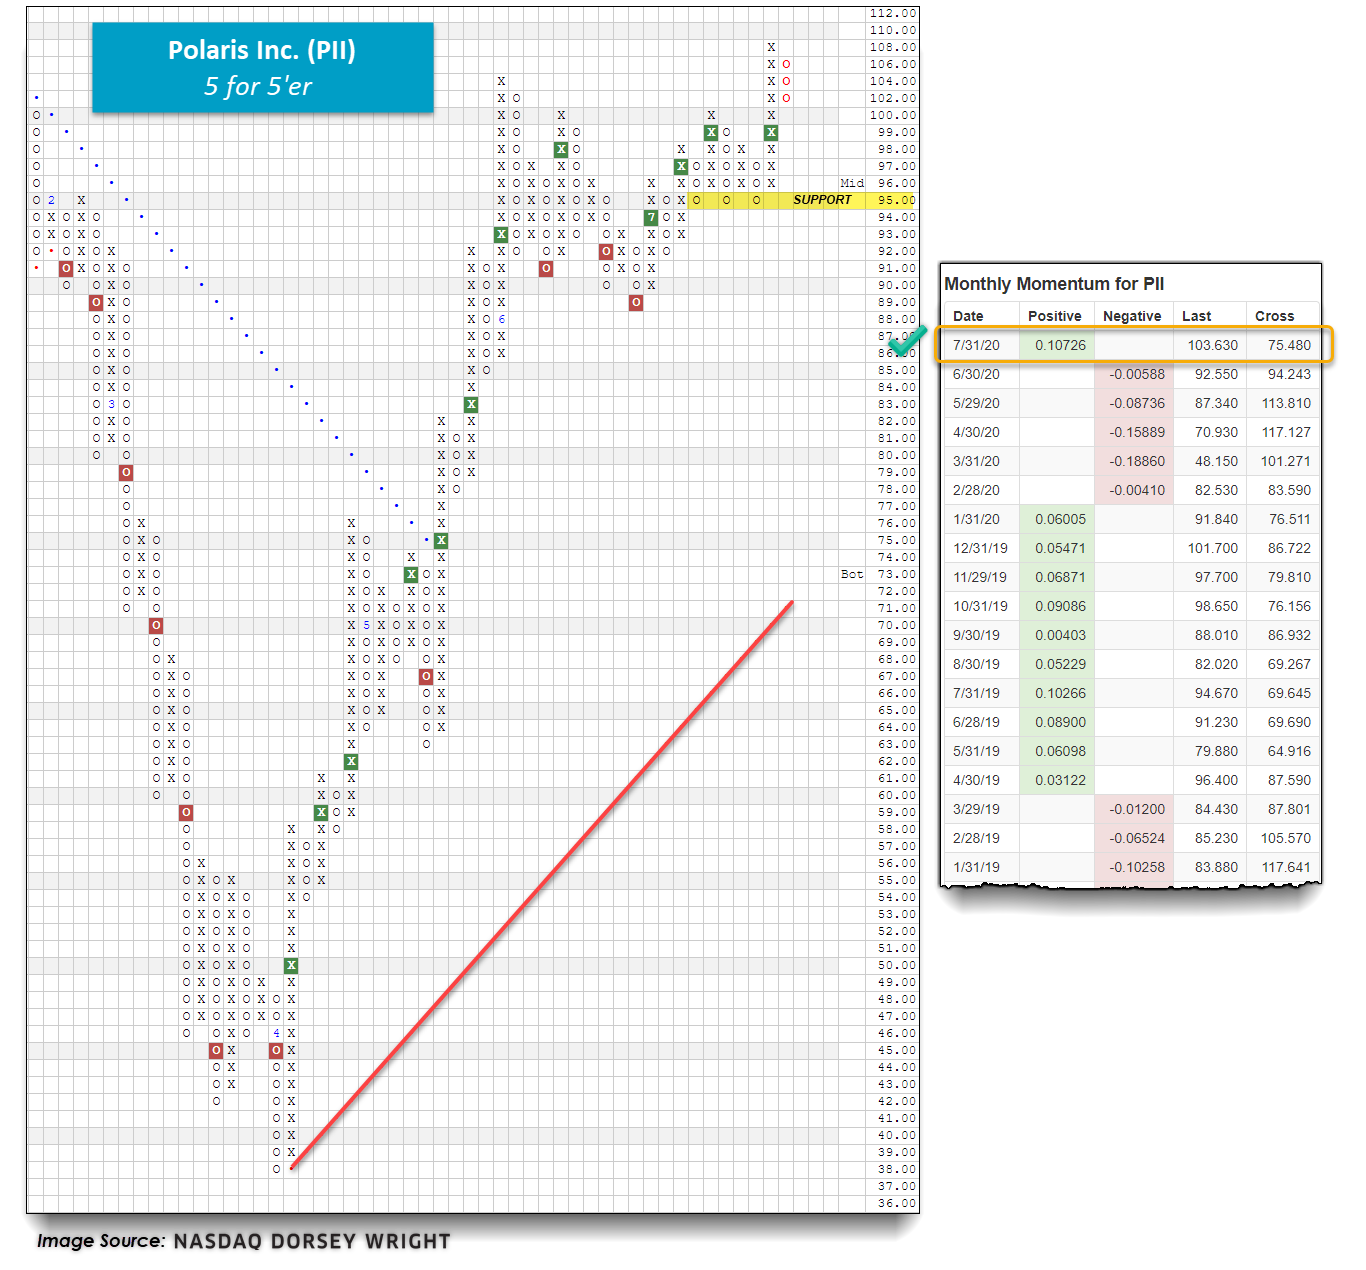
Specifically, the monthly momentum calculation looks at the one-month moving average relative to the five-month moving average for a given investment (the moving average is also exponentially weighted and smoothed). Generally speaking, when the one-month moving average crosses above the five-month, we say the monthly momentum is (has turned) positive, which suggests a period of strength in the stock. When the one-month moving average crosses below the five-month, we say the monthly momentum is negative, suggesting a period of weakness for the security in question. Click on the monthly momentum reading located on the top of each trend chart (shown in the image below) to see historical moving averages/cross points and monthly momentum readings.

Monthly Momentum Points:
Momentum calculations are used as a supplement and not as a substitution for the Point & Figure chart. When we get down to evaluating the individual stock chart, the three most essential parts are relative strength, overall trend, and individual Point & Figure patterns. Once we have determined that those three things are positive, we can then look towards some of the secondary tools, like monthly momentum, as a helpful guide. In other words, just because the monthly momentum may be on the verge of turning positive or negative -- that fact, in and of itself, does not change our opinion of a stock. If you are holding a stock that has experienced a huge run and is now beginning to break down and monthly momentum has turned negative, it would suggest that you may want to take some defensive action on that position. As another example, say you have a stock that has been trading sideways. At the same time, the overall market has experienced a correction, and the stock's monthly momentum is now turning back to positive. Because of this positive divergence from the broader market, we would consider purchasing this stock.
All in all, though, we do like to stay abreast of recent changes in monthly momentum, as it can be a confirming alert to take action, either protectively or in allocating new funds. To that end, we have screened our database of stocks to find out which stocks have just seen their monthly momentum turn back to positive. In doing this exercise, we focused on the S&P 1500 universe of stocks. Below is a quick snapshot of some of the technical characteristics for those 327 stocks that have just experienced a flip to positive monthly momentum.
S&P 1500 Stocks with One Month Positive Monthly Momentum Characteristics:
As of Monday, August 3, there are 327 stocks from the S&P 1500 universe that have recently experienced a flip to positive monthly momentum. Many of these names are not technically sound; however, they may make good tax-loss selling bounce plays. If you are looking for high RS names, you'll need to filter out some of the weaker names from the list. The easiest way to do this is by using the Security Screener tool under the "Security Selection" menu. We saved the 327 stocks from our initial monthly momentum screen as a custom portfolio using the NDW Shuttle tool and then selected it as our starting universe. We then applied the filters listed below to whittle our list down to 29 ideas. These 29 stocks are all trading in a positive trend and have given at least two consecutive buy signals, showing follow-through to the upside similar to the S&P 500 Index. Be sure to consult the trend chart on any given name to determine a more refined entry point, especially since several of the names are heavily overbought. Below the table of our results, we've highlighted two stocks from our list that we found particularly interesting and actionable.
Actionable Ideas Criteria:
| Symbol | Name | Price | Tech Attrib/Score | DWA Sector | Overbought/Oversold | ||
|---|---|---|---|---|---|---|---|
| AAN | Aaron's, Inc. | 52.18 |
3 |
Retailing |
|
||
| ACN | Accenture PLC | 224.78 |
5 |
Business Products |
|
||
| AEL | American Equity Investment Life Holding | 25.45 |
4 |
Insurance |
|
||
| AJG | Arthur J. Gallagher & Co. | 107.49 |
5 |
Insurance |
|
||
| AMD | Advanced Micro Devices, Inc. | 77.43 |
5 |
Semiconductors |
|
||
| AMP | Ameriprise Financial | 153.63 |
4 |
Finance |
|
||
| CMC | Commercial Metals Corporation | 20.68 |
4 |
Steel/Iron |
|
||
| CROX | Crocs, Inc. | 35.94 |
4 |
Textiles/Apparel |
|
||
| DKS | Dick's Sporting Goods, Inc. | 45.62 |
4 |
Retailing |
|
||
| FUL | H.B. Fuller Company | 45.34 |
4 |
Chemicals |
|
||
| GBX | The Greenbrier Companies, Inc. | 25.73 |
3 |
Transports/Non Air |
|
||
| GLW | Corning Incorporated | 31.00 |
3 |
Telephone |
|
||
| GTLS | Chart Industries, Inc. | 68.53 |
5 |
Oil Service |
|
||
| LIN | Linde Plc | 245.11 |
5 |
Chemicals |
|
||
| LPSN | LivePerson, Inc. | 42.98 |
4 |
Computers |
|
||
| LPX | Louisiana-Pacific Corporation | 31.67 |
5 |
Forest Prods/Paper |
|
||
| MS | Morgan Stanley | 48.88 |
5 |
Wall Street |
|
||
| NEO | NeoGenomics, Inc. | 38.23 |
5 |
Biomedics/Genetics |
|
||
| PII | Polaris Inc. | 103.63 |
5 |
Leisure |
|
||
| PLD | ProLogis | 105.42 |
5 |
Real Estate |
|
||
| RH | RH | 287.43 |
5 |
Retailing |
|
||
| SAH | Sonic Automotive Inc. | 38.12 |
5 |
Retailing |
|
||
| SWK | Stanley Black & Decker, Inc. | 153.32 |
3 |
Machinery and Tools |
|
||
| SWKS | Skyworks Solutions, Inc. | 145.58 |
4 |
Semiconductors |
|
||
| TRMB | Trimble Inc. | 44.51 |
3 |
Telephone |
|
||
| URI | United Rentals, Inc. | 155.37 |
5 |
Machinery and Tools |
|
||
| VVV | Valvoline Inc | 20.52 |
4 |
Autos and Parts |
|
||
| WOR | Worthington Industries, Inc. | 37.42 |
3 |
Steel/Iron |
|
||
| ZTS | Zoetis Inc. | 151.68 |
4 |
Drugs |
|
PII Polaris Inc. ($105.18) - Leisure – PII is a perfect 5 for 5'er in the leisure sector as all of its trending and relative strength metrics are currently positive, making this stock a high attribute name. After returning to a buy signal at $94 in July, PII went on to give a total of four consecutive buy signals, confirming that demand is in control. After reaching a new 52-week high at $108, PII experienced a pullback with Friday's market action to $102 and remains well above initial support at $95. Monthly momentum just flipped positive after having been negative for the previous five months. Additionally, weekly momentum also flipped positive, adding to the favorable technical picture. The weight of the evidence is positive, and PII has an OBSO% reading of just 34%, making this stock actionable at current levels. From here, initial support sits at $95, while a move to $110 would mark the fifth consecutive buy signal on the chart. Note PII provides a yield of 2.39%.
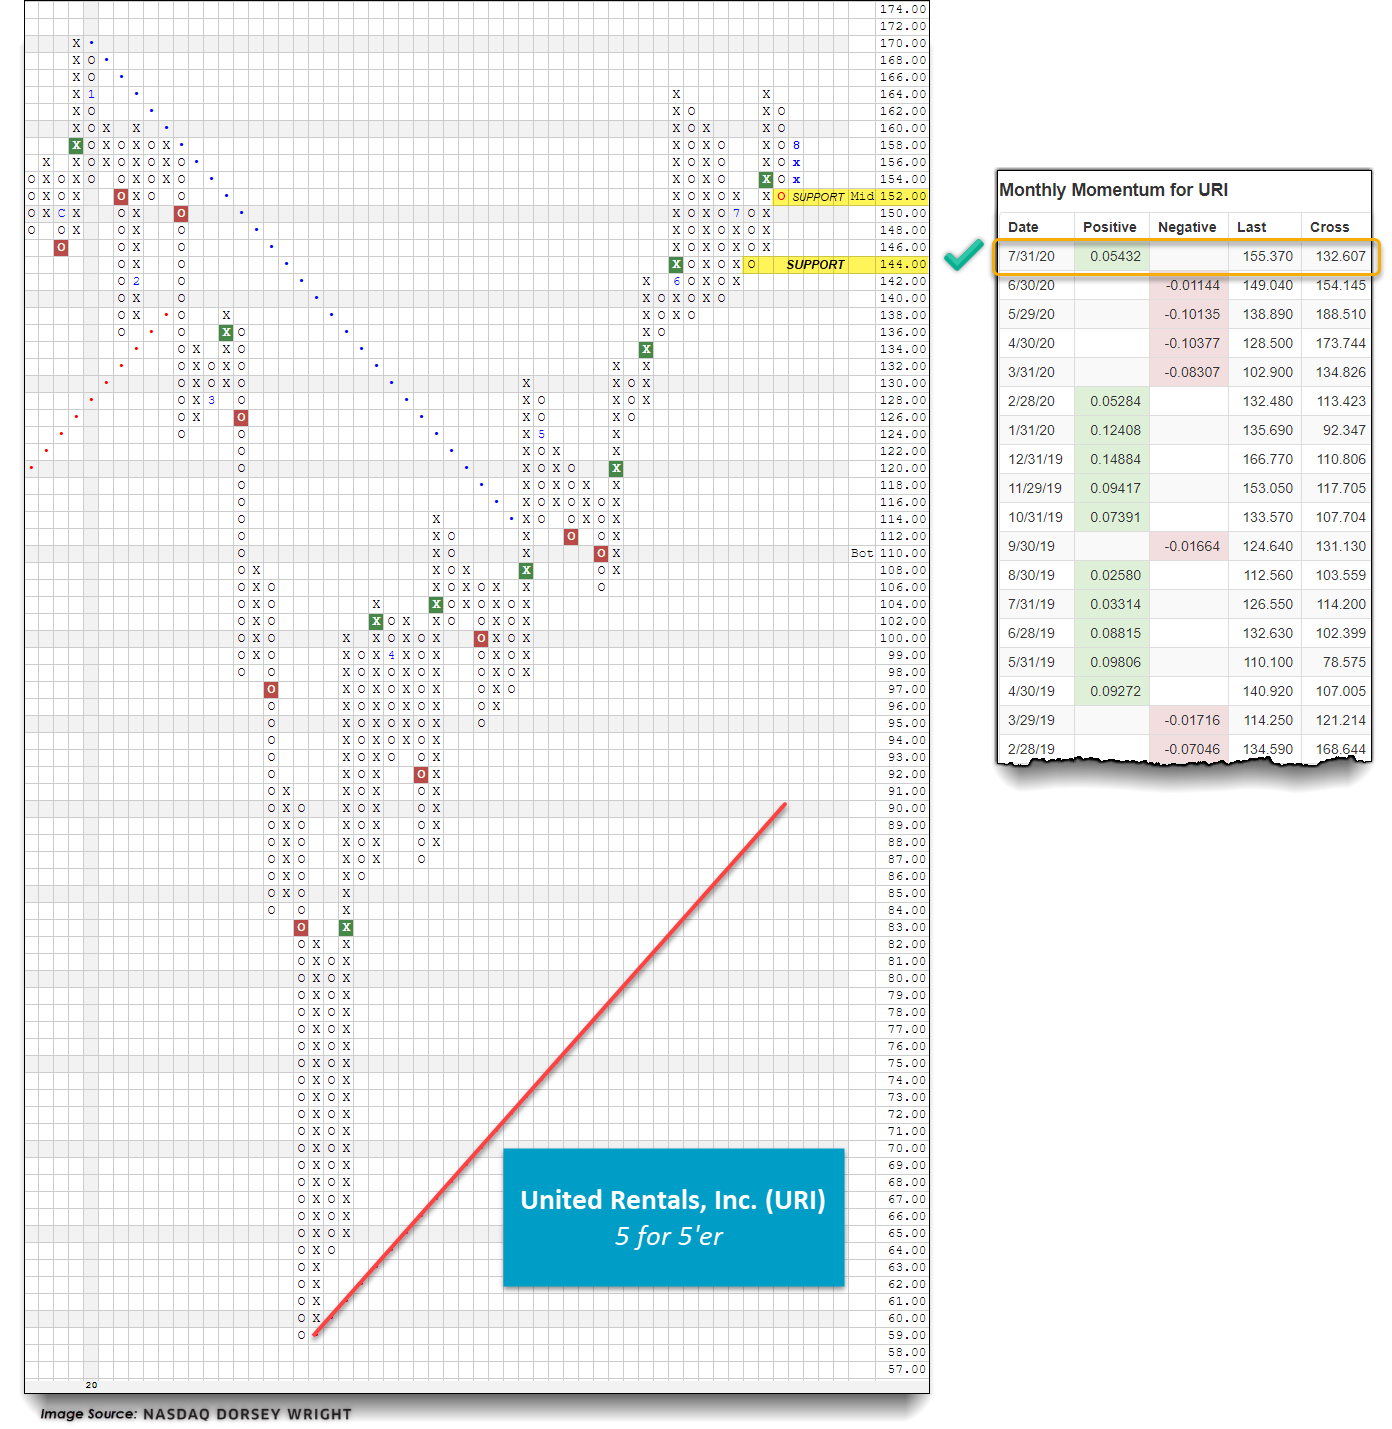
URI United Rentals, Inc. ($158.35) - Machinery and Tools – URI is one of the more attractive and actionable stocks that came across our high-RS positive monthly momentum screen. Similar to PII, this stock is a perfect 5 for 5'er as all of its trending and RS characteristics are positive here. Furthermore, URI ranks in the top 20% of the favored machinery and tools sector RS matrix. In May, URI returned to a buy signal at $120 before giving a total of four consecutive buy signals. The last buy signal that occurred was a bullish triangle in mid-July, which was followed by a rally to resistance at $164. After a brief pullback, URI has reversed back up into a column of X's with today's market action, putting the stock just four boxes from completing a spread triple top buy signal at $166. Monthly momentum just flipped positive after having spent the last four months on the negative side, suggesting the potential for higher prices. Demand is in control, making new positions welcome here as URI is just 5% overbought. From here, initial support sits at $152 while overhead resistance lies at $164.
Average Level
37.82
| AGG | iShares US Core Bond ETF |
| USO | United States Oil Fund |
| DIA | SPDR Dow Jones Industrial Average ETF |
| DVY | iShares Dow Jones Select Dividend Index ETF |
| DX/Y | NYCE U.S.Dollar Index Spot |
| EFA | iShares MSCI EAFE ETF |
| FXE | Invesco CurrencyShares Euro Trust |
| GLD | SPDR Gold Trust |
| GSG | iShares S&P GSCI Commodity-Indexed Trust |
| HYG | iShares iBoxx $ High Yield Corporate Bond ETF |
| ICF | iShares Cohen & Steers Realty ETF |
| IEF | iShares Barclays 7-10 Yr. Tres. Bond ETF |
| LQD | iShares iBoxx $ Investment Grade Corp. Bond ETF |
| IJH | iShares S&P 400 MidCap Index Fund |
| ONEQ | Fidelity Nasdaq Composite Index Track |
| QQQ | Invesco QQQ Trust |
| RSP | Invesco S&P 500 Equal Weight ETF |
| IWM | iShares Russell 2000 Index ETF |
| SHY | iShares Barclays 1-3 Year Tres. Bond ETF |
| IJR | iShares S&P 600 SmallCap Index Fund |
| SPY | SPDR S&P 500 Index ETF Trust |
| TLT | iShares Barclays 20+ Year Treasury Bond ETF |
| GCC | WisdomTree Continuous Commodity Index Fund |
| VOOG | Vanguard S&P 500 Growth ETF |
| VOOV | Vanguard S&P 500 Value ETF |
| EEM | iShares MSCI Emerging Markets ETF |
| XLG | Invesco S&P 500 Top 50 ETF |

| Symbol | Company | Sector | Current Price | Action Price | Target | Stop | Notes |
|---|---|---|---|---|---|---|---|
| MBUU | Malibu Boats Inc. | Leisure | $58.78 | low $50s to low $60s | $71 | $44 | 5 for 5'er, LT peer RS buy signal, pos mon mom, fav DWALEIS Earnings 8/27 |
| NAV | Navistar International Corporation | Autos and Parts | $32.03 | high $20s to low $30s | $42 | $25 | 4 for 5'er, top 25% of DWAAUTO, consec buy signals, |
| ZTS | Zoetis Inc. | Drugs | $151.68 | 140s - low 150s | 166 | 118 | 4 for 5'er, top half of DRUG sector matrix, multi consec buys, pos wkly mom flip Earnings expected 8/6 |
| ADSK | Autodesk, Inc. | Software | $236.43 | $230s to low $260s | $292 | $192 | 5 for 5'er, consec buy signals, pullback from AT high, top 1/3rd of DWASOFT, pos mon mom, LT market RS buy Earnings 8/25 |
| MSFT | Microsoft Corporation | Software | $205.01 | hi 190s - low 210s | 264 | 164 | 4 for 5'er, top half of favored SOFT sector matrix, multi consec buys, pullback from ATH |
| PAGS | PagSeguro Digital Ltd. Class A | Business Products | $38.23 | hi 30s - low 40s | 53 | 33 | 5 for 5'er, #5 of 100 names in favored BUSI sector matrix, triple top breakout, pos monthly mom flip, |
| BLK | BlackRock, Inc. | Wall Street | $575.01 | mid 530s - low 600s | $680 | $448 | 4 for 5'er, pullback from ATH, consec buy signals, pos weekly & mon mom, 2.52% yield |
| SNPS | Synopsys Inc | Software | $199.22 | mid 190s to low 210s | 228 | 162 | 5 for 5'er, consec buy signals, pullback from ATH, pos mon mom, LT market RS buy signal Earnings 8/19 |
| MS | Morgan Stanley | Wall Street | $48.88 | hi 40s - low 50s | 70 | 43 | 5 for 5'er, top quartile of WALL sector matrix, LT pos mkt RS, 2.9% yield, good R-R |
| XEL | Xcel Energy, Inc. | Utilities/Electricity | $69.04 | mid 60s to low 70s | 84 | 59 | 4 for 5'er, top 25% of EUTI sector matrix, spread quintuple top, pos mon mom flip, 2.5% yield |
| Symbol | Company | Sector | Current Price | Action Price | Target | Stop | Notes |
|---|---|---|---|---|---|---|---|
| SMAR | Smartsheet, Inc. Class A | Software | $47.74 | upper to mid 40s | 27 | 55 | 1 for 5'er, 112 of 113 names in SOFT sector matrix, multiple sells, neg wkly and mnthly mom flips, good R-R |
| Comment |
|---|
| NVDA NVIDIA Corporation R ($438.49) - Semiconductors - We will now raise our stop to $388 a potential spread triple bottom break on NVDA's default chart. |
| HSBC HSBC Holding PLC R (United Kingdom) ADR ($21.73) - Banks - We will now lower our buy stop to $23.75, the first potential buy signal on HSBC's default chart. |
| ZTS Zoetis Inc. R ($154.78) - Drugs - ZTS has moved above the ideal action range. OK to hold here. Raise stop to $128, the second potential sell signal on ZTS's default chart. Earnings are expected on 8/6. |
XEL Xcel Energy, Inc. R ($68.76) - Utilities/Electricity - XEL is a 4 for 5'er that ranks in the top quartile of the utilities/electricity sector matrix. XEL recently took out notable resistance when it broke a spread quintuple top at $68. Meanwhile, a recent flip to positive monthly momentum is a positive sign for XEL's potential for additional upside. The stock also comes with a 2.5% yield. Long exposure may be added in the mid $60s to low $70s and we will set our initial stop at $59, the potential trend line violation on XEL's default chart. We will use the bullish price objective of $84 as our target price.
| 10 | 12 | 13 | 14 | 16 | 17 | 18 | 19 | 20 | |||||||||||||||||||||||||||||||||||||||||||||
| 72.00 | X | • | 72.00 | ||||||||||||||||||||||||||||||||||||||||||||||||||
| 71.00 | X | O | • | • | 71.00 | ||||||||||||||||||||||||||||||||||||||||||||||||
| 70.00 | 2 | O | X | • | X | • | 70.00 | ||||||||||||||||||||||||||||||||||||||||||||||
| 69.00 | X | O | X | O | X | O | • | X | 69.00 | ||||||||||||||||||||||||||||||||||||||||||||
| 68.00 | X | O | X | O | X | O | • | X | 68.00 | ||||||||||||||||||||||||||||||||||||||||||||
| 67.00 | X | O | X | O | X | O | X | • | X | X | X | X | 67.00 | ||||||||||||||||||||||||||||||||||||||||
| 66.00 | X | X | O | X | O | O | X | O | • | X | O | X | O | 6 | O | X | 66.00 | ||||||||||||||||||||||||||||||||||||
| 65.00 | 9 | O | 1 | O | 3 | O | X | O | • | X | O | X | O | X | O | 7 | Mid | 65.00 | |||||||||||||||||||||||||||||||||||
| 64.00 | X | O | X | O | X | O | X | O | • | X | O | X | O | X | O | X | 64.00 | ||||||||||||||||||||||||||||||||||||
| 63.00 | X | O | C | O | X | O | X | O | X | • | X | O | 5 | X | O | X | 63.00 | ||||||||||||||||||||||||||||||||||||
| 62.00 | 7 | X | B | X | O | O | X | O | X | X | O | • | X | X | O | X | O | 62.00 | |||||||||||||||||||||||||||||||||||
| 61.00 | X | O | X | O | X | O | X | O | X | O | X | O | X | X | O | X | O | X | 61.00 | ||||||||||||||||||||||||||||||||||
| 60.00 | 6 | O | X | O | O | O | X | O | X | O | X | O | X | O | X | O | X | 60.00 | |||||||||||||||||||||||||||||||||||
| 59.00 | X | 8 | O | X | O | X | 4 | X | O | X | O | O | X | • | 59.00 | ||||||||||||||||||||||||||||||||||||||
| 58.00 | 5 | O | O | X | O | X | O | O | X | • | 58.00 | ||||||||||||||||||||||||||||||||||||||||||
| 57.00 | X | O | X | O | O | • | 57.00 | ||||||||||||||||||||||||||||||||||||||||||||||
| 56.00 | 3 | O | X | • | Bot | 56.00 | |||||||||||||||||||||||||||||||||||||||||||||||
| 55.00 | X | O | X | • | 55.00 | ||||||||||||||||||||||||||||||||||||||||||||||||
| 54.00 | X | X | O | X | • | 54.00 | |||||||||||||||||||||||||||||||||||||||||||||||
| 53.00 | C | O | 2 | O | X | • | 53.00 | ||||||||||||||||||||||||||||||||||||||||||||||
| 52.00 | X | X | O | X | O | X | • | 52.00 | |||||||||||||||||||||||||||||||||||||||||||||
| 51.00 | X | O | B | O | X | O | X | • | 51.00 | ||||||||||||||||||||||||||||||||||||||||||||
| 50.00 | 9 | B | O | A | O | X | O | X | • | 50.00 | |||||||||||||||||||||||||||||||||||||||||||
| 49.00 | 8 | O | X | C | 9 | O | X | O | X | • | 49.00 | ||||||||||||||||||||||||||||||||||||||||||
| 48.00 | X | O | X | O | 8 | 1 | • | O | X | • | 48.00 | ||||||||||||||||||||||||||||||||||||||||||
| 47.00 | X | O | 1 | X | 7 | • | O | • | 47.00 | ||||||||||||||||||||||||||||||||||||||||||||
| 46.00 | 5 | O | 4 | O | X | • | • | 46.00 | |||||||||||||||||||||||||||||||||||||||||||||
| 45.00 | 7 | X | O | 3 | O | X | • | 45.00 | |||||||||||||||||||||||||||||||||||||||||||||
| 44.00 | X | O | 3 | 2 | X | 5 | X | • | 44.00 | ||||||||||||||||||||||||||||||||||||||||||||
| 43.00 | X | O | X | O | X | 6 | X | • | 43.00 | ||||||||||||||||||||||||||||||||||||||||||||
| 42.00 | 4 | 6 | 8 | 2 | O | O | • | 42.00 | |||||||||||||||||||||||||||||||||||||||||||||
| 41.00 | 3 | O | X | 9 | C | • | 41.00 | ||||||||||||||||||||||||||||||||||||||||||||||
| 40.00 | X | O | X | A | X | • | 40.00 | ||||||||||||||||||||||||||||||||||||||||||||||
| 39.00 | 2 | O | B | X | • | 39.00 | |||||||||||||||||||||||||||||||||||||||||||||||
| 38.00 | 1 | 1 | O | • | 38.00 | ||||||||||||||||||||||||||||||||||||||||||||||||
| 37.00 | X | O | X | • | 37.00 | ||||||||||||||||||||||||||||||||||||||||||||||||
| 36.00 | X | O | 8 | A | • | 36.00 | |||||||||||||||||||||||||||||||||||||||||||||||
| 35.00 | C | 2 | 7 | O | X | • | 35.00 | ||||||||||||||||||||||||||||||||||||||||||||||
| 34.00 | B | 3 | X | O | X | • | 34.00 | ||||||||||||||||||||||||||||||||||||||||||||||
| 33.00 | A | 5 | X | O | • | 33.00 | |||||||||||||||||||||||||||||||||||||||||||||||
| 32.00 | X | 6 | • | 32.00 | |||||||||||||||||||||||||||||||||||||||||||||||||
| 31.00 | X | 4 | • | 31.00 | |||||||||||||||||||||||||||||||||||||||||||||||||
| 30.00 | 4 | O | 2 | • | 30.00 | ||||||||||||||||||||||||||||||||||||||||||||||||
| 29.00 | 6 | 3 | O | X | • | 29.00 | |||||||||||||||||||||||||||||||||||||||||||||||
| 28.00 | 5 | O | X | 6 | X | • | 28.00 | ||||||||||||||||||||||||||||||||||||||||||||||
| 27.00 | C | O | X | 9 | • | 27.00 | |||||||||||||||||||||||||||||||||||||||||||||||
| 26.00 | A | B | • | 26.00 | |||||||||||||||||||||||||||||||||||||||||||||||||
| 25.00 | 5 | 9 | • | 25.00 | |||||||||||||||||||||||||||||||||||||||||||||||||
| 24.00 | A | O | X | • | 24.00 | ||||||||||||||||||||||||||||||||||||||||||||||||
| 23.00 | 7 | O | X | • | 23.00 | ||||||||||||||||||||||||||||||||||||||||||||||||
| 22.00 | 4 | 8 | • | 22.00 | |||||||||||||||||||||||||||||||||||||||||||||||||
| 21.00 | C | • | 21.00 | ||||||||||||||||||||||||||||||||||||||||||||||||||
| 20.00 | X | • | 20.00 | ||||||||||||||||||||||||||||||||||||||||||||||||||
| 19.50 | X | • | 19.50 | ||||||||||||||||||||||||||||||||||||||||||||||||||
| 19.00 | • | 7 | • | 19.00 | |||||||||||||||||||||||||||||||||||||||||||||||||
| 18.50 | X | • | 6 | • | 18.50 | ||||||||||||||||||||||||||||||||||||||||||||||||
| 18.00 | X | O | X | • | 18.00 | ||||||||||||||||||||||||||||||||||||||||||||||||
| 17.50 | X | O | X | • | 17.50 | ||||||||||||||||||||||||||||||||||||||||||||||||
| 17.00 | X | 5 | • | 17.00 | |||||||||||||||||||||||||||||||||||||||||||||||||
| 10 | 12 | 13 | 14 | 16 | 17 | 18 | 19 | 20 |
| CGNX Cognex Corp ($66.13) - Computers - CGNX pushed higher intraday to break a double top at $67 and give a third consecutive buy signal. The 4 for 5'er ranks 12th out of 40 names in the favored computers stock sector matrix and recently returned to a positive trend and RS buy signal versus the market. Furthermore, monthly momentum just flipped positive, suggesting the potential for additional upside. Demand is in control. Initial support is offered at $63. |
| EYE National Vision Holdings, Inc. ($32.85) - Retailing - Shares of EYE moved higher Monday to complete a bullish triangle pattern at $33. This 3 for 5'er moved to a positive trend in May and ranks in the top half of the favored retailing sector RS matrix. The weight of the evidence continues to improve. Exposure may be considered at current levels, with initial support found at $28. Further support can be found at $27 and $26. Note that the stock is currently at overhead resistance from June, and has earnings expected on 8/6. |
| IIVI Ii VI Inc Two Six Inc ($51.60) - Electronics - Shares of IIVI returned to a buy signal on Monday with a triple top break at $52, now residing just one box away from matching its all-time chart high in January of 2018. The 5 for 5'er reentered a positive trend in April of this year and recently returned to an RS buy signal versus the market in March, demonstrating favorable absolute and relative strength, respectively. In addition, weekly momentum just flipped positive, indicating the potential for further upside. Demand is in control. Further bullish confirmation would come with a move past $53 while initial support is offered at $43. Note earnings are expected on August 13th. |
| NVDA NVIDIA Corporation ($441.05) - Semiconductors - Shares of NVDA advanced Monday to break a spread triple top at $432 before reaching a new all-time high at $440 intraday. This 5 for 5'er moved to a positive trend in April and ranks 10th out of 64 names in the favored semiconductors RS matrix. The stock has also maintained an RS buy signal against the market since mid-2016. The technical picture remains positive and continues to improve. Those looking to add exposure may consider the stock at current levels, with initial support offered at $392. Note that earnings are expected on 8/13. |
| STAA Staar Surgical Company ($60.90) - Healthcare - STAA rose Monday to break a double top at $60 before pushing higher to $61 intraday. This 5 for 5'er moved to a positive trend in April and ranks 3rd out of 120 names in the favored healthcare sector RS matrix. The technical picture remains strong. Initial support can be found at $54, with the potential for further overhead resistance coming at the all-time high of $62 from July. Note that earnings are expected on 8/5. |
| SYNH Syneos Health Inc. ($64.60) - Biomedics/Genetics - SYNH moved higher to give a fourth consecutive buy signal Monday at $64. This 5 for 5'er ranks in the top half of the biomedics/genetics sector RS matrix and moved to a positive trend in May. Weekly momentum also recently flipped positive, suggesting the potential for further upside from here. Exposure may be considered at current levels, or upon movement past further resistance, which would come at $65. Initial support may be found at $60, with multiple additional support offered in the $56-$51 range. Note that earnings are expected on 8/6. |
| TER Teradyne, Inc. ($90.38) - Semiconductors - TER advanced Monday to break a triple top at $91, marking a new multi-year high. This 5 for 5'er moved to a positive trend in April and ranks in the top third of the favored semiconductors sector RS matrix. The overall technical picture is strong and continues to improve. Those looking to add exposure may consider the stock at current levels. Initial support is offered at $83, with further support found at $81. |
| THO Thor Industries, Inc. ($120.30) - Leisure - Shares of THO sharply reversed up into a column of Xs on Monday to break a quadruple top at $120, returning the stock to a buy signal. The 5 for 5'er ranks fifth out of 48 names in the leisure stock sector matrix and returned to an RS buy signal versus the market in February of this year, demonstrating favorable relative strength. Furthermore, THO reentered a positive trend in April, affirming absolute strength. Demand is in control. The next level of resistance resides at $126 while initial support is offered around $112. Note THO also offers a yield of 1.4%. |
| TKR The Timken Company ($49.85) - Machinery and Tools - Shares of TKR reversed up into a column of Xs following their Monday morning earnings release and broke a double top at $49, before pushing through further resistance to $50 intraday. This 3 for 5'er moved to a positive trend in late-May and ranks in the top half of the favored machinery and tools sector RS matrix. The stock also carries a 2.45% yield. Exposure may be considered at current levels, with initial support found at $45 and further support found at $42. The bullish support line is also currently found at $41. |
| VCEL Vericel Corp ($17.23) - Biomedics/Genetics - VCEL continued higher Monday to break a double top at $17. This 3 for 5'er moved to a positive trend in July and ranks in the top quartile of the biomedics/genetics sector RS matrix. Weekly and monthly momentum are also each positive, suggesting the potential for further upside from here. Initial support is offered at $15 with further support found at $13. The bullish support line is also currently positioned at $12. Note that earnings are expected on 8/5. |

| Name | Option Symbol | Action | Stop Loss |
|---|---|---|---|
| Astrazeneca Group PLC Ads (United Kingdom) ADR - $56.82 | O: 21A55.00D15 | Buy the January 55.00 calls at 6.50 | 51.00 |
| Name | Option | Action |
|---|---|---|
| Agilent Technologies, Inc ( A) | Nov. 85.00 Calls | Raise the option stop loss to 13.80 (CP: 15.80) |
| Lowe's Companies, Inc. ( LOW) | Sep. 130.00 Calls | Raise the option stop loss to 19.80 (CP: 21.80) |
| Applied Materials, Inc. ( AMAT) | Oct. 55.00 Calls | Initiate an option stop loss of 5.55 (CP: 7.55) |
| Fastenal Company ( FAST) | Nov. 40.00 Calls | Raise the option stop loss to 6.10 (CP: 8.10) |
| Salesforce.com, Inc. ( CRM) | Nov. 180.00 Calls | Initiate an option stop loss of 27.75 (CP: 29.75) |
| Lennar Corporation ( LEN) | Nov. 65.00 Calls | Raise the option stop loss to 10.40 (CP: 12.40) |
| Best Buy Co., Inc. ( BBY) | Oct. 85.00 Calls | Raise the option stop loss to 13.75 (CP: 15.75) |
| Microsoft Corporation ( MSFT) | Nov. 200.00 Calls | Initiate an option stop loss of 23.65 (CP: 25.65) |
| Name | Option Symbol | Action | Stop Loss |
|---|---|---|---|
| CIGNA Corporation - $173.00 | O: 21M175.00D15 | Buy the January 175.00 puts at 19.30 | 186.00 |
| Name | Option | Action |
|---|---|---|
| HealthEquity, Inc. (HQY) | Dec. 60.00 Puts | Raise the option stop loss to 10.30 (CP: 12.30) |
| CIGNA Corporation (CI) | Oct. 180.00 Puts | Initiate an option stop loss of 12.60 (CP: 14.60) |
| Boston Properties (BXP) | Nov. 100.00 Puts | Initiate an option stop loss of 14.30 (CP: 16.30) |
| Name | Option Sym. | Call to Sell | Call Price | Investment for 500 Shares | Annual Called Rtn. | Annual Static Rtn. | Downside Protection |
|---|---|---|---|---|---|---|---|
| Hanesbrands, Inc. $14.13 | O: 21A15.00D15 | Jan. 15.00 | 1.60 | $6,439.60 | 33.97% | 24.75% | 10.06% |
| Name | Action |
|---|---|
| Chegg Inc (CHGG) - 80.97 | Sell the October 75.00 Calls. |
| Big Lots, Inc. (BIG) - 39.34 | Sell the October 42.50 Calls. |
| Fifth Third Bancorp (FITB) - 19.86 | Sell the November 19.00 Calls. |
| Chegg Inc (CHGG) - 80.97 | Sell the October 75.00 Calls. |
| JD.COM INC (JD) - 63.79 | Sell the October 65.00 Calls. |
| Morgan Stanley (MS) - 48.88 | Sell the January 52.50 Calls. |
| Williams-Sonoma, Inc. (WSM) - 87.12 | Sell the November 87.50 Calls. |
| Lennar Corporation (LEN) - 72.35 | Sell the November 75.00 Calls. |
| Akamai Technologies, Inc. (AKAM) - 112.44 | Sell the November 115.00 Calls. |
| Astrazeneca Group PLC Ads (United Kingdom) ADR (AZN) - 55.78 | Sell the January 57.50 Calls. |
| Name | Covered Write |
|---|---|
|
|
|
Daily Equity & Market Analysis
Loading, Please Wait...
