Odds and Ends: New Index Highs, Model Updates, and Emerging Markets
If you are interested in ESG investing and would like to give us some feedback on your preferences, etc. to improve the NDW Research Platform offering, please email sara.mehle@dorseywright.com. Thanks in advance!
Replay Available for Mid-Year Market Outlook Webinar: In case you missed the Mid-Year Market Outlook webinar this past Wednesday, July 29th, we now have the replay and slides available on demand. This webinar featured an in-depth discussion between John Lewis, Jay Gragnani, Jamie West, and Chuck Fuller. Please see the links below for further information.
Monday Market Update Webinar Replay: Missed Monday's (8/3) webcast? Click the link(s) below for a recap:
Odds and Ends: New Index Highs, Model Updates, and Emerging Markets
- Broad domestic equity indices began the week on a positive note, as the S&P 500 SPX, Dow Jones Industrial Average DJIA, and the Nasdaq Composite NASD appreciated 0.72%, 0.89%, and 1.47%, respectively. A few key developments on Monday being: SPX gapped over 3300 and the more concentrated Nasdaq 100 NDX hit another all-time chart high at 11,080.
- The end of July also marked an evaluation period for a suite of models housed on the Nasdaq Dorsey Wright (NDW) Research Platform, including new stock strategies like the NDW Large Cap Core, Blue Chip Growth, and NDX Model(s) along with monthly-evaluated FSM (Fund Score Method) models. If any changes occurred within these strategies the “Actions/Activity” column header on the models page will highlight a blue number, while those that have alerts setup should have also received an email. Note you can also click the “Trades” tab within a model to see historical purchases/sells with corresponding dates. For those following seasonal FSM models, evaluation occurs tonight (8/3) with changes (if applicable) going out tomorrow morning.
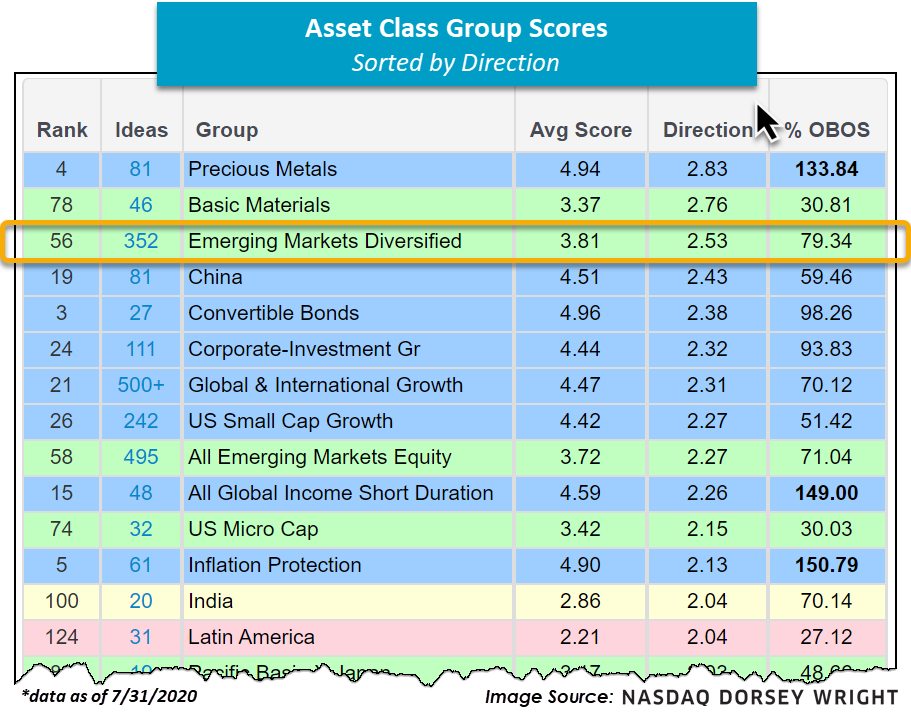
- In addition to domestic indices and model updates, the emerging markets group continues to rally. In fact, the Emerging Markets Diversified group on the Asset Class Group Scores (ACGS) page currently posts the third highest score direction out of all 135+ groups at 2.53. It is also worth mentioning that the group currently has an average score of 3.81, tenths away from the sought after “blue sky zone” on the ACGS page. For ideas within the space, simply click on the blue “352” located to the left of the group name. Those looking to be notified of further improvement in the Emerging Markets Diversified space can use the "Alerts" column on the right-hand side of the ACGS page.