
Most Requested Symbols

We examine several different markets to find out which are the most efficient and which are the least efficient. In order to get an idea of the level of efficiency, we will take a look at rolling five-year return rankings to see how several of the most well-known indices (representing passive management) have performed.
Social responsibility moved above the 4.00 average score threshold for the first time following market action Wednesday.
The average distribution reading is 39.42% overbought.
Today's featured stock is Malibu Boats Inc. (MBUU)
FDX, GRMN, LHCG, ODFL, PETS, PRAA, SAIA, SEE, SHW & WLK
Call: Mondelez International (MDLZ), Put: Ross Stores (ROST), Covered Write: eBay Inc. (EBAY)
Beginners Series Webinar - Join us on Friday, July 17th, at 2 PM (ET) for our NDW Beginners Series Webinar. This week's topic is Understanding the Asset Class Group Scores Page. Register here.
Mid -Year Market Review - Join the Nasdaq Dorsey Wright team as we discuss the volatile market movement through the first six months of the year and what to monitor in the second half of 2020. Click here to register.
Speakers include:
Models Workshop - The Investment Models Workshop is designed specifically for financial professionals looking to incorporate Nasdaq Dorsey Wright's (NDW) turnkey model solutions into their investment practice, as well as those who would just like to learn more. This three-hour virtual course will not only give you the chance to engage with experts from NDW, but will also expose you to new strategies, investment frameworks, and best practices for utilizing the NDW Research Platform to help you manage your business with more confidence, efficiency, and greater scale. Investments & Wealth Institute® has accepted the Nasdaq Dorsey Wright Investment Models Workshop for 3 hours of CE credit towards the CIMA®, CPWA®, CIMC®, and RMA certifications. Click here for more information.
Market Update Webinar Replay - Missed Monday's webcast? Click the link(s) below for a recap:
As highlighted in yesterday’s Were You Aware and Weekly DALI and US Equity Overview, a number of bullish percent indicators have experienced changes, indicating new levels of participation from individual equities across the various universes. Despite lowering levels witnessed across the tech-heavy Nasdaq 100 NDX, we find generally increased levels of participation from other major equity universes like the S&P 500 SPX, S&P 400 MID, as well as the S&P 600 SML.
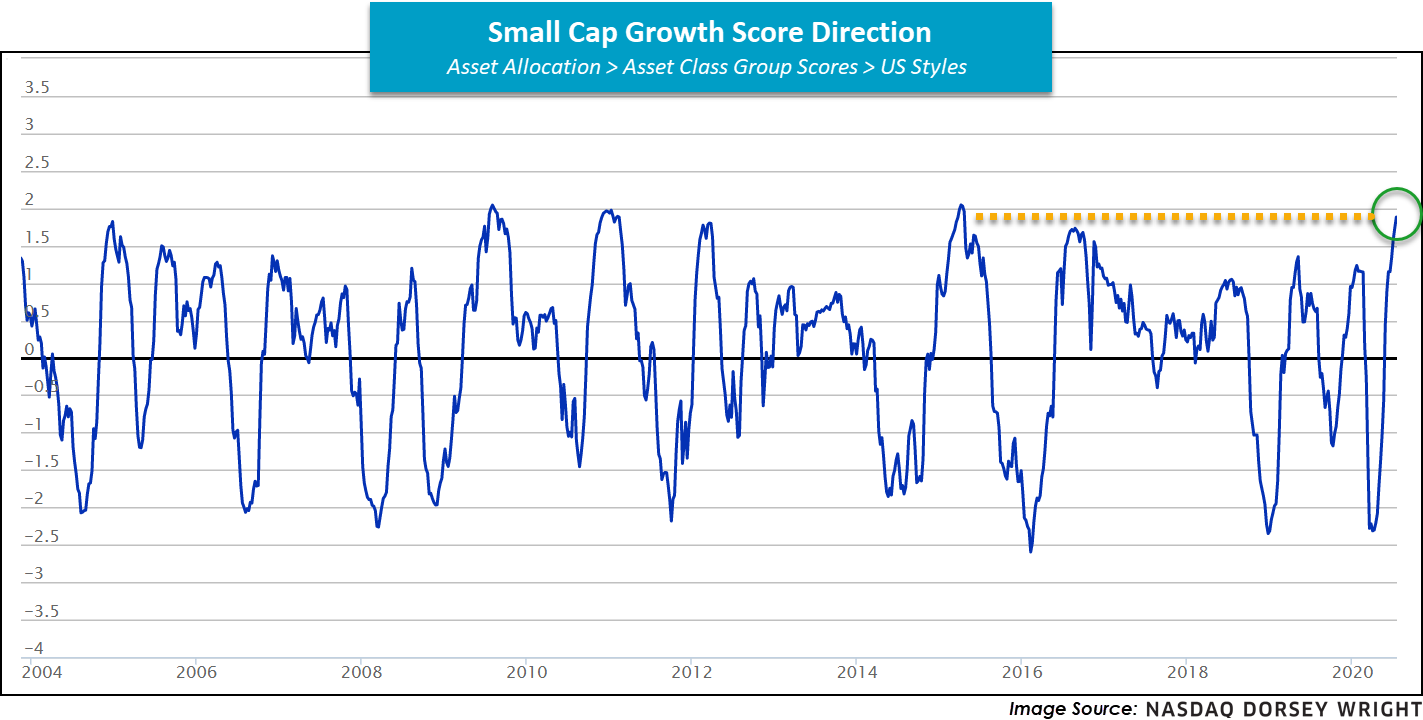
Building off yesterday’s Weekly DALI and US Equity Overview explicitly, although lagging in absolute terms on the year, small caps have picked up steam in recent months, especially the small cap growth camp. The Asset Class Group Scores (ACGS) page further quantifies this finding as the small cap growth group displays the highest score direction of all US Styles at 2.09, its strongest reading in over five years. Interestingly enough, when looking under the hood of the SPDR S&P 600 Small Cap ETF SLY, we notice a majority presence of value oriented names, likely contributing to the abysmal fund score of SLY at 0.90 given the persistent aggregate weakness in small value. Moreover, the average SLY stock has a technical attribute just above 2, below the sought after 3 threshold, further speaking to the refined/narrow leadership in the space. Point being, when it comes to small cap exposure, it is critical to know what you own!
Those looking to monitor the small growth/value story going forward may consider setting group score alerts on the ACGS page, column change notifications on BPSML, or on individual trend charts via Activity Alerts.

In a prospecting article from May we looked at the relative performance of active and passively-managed funds during the volatile months of March and April, a period that theoretically should have favored active managers. With two quarters of 2020 officially behind us, we thought this would be an opportune time to take a look at the longer-term relative performance of these strategies.
Proponents of passive management insist that active managers cannot consistently outperform a passive benchmark and therefore investors are better off to invest in lower-cost index funds. Meanwhile, those in the active camp maintain that through their analysis and expertise active managers are able to produce persistent alpha. The question of active vs. passive is often framed with the premise that active or passive is always superior and focuses largely on the U.S. equity market. However, all markets are not the same and so we should examine the merits of each style on a market-by-market basis instead of taking a one-size-fits-all approach.
The active vs. passive question has special implications for you as an advisor. First and foremost, you want to do what’s best for your clients to help them achieve their financial goals. So, if active managers don’t add value, and utilizing passive funds in order to reduce expenses is in the best interest of your clients, then so be it. On the other hand, utilizing only passive funds eliminates one of your value propositions as an advisor – evaluating and selecting the best funds for your clients – and removes any possibility of outperformance. Therefore, today we’ll examine several different markets in order to find out which are the most efficient and which are the least efficient. In order to get an idea of the level of efficiency, we will take a look at rolling five-year return rankings to see how several of the most well-known indices (representing passive management) have performed.
As mentioned above, the active vs. passive debate often examines only large cap U.S. equities, which is a natural starting point for the discussion – the large cap U.S. equity market is composed of the most well-known companies in the world and represents a large portion of many retirement portfolios. However, if we stop there we ignore what should be an obvious and fundamental element of the discussion – the various markets around the globe are unlikely to all be equally efficient. The very fact that U.S. large cap companies are the most visible and researched firms in the world suggests that the U.S. large cap equity market is likely to be more efficient than its less-well-known counterparts!
In addition to variation across markets, individual markets can also have different characteristics in distinct time periods. During the 10-year bull market from 2009 – 2019 active managers, especially in the U.S. large cap space, often struggled to match the performance of their benchmarks. There have been other periods in the past during which active management has underperformed passive for several years only to have the trend reverse. We cannot rule out the possibility that there have been fundamental changes to the U.S. large cap equity market which will prevent active managers from regaining superiority. However, we also cannot dismiss the possibility that over the last several years we’ve simply been in a market environment that favored passive strategies and the pendulum will swing back in favor of active.


The passive US indices (the S&P 500 SPX and the Russell 2000 RUT) have performed well on an absolute basis with both posting positive returns across almost all time periods examined. The average active manager has struggled to outperform the S&P 500, as the index did not rank below the second quartile in any of the periods shown. On the other hand, the average active manager has been able to narrowly outperform the Russell 2000 finished squarely below the second quartile all periods except for the most recent two. While it’s possible for active managers to outperform both indices, a strong case can be made for passive management in the S&P 500. However, active management has continually outperformed the Russell 2000 making a strong case for active management in the small cap space.


Moving on to the non-US equity rankings, we see that both the developed and emerging market indices rank in the bottom half of their respective universes in almost every period observed. This tells us that the average active manager in these markets has outperformed the index, adding value for their clients, and indicates that active strategies are likely to be preferable in these markets.
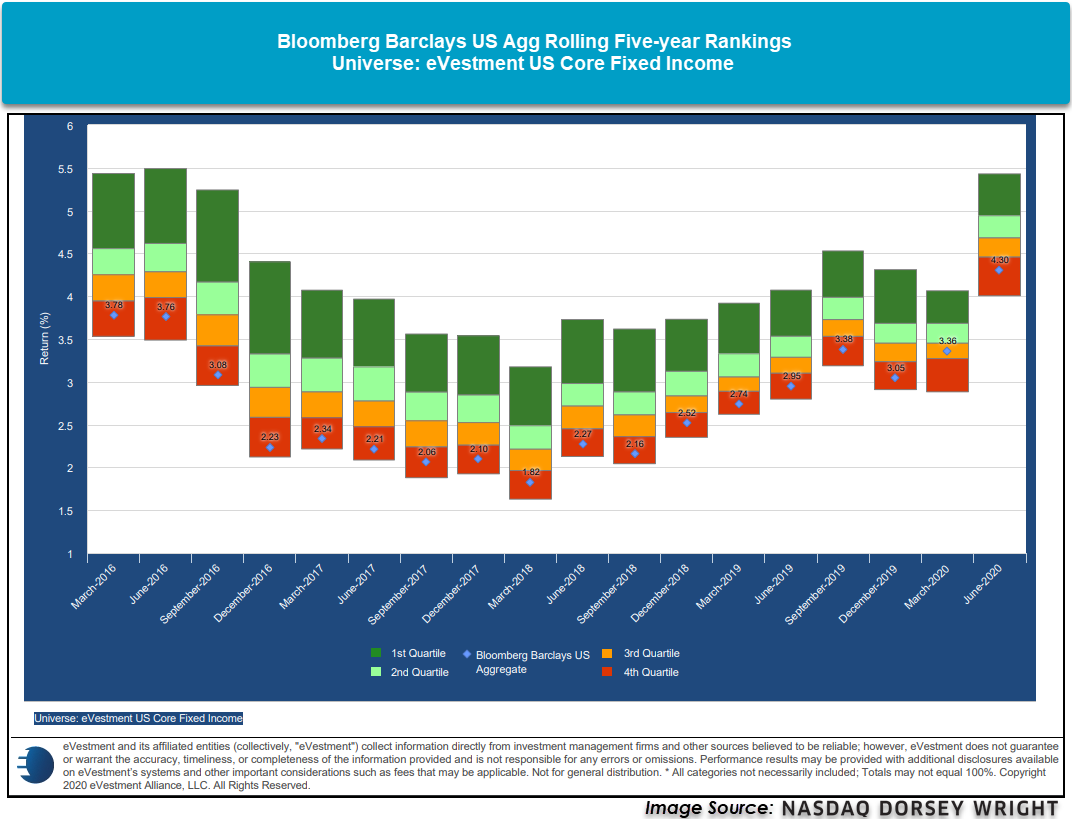

Lastly, US and non-US fixed income active managers have continuously outperformed the indices, especially within the US fixed income space. Similar to the non-US equity indices, active managers have persistently added value for their clients, and active management is likely preferable within the domestic and global fixed income markets.
So, as to which is ultimately better - active or passive - the correct answer seems to be, it depends on the market. As we’ve seen, there are several markets in which the average active manager has usually been able to outperform the index. We’ve also seen there are more efficient markets in which active managers have struggled to outperform the index. Making a market-by-market assessment when deciding whether to employ an active or passive strategy for your clients will allow you to save them money by utilizing passive strategies in efficient markets and add value by identifying inefficient markets and selecting skilled managers who can generate superior returns.
Strength continues to broaden on the Asset Class Group Scores (ACGS) page, as market action Wednesday led to 40 groups now possessing average scores above the sought after 4.00 level. This equates to almost 30% of the total groups, meant to represent the full investible universe, now scoring in the “blue sky zone,” with a total of 88 groups (65%) showing average scores above 3.00. In looking at those areas at the top of the rankings, we continue to see a diverse list of names demonstrating technical strength, with representatives from domestic equities, international equities, fixed income, and alternative investments such as precious metals all find a place among the ACGS leadership. Recent market action has produced some newcomers to this high field position, with a specific focus on the social responsibility group.
Social responsibility is one of the more interesting equity-focused groups we have on the ACGS system, as it includes names from various asset classes that all meet certain environmental, social, or governance (ESG) criteria. The group has seen some major movement thus far through 2020, reaching a previous high of 3.99 on February 6th before showing drastic score deterioration in its descent to a near-term low of 3.02 on April 3rd. While social responsibility funds were not strangers to the March drawdowns that were felt across almost all equity markets, the group did hold a favorable position with a fund score north of 3.00 throughout the market turbulence. After moving sideways in score for April and much of May, the group began to move swiftly higher to most recently cross above the 4.00 score threshold for the first time ever following market action on Wednesday. Furthering this improvement, social responsibility also carries a positive average score direction of 1.22, benefiting the strong technical picture. Those looking for potential ideas within this space can use the “Ideas” link to the left of the group name in the ACGS page.

In addition to the multitude of social responsibility ideas available on the ACGS rankings, we also have the FSM ESG100 Sustainable All Asset Rotation 5S PR4050 model available for those seeking a more objective, rules-based way to play the space. This model looks at an inventory of 100 ESG ETFs and mutual funds following the typical five-holding FSM approach, which is evaluated at the beginning of each seasonal quarter. The strategy also utilizes the PR4050 trigger to cash, which allows it to become defensive should the need arise. In following the five-holding FSM approach, the model will seek to hold the top five scoring funds in its inventory at the time of each model evaluation, which we last saw in early-May. While the model could potentially invest in “risk-off” areas of ESG-related fixed income, the most recent model evaluation led to full exposure towards US equity positions. The portfolio is currently overweight technology, consumer cyclicals, and healthcare, which matches up well with the highest-ranked sector groups on the ACGS page. These holdings have produced a year-to-date return of 7.18%, which bests its benchmark CSIFX by over 350 basis points. Those looking to follow the FSM ESG100 All Asset Rotation strategy may do so by clicking on the “bell” icon under the Actions/Activity column on the models listing page. The next model evaluation will be occurring at the beginning of August.


Average Level
39.42
| AGG | iShares US Core Bond ETF |
| USO | United States Oil Fund |
| DIA | SPDR Dow Jones Industrial Average ETF |
| DVY | iShares Dow Jones Select Dividend Index ETF |
| DX/Y | NYCE U.S.Dollar Index Spot |
| EFA | iShares MSCI EAFE ETF |
| FXE | Invesco CurrencyShares Euro Trust |
| GLD | SPDR Gold Trust |
| GSG | iShares S&P GSCI Commodity-Indexed Trust |
| HYG | iShares iBoxx $ High Yield Corporate Bond ETF |
| ICF | iShares Cohen & Steers Realty ETF |
| IEF | iShares Barclays 7-10 Yr. Tres. Bond ETF |
| LQD | iShares iBoxx $ Investment Grade Corp. Bond ETF |
| IJH | iShares S&P 400 MidCap Index Fund |
| ONEQ | Fidelity Nasdaq Composite Index Track |
| QQQ | Invesco QQQ Trust |
| RSP | Invesco S&P 500 Equal Weight ETF |
| IWM | iShares Russell 2000 Index ETF |
| SHY | iShares Barclays 1-3 Year Tres. Bond ETF |
| IJR | iShares S&P 600 SmallCap Index Fund |
| SPY | SPDR S&P 500 Index ETF Trust |
| TLT | iShares Barclays 20+ Year Treasury Bond ETF |
| GCC | WisdomTree Continuous Commodity Index Fund |
| VOOG | Vanguard S&P 500 Growth ETF |
| VOOV | Vanguard S&P 500 Value ETF |
| EEM | iShares MSCI Emerging Markets ETF |
| XLG | Invesco S&P 500 Top 50 ETF |
| Symbol | Company | Sector | Current Price | Action Price | Target | Stop | Notes |
|---|---|---|---|---|---|---|---|
| BBY | Best Buy Co., Inc. | Retailing | $88.42 | 82 - 90 | 97 | 72 | 4 for 5'er, favored RETA sector, bullish catapult, 2.6% yield, pot. covered write Double top buy signal |
| SIMO | Silicon Motion Technology Corporation (Taiwan) ADR | Semiconductors | $43.85 | upper 40s - lower 50s | 75 | 40 | 3 for 5'er, favored SEMI sector, multi consec buy signals,good support 3.4% yield Earnings 7/29 |
| HOLX | Hologic Incorporated | Healthcare | $60.26 | 54 - 59 | 106 | 48 | 4 for 5'er, top third of favored HEAL sector matrix, triple top, pos. mon mom flip, one box from peer RS buy Earnings 7/29 |
| BIG | Big Lots, Inc. | Retailing | $37.17 | hi 30s - low 40s | 66 | 32 | 4 for 5'er, #3 of 82 names in favored RETA sector matrix, pullback from multi-year high, 3%, pot. covered write |
| ABC | AmerisourceBergen Corporation | Drugs | $101.90 | mid 90s to low 100s | 122 | 81 | 4 for 5'er, favored DRUG sector, big base breakout, pullback from multi-year high, 1.7% yield. Earnings 8/5 |
| PYPL | Paypal Holdings Inc | Business Products | $172.06 | high 160s - low 180s | 200 | 138 | 4 for 5'er, top 10% of favored BUSI sector matrix, multi consec buy signals, pullback from ATH, pot. cov write, Earn. 7/29 |
| MBUU | Malibu Boats Inc. | Leisure | $54.24 | low $50s to low $60s | $71 | $44 | 5 for 5'er, LT peer RS buy signal, pos mon mom, fav DWALEIS |
| Symbol | Company | Sector | Current Price | Action Price | Target | Stop | Notes |
|---|---|---|---|---|---|---|---|
| TAP | Molson Coors Company | Food Beverages/Soap | $35.77 | mid 30s | $22 | $41 | 0 for 5'er, consec sell signals, spread triple bottom, LT market RS sell signal, bottom of DWAFOOD Earnings 7/30 |
| Symbol | Company | Sector | Current Price | Action Price | Target | Stop | Notes |
|---|---|---|---|---|---|---|---|
| CREE | Cree Research Inc | Semiconductors | $66.25 | low to mid 60s | $79 | $51 | See follow below |
| CRM | Salesforce.com, Inc. | Software | $188.09 | hi 190s - low 200s | 240 | 164 | See follow comment below |
| SAH | Sonic Automotive Inc. | Retailing | $39.97 | low-to-mid 30s | 36 | 32.50 | See follow comment below. |
| ICPT | Intercept Pharmaceuticals Inc | Biomedics/Genetics | $44.72 | mid 40s | $6 | $50 | See follow comment below. |
| Comment |
|---|
| RP RealPage Inc. R ($66.69) - Software - Raise stop to $55, the bullish support line. |
| CREE Cree Research Inc R ($65.73) - Semiconductors - CREE has moved outside of our actionable range into overbought territory. No new positions here. We will raise our stop to $51. |
| CRM Salesforce.com, Inc. R ($184.25) - Software - CRM moved to a sell signal with today's action. No new positions here. We will abide by our $164 stop. |
| SAH Sonic Automotive Inc. R ($39.20) - Retailing - SAH moved outside of our actionable range and is heavily overbought. No new positions here. We will raise our stop to $32.50, the first sell signal on SAH's 0.50 point chart. Note earnings are expected 7/30. |
| ICPT Intercept Pharmaceuticals Inc R ($46.92) - Biomedics/Genetics - ICPT gave a first buy signal today. No new short exposure here. We will abide by our $50 buy stop. |
MBUU Malibu Boats Inc. R ($53.62) - Leisure - MBUU is a perfect 5 for 5’er within the favored leisure sector that has maintained a peer RS buy signal since February 2017 and is trading well above the bullish support line. This stock returned to a buy signal at $54 before pulling back to $50 where it remained above support. With yesterday’s market action, MUU reversed back up into X’s to $54 and now sits just three boxes away from breaking a spread triple top at $57. Note a move to this level would also mark a new 52 week high and the second consecutive buy signal on the chart. Monthly momentum has been positive for three months, adding to the positive technical picture. New exposure okay in the low $50s to low $60s. We will set our initial stop at $44 and will use MBUU’s bullish price objective of $71 as our near-term price target.
| 19 | 20 | ||||||||||||||||||||||||||||||||||||||||||||||||||||
| 56.00 | X | X | 56.00 | ||||||||||||||||||||||||||||||||||||||||||||||||||
| 55.00 | X | O | X | O | 55.00 | ||||||||||||||||||||||||||||||||||||||||||||||||
| 54.00 | X | O | X | X | O | X | 54.00 | ||||||||||||||||||||||||||||||||||||||||||||||
| 53.00 | • | X | O | X | O | X | X | O | X | 53.00 | |||||||||||||||||||||||||||||||||||||||||||
| 52.00 | X | • | X | O | X | O | X | O | 7 | O | X | 52.00 | |||||||||||||||||||||||||||||||||||||||||
| 51.00 | X | X | O | • | X | X | O | X | X | O | X | O | X | O | X | 51.00 | |||||||||||||||||||||||||||||||||||||
| 50.00 | X | O | X | O | • | X | O | 6 | O | X | O | X | O | O | X | O | 50.00 | ||||||||||||||||||||||||||||||||||||
| 49.00 | • | X | O | X | O | • | X | X | O | X | O | X | O | X | O | 49.00 | |||||||||||||||||||||||||||||||||||||
| 48.00 | • | • | X | O | X | O | • | X | O | X | O | X | O | X | O | Mid | 48.00 | ||||||||||||||||||||||||||||||||||||
| 47.00 | X | X | • | X | O | O | • | X | O | X | O | O | 47.00 | ||||||||||||||||||||||||||||||||||||||||
| 46.00 | X | O | X | O | • | 2 | O | • | X | O | X | 46.00 | |||||||||||||||||||||||||||||||||||||||||
| 45.00 | X | O | X | O | • | X | O | • | X | O | 45.00 | ||||||||||||||||||||||||||||||||||||||||||
| 44.00 | X | O | X | 3 | X | • | X | O | 3 | • | X | 44.00 | |||||||||||||||||||||||||||||||||||||||||
| 43.00 | X | O | X | O | X | O | X | • | X | O | X | O | • | X | 43.00 | ||||||||||||||||||||||||||||||||||||||
| 42.00 | X | O | X | O | 4 | O | X | O | • | X | X | O | X | O | • | X | X | 42.00 | |||||||||||||||||||||||||||||||||||
| 41.00 | 2 | O | O | X | 5 | X | O | • | • | C | O | X | O | O | • | X | O | X | 41.00 | ||||||||||||||||||||||||||||||||||
| 40.00 | X | O | X | O | X | O | X | 7 | • | • | X | O | X | O | • | X | O | X | 40.00 | ||||||||||||||||||||||||||||||||||
| 39.00 | X | O | X | O | X | O | 6 | O | X | O | X | • | X | 1 | O | X | O | X | 39.00 | ||||||||||||||||||||||||||||||||||
| 38.00 | X | O | O | O | X | O | X | O | X | O | • | X | O | X | O | X | 38.00 | ||||||||||||||||||||||||||||||||||||
| 37.00 | X | O | X | O | O | X | O | • | X | O | X | O | X | • | 37.00 | ||||||||||||||||||||||||||||||||||||||
| 36.00 | 1 | O | O | O | X | O | X | X | O | X | • | 36.00 | |||||||||||||||||||||||||||||||||||||||||
| 35.00 | X | O | X | X | O | X | O | X | O | X | • | 35.00 | |||||||||||||||||||||||||||||||||||||||||
| 34.00 | X | O | X | O | X | O | X | O | X | O | • | 34.00 | |||||||||||||||||||||||||||||||||||||||||
| 33.00 | O | X | O | X | • | O | X | 5 | X | • | 33.00 | ||||||||||||||||||||||||||||||||||||||||||
| 32.00 | O | A | B | • | O | X | O | • | 32.00 | ||||||||||||||||||||||||||||||||||||||||||||
| 31.00 | O | 9 | • | O | X | • | Bot | 31.00 | |||||||||||||||||||||||||||||||||||||||||||||
| 30.00 | O | X | • | O | X | X | • | 30.00 | |||||||||||||||||||||||||||||||||||||||||||||
| 29.00 | 8 | X | • | O | X | O | X | X | • | 29.00 | |||||||||||||||||||||||||||||||||||||||||||
| 28.00 | O | X | • | O | X | O | X | O | X | • | 28.00 | ||||||||||||||||||||||||||||||||||||||||||
| 27.00 | O | X | • | O | X | O | X | X | O | X | X | • | 27.00 | ||||||||||||||||||||||||||||||||||||||||
| 26.00 | O | X | • | O | X | O | X | O | X | 4 | X | O | X | • | 26.00 | ||||||||||||||||||||||||||||||||||||||
| 25.00 | O | • | O | O | X | O | X | O | X | O | X | • | 25.00 | ||||||||||||||||||||||||||||||||||||||||
| 24.00 | • | O | X | O | X | O | X | O | • | 24.00 | |||||||||||||||||||||||||||||||||||||||||||
| 23.00 | O | O | O | X | • | 23.00 | |||||||||||||||||||||||||||||||||||||||||||||||
| 22.00 | O | X | • | 22.00 | |||||||||||||||||||||||||||||||||||||||||||||||||
| 21.00 | O | X | • | 21.00 | |||||||||||||||||||||||||||||||||||||||||||||||||
| 20.00 | O | X | • | 20.00 | |||||||||||||||||||||||||||||||||||||||||||||||||
| 19.50 | O | X | • | 19.50 | |||||||||||||||||||||||||||||||||||||||||||||||||
| 19.00 | O | X | • | 19.00 | |||||||||||||||||||||||||||||||||||||||||||||||||
| 18.50 | O | • | 18.50 | ||||||||||||||||||||||||||||||||||||||||||||||||||
| 19 | 20 |

| FDX FedEx Corporation ($166.61) - Aerospace Airline - FDX broke a double top at $164 before moving higher to $166 on Thursday. This marks the fourth consecutive buy signal on the chart for this 3 for 5’er that ranks 2nd out of 42 names in the favored aerospace airline sector RS matrix. Additionally, monthly momentum has bene positive for two months, suggesting the potential for higher prices. Demand is in control. From here, initial support sits at $154 while overhead resistance lies at $168. |
| GRMN Garmin Ltd. ($100.59) - Electronics - GRMN broke a spread triple top at $100 on Thursday, marking the second consecutive buy signal on the chart. This stock is a perfect 5 for 5’er within the favored electronics sector that has maintained a market RS buy signal since March 2019. Demand is in control. From here, initial support sits at $96 while GRMN faces resistance at $104. Note earnings are expected 7/29. |
| LHCG LHC Group, Inc. ($183.89) - Healthcare - LHCG broke a double top at $186, marking a new all-time high as well as the fourth consecutive buy signal, confirming that demand is in control. This stock is a solid 5 for 5’er that ranks in the top quartile of the favored healthcare sector that has experienced two weeks of positive weekly momentum. Demand is in control however LHCG is trading in heavily overbought territory. From here, initial support sits at $172. Earnings are expected 8/5. |
| ODFL Old Dominion Freight Line, Inc. ($179.89) - Transports/Non Air - ODFL broke a double top at $180 before moving higher to $182, marking a new all-time high. This stock is a 5 for 5’er that has given five consecutive buy signals. In addition, ODFL has maintained a long-term market RS buy signal since May 2010 and just experienced a flip to positive weekly momentum. Demand is in control and the technical picture is positive. From here, initial support sits at $172. Note this stock expects earnings 7/30. |
| PETS PetMed Express, Inc. ($41.47) - Retailing - PETS broke a double top at $40 before moving higher to $41 on Thursday, marking the second consecutive buy signal on the chart. PETS is a solid 4 for 5’er in the retailing sector that just experienced a flip to positive weekly momentum, suggesting the potential for higher prices. Demand is in control and the technical weight of the evidence is positive. From here, initial support sits at $36. Earnings expected 7/20. |
| PRAA Portfolio Recovery Associates, Inc. ($40.49) - Finance - PRAA climbed higher on Thursday to break a spread quintuple top at $40, resulting in a fourth consecutive buy signal. The 3 for 5’er ranks in the top quartile of the favored finance stock sector matrix and currently resides one box away from returning to an RS buy signal versus the market. In addition, PRAA reentered a positive trend in May of this year and is actionable from an Overbought/Oversold (OBOS) perspective. Demand is in control. The next level of resistance resides at $43, while initial support is offered at $36. Note earnings are expected on August 6th. |
| SAIA Saia, Inc. ($126.67) - Transports/Non Air - SAIA is a perfect 5 for 5’er that broke a double top at $130, marking a new all-time high. Today’s breakout marks the third consecutive buy signal on the chart, confirming that demand is in control. Weekly momentum just flipped positive while monthly momentum has been positive for two months. Overall, demand is in control and the technical picture is positive. From here, initial support sits at $122. |
| SEE Sealed Air Corporation ($37.00) - Business Products - SEE advanced during trading on Thursday to break a double top at $37, completing a bullish catapult pattern and giving a second consecutive buy signal. The 3 for 5’er ranks in the top third of the favored business products stock sector matrix and reentered a positive trend in June of this year. In addition, weekly and monthly momentum just flipped to positive, suggesting the potential for further upside from here. The next level of resistance resides at $40 while initial support is offered at $30. Note SEE offers a yield of 1.77% and earnings are expected on August 6th. |
| SHW The Sherwin-Williams Company ($598.77) - Building - Shares of SHW advanced on Thursday to break a double top at $600, giving a seventh consecutive buy signal and matching an all-time chart high. The 4 for 5’er resides in the favored building sector and demonstrates positive long-term relative strength versus the market, remaining on an RS buy signal since October of 2001. In addition, weekly and monthly momentum recently flipped positive, suggesting the potential for further upside from here. Demand is in control. Further bullish confirmation would come with a move past current resistance at $600 while initial support is offered at $560. Note earnings are expected on July 28th. |
| WLK Westlake Chemical Corporation ($55.22) - Chemicals - WLK broke a double top at $56, returning the chart to a Point & Figure buy signal. This stock is a 3 for 5’er that moved back into a positive trend in mid-May and ranks 11th out of 49 stocks in the favored chemicals sector. Additionally, monthly momentum just flipped positive, suggesting the potential for higher prices. From here, initial support sits at $51 while WLK faces overhead resistance at $57. Earnings are expected 8/4. |
| Name | Option Symbol | Action | Stop Loss |
|---|---|---|---|
| Mondelez International Inc. - $53.04 | MDLZ2018I47.5 | Buy the September 47.50 calls at 6.30 | 47.00 |
| Name | Option | Action |
|---|---|---|
| Morgan Stanley ( MS) | Sep. 46.00 Calls | Raise the option stop loss to 5.25 (CP: 7.25) |
| Lowe's Companies, Inc. ( LOW) | Sep. 130.00 Calls | Raise the option stop loss to 14.00 (CP: 16.00) |
| Lowe's Companies, Inc. ( LOW) | Oct. 130.00 Calls | Raise the option stop loss to 15.15 (CP: 17.15) |
| Name | Option Symbol | Action | Stop Loss |
|---|---|---|---|
| Ross Stores, Inc. - $84.56 | ROST2020W90 | Buy the November 90.00 puts at 13.30 | 88.00 |
| Name | Option | Action |
|---|---|---|
|
|
||
| Name | Option Sym. | Call to Sell | Call Price | Investment for 500 Shares | Annual Called Rtn. | Annual Static Rtn. | Downside Protection |
|---|---|---|---|---|---|---|---|
| eBay Inc. $58.39 | EBAY2016J60 | Sep. 60.00 | 4.35 | $27,465.00 | 32.38% | 26.87% | 6.34% |
| Name | Action |
|---|---|
| Micron Technology, Inc. (MU) - 50.51 | Sell the October 50.00 Calls. |
| Bank of America (BAC) - 24.60 | Sell the November 25.00 Calls. |
| D.R. Horton, Inc. (DHI) - 60.05 | Sell the November 60.00 Calls. |
| Applied Materials, Inc. (AMAT) - 62.10 | Sell the October 65.00 Calls. |
| Chegg Inc (CHGG) - 70.91 | Sell the October 75.00 Calls. |
| Big Lots, Inc. (BIG) - 37.17 | Sell the October 42.50 Calls. |
| Best Buy Co., Inc. (BBY) - 88.42 | Sell the September 90.00 Calls. |
| Texas Instruments Incorporated (TXN) - 132.15 | Sell the November 135.00 Calls. |
| Wendy's Company (WEN) - 22.45 | Sell the October 23.00 Calls. |
| Fifth Third Bancorp (FITB) - 19.17 | Sell the November 19.00 Calls. |
| J.P. Morgan Chase & Co. (JPM) - 99.73 | Sell the September 100.00 Calls. |
| Salesforce.com, Inc. (CRM) - 188.09 | Sell the November 195.00 Calls. |
| Name | Covered Write |
|---|---|
|
|
|
Daily Equity & Market Analysis
Loading, Please Wait...
