
Most Requested Symbols

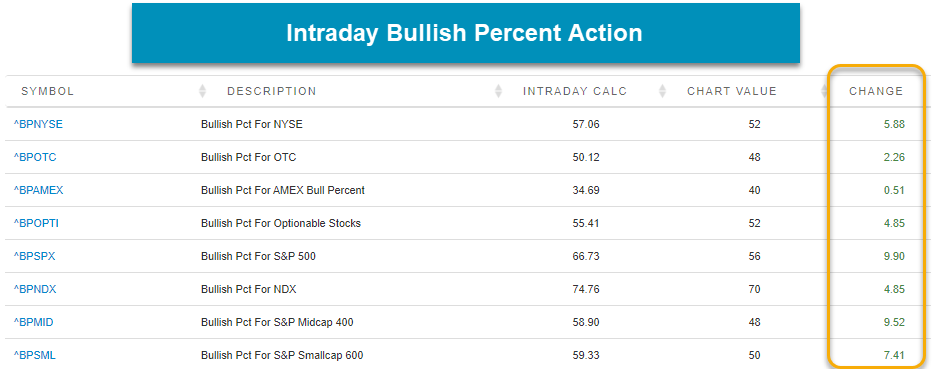
Positive vaccine-related news from Moderna (MRNA) spurred a broad market rally Wednesday, causing a number of new buy signals across the board. This led the S&P 600 Bullish Percent chart (^BPSML) to reverse back up into X's, indicating that the offensive team is back on the field for small cap stocks.
With today’s market action, we saw a handful of US major market funds give buy signals which we'll highlight below in addition to the new all-time highs recorded this week for both XLG and QQQ.
Emerging markets equity has seen significant technical improvement over the past few weeks.
Today's featured stock is PayPal Holdings Inc (PYPL).
ADNT, AMP, APAM, APO, CMI, DHI, HOG, MAR, ROK & UFPI.
Call: Lennar Corp (LEN), Put: Walgreens Boots Alliance (WBA), Covered Write: Salesforce.com (CRM)
Market Update Webinar Replay - Missed Monday's webcast? Click the link(s) below for a recap:
Beginners Series Webinar - Join us on Friday, July 17th, at 2 PM (ET) for our NDW Beginners Series Webinar. This week's topic is Understanding the Asset Class Group Scores Page. Register here.
With the recent pull back earlier this week, we are starting to see a narrowing in participation in the large cap tech-heavy space, as illustrated by the Nasdaq 100 Index NDX. The bullish percent for NDX ^BPNDX reversed into a column of O’s and is currently sitting at 70% on the chart. As a reminder, the bullish percent measures the percent of stocks that are on a Point & Figure buy signal or controlled by demand. Remember, the bullish percent serves as a risk barometer. While this indicator is not the only chart we consider, it is worth keeping an eye on to see if defense continues to be on the field. Those with exposure to the Nasdaq 100 or its constituents should review their holdings. With the diminishing of participation, we recommend identifying viable stop loss points for positions that may be in your portfolio.


Each week the analysts at DWA review and comment on all major asset classes in the global markets. Shown below is the summary or snapshot of the primary technical indicators we follow for multiple areas. Should there be changes mid-week we will certainly bring these to your attention via the report.
| Universe | BP Col & Level (actual) | BP Rev Level | PT Col & Level (actual) | PT Rev Level | HiLo Col & Level (actual) | HiLo Rev Level | 10 Week Col & Level (actual) | 10 Week Rev Level | 30 Week Col & Level (actual) | 30 Week Rev Level |
|---|---|---|---|---|---|---|---|---|---|---|
| ALL |
|
56% |
|
40% |
|
84% |
|
58% |
|
34% |
| NYSE |
|
58% |
|
56% |
|
86% |
|
52% |
|
26% |
| OTC |
|
54% |
|
38% |
|
84% |
|
60% |
|
40% |
| World |
|
54% |
|
38% |
|
|
|
66% |
|
36% |
The positive news from Moderna MRNA sent shares of the stock soaring to new highs in early market trading on Wednesday, hitting an intraday-day high of above $88 before backing off a bit. The news spurred a broad market rally causing a number of new buy signals across the board. The S&P 500 Bullish Percent BPSPX was up more than 9%, continuing a move higher in X’s. Additionally, other bullish percent charts like the S&P 600 Bullish Percent BPSML rose more than 7%, which triggered a reversal back into X’s at 58%. For much of the year, Small Cap stocks, in general, have laggard the broader equity market, but the move today in Small Caps puts the offensive team back on the field for these names and suggests much broader participation is taking shape in the market today.
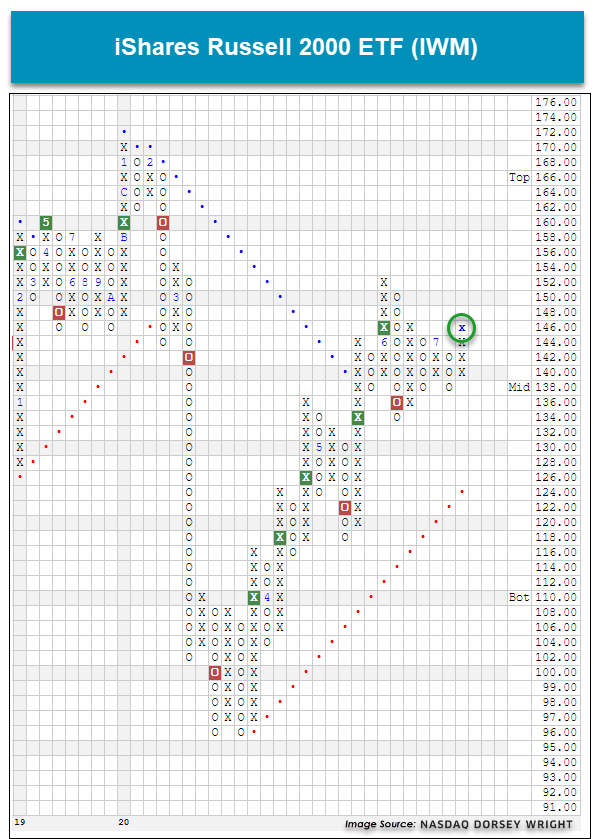
The iShares Russell 2000 ETF IWM, through Tuesday, is still down 14% on the year compared to the S&P 500 SPX which is down less than 1%. With the recent strength in Small Cap stocks, the trend chart of IWM returned to a buy signal at $146. While the score of IWM is still below 3, the return to a buy signal for IWM is, at least, an initial positive development for Small Caps, in general.
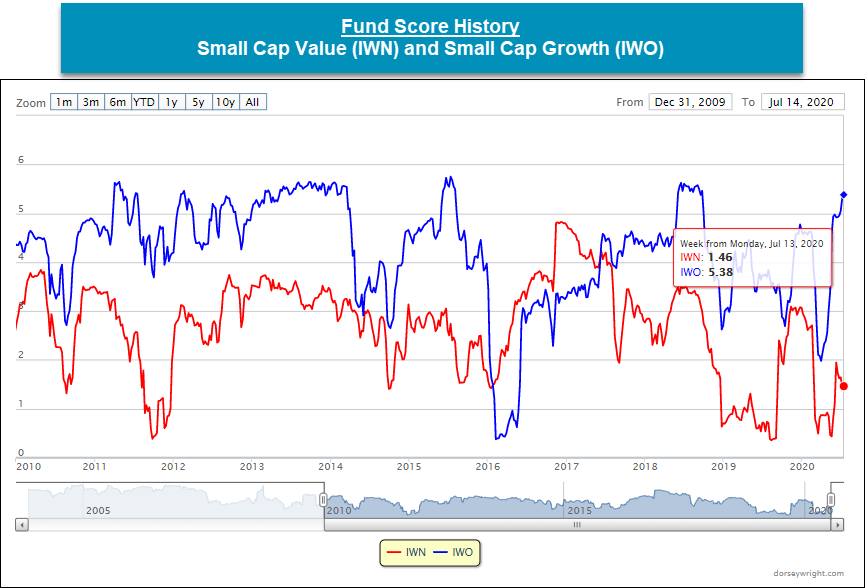
Although the broader Small Cap space has seen improvement over the course of the past few months, the Small Cap Growth space remains the dominant style within Small Caps, as well as the broader equity market. As a matter of fact, a look at the US Size & Style rankings within the DALI shows Large, Mid, and Small Cap Growth in the top three positions in terms of their relative strength rankings. At the other end of the spectrum is Small Cap Value, which currently ranks in the last place. The leadership trend within Small Cap Growth versus Small Cap Value is also visible through the fund score. Below, is a historical fund score view of the iShares Russell Small Cap Value ETF IWN versus the iShares Russell Small Cap Growth ETF IWO. For the better part of the past three years, the fund score of Small Growth has been higher than Small Value. Even more recently as the score of Small Growth has pushed above the 5.00 level, the score of Small Value has stagnated a bit in the mid 1’s. All of this is to say, that while there is improvement afoot within the Small Cap space, it is the Small Cap Growth style that maintains a leadership position in the market.

| Symbol | Name | Price | Yield | PnF Trend | RS Signal | RS Col. | Fund Score | 200 Day MA | Weekly Mom |
|---|---|---|---|---|---|---|---|---|---|
| DIA | SPDR Dow Jones Industrial Average ETF Trust | 266.59 | 2.25 | Positive | X | 3.59 | 262.38 | -3W | |
| EEM | iShares MSCI Emerging Markets ETF | 43.01 | 2.08 | Positive | Sell | O | 4.57 | 40.57 | +14W |
| EFA | iShares MSCI EAFE ETF | 62.84 | 2.60 | Positive | Sell | O | 1.40 | 62.94 | -2W |
| FM | iShares MSCI Frontier 100 ETF | 24.08 | 3.30 | Negative | Sell | O | 0.39 | 26.41 | -2W |
| IJH | iShares S&P MidCap 400 Index Fund | 177.74 | 1.81 | Positive | Buy | O | 2.11 | 183.21 | -3W |
| IJR | iShares S&P SmallCap 600 Index Fund | 67.59 | 1.75 | Positive | Buy | O | 1.81 | 72.52 | -2W |
| QQQ | Invesco QQQ Trust | 260.37 | 0.63 | Positive | Buy | X | 5.86 | 213.79 | +3W |
| RSP | Invesco S&P 500 Equal Weight ETF | 103.24 | 2.08 | Positive | Buy | X | 3.26 | 104.54 | -3W |
| SPY | SPDR S&P 500 ETF Trust | 318.92 | 1.79 | Positive | O | 4.20 | 302.43 | -3W | |
| XLG | Invesco S&P 500 Top 50 ETF | 249.13 | 1.46 | Positive | O | 5.63 | 224.57 | +1W |
It was a generally positive week across the board as nine out of the 10 major market funds finished in positive territory. The iShares MSCI Frontier 100 ETF FM was the single fund to finish in the red with a loss of -0.04% while the best performing over the last seven days was the SPDR Dow Jones Industrial Average ETF DIA, up 2.92%. Year-to-date, the Invesco QQQ Trust QQQ continues its lead with a double-digit gain of 22.46%, followed by the Invesco S&P 500 Top 50 ETF XLG, up 6.74%. With today’s market action, we saw a handful of US major market funds give buy signals which we'll highlight below in addition to the new all-time highs recorded this week for both XLG and QQQ.
New Intraday Buy Signals: DIA, IJH, & IJR
Today, the SPDR Dow Jones Industrial Average ETF DIA completed a fourth consecutive buy signal with a double top break at $270, confirming that demand is in control. In addition, DIA just experienced a flip to positive monthly momentum after having spent the prior five months negative, suggesting the potential for higher prices. From a scoring perspective, DIA is a solid 3.59 with a strongly positive score direction of 1.11. From current levels, DIA faces resistance at $275, its June high, while initial support sits at $250, a level that has held twice since June.
The iShares S&P MidCap 400 Index Fund IJH also gave a buy signal today, marking the second consecutive to occur on its chart when it broke a triple top at $182. Although this is a positive development, IJH possesses a weak score of 2.11 and has experienced three weeks of negative weekly momentum. IJH has been somewhat range-bound over the last few months; from current levels, initial resistance sits at $184 while its June high sits at $194. From here, initial support is offered at $174. Year-to-date, IJH is down over -13% versus the S&P 500 Index SPX’s loss of -1.03%.
The iShares S&P SmallCap 600 Index Fund IJR returned to a buy signal with Wednesday’s market action with a double top breakout at $70. IJR has now formed solid support at $65, a level that it has tested on three previous occasions. Like IJH, IJR has traded in a bit of a range over the last few months and from here, faces overhead resistance at $71 and $75. Weekly momentum has been negative for two weeks and IJH remains in negative territory for the year, down over -19%. Today’s breakout is positive however we will continue to monitor for additional follow through to the upside.

Breakout on SPY
On Monday, the SPDR S&P 500 ETF Trust SPY gave a fourth consecutive buy signal on its default chart with a double top breakout at $320. With today’s action, the more sensitive 2-point chart for SPY has formed a spread triple top at $322, which would be broken with a move to $324. Currently, SPY has a solid fund score of 4.20 with a positive score direction of 1.25. Furthermore, monthly momentum just flipped positive and SPY continues to trade well above its bullish support line. From current levels, the default chart for SPY faces resistance here at $320, with the last remaining level of resistance lying at the $335 level, the fund’s all-time high from February. Initial supports sits at $300. New positions are welcome here as SPY has a relatively normal OBOS% reading of 41% overbought.

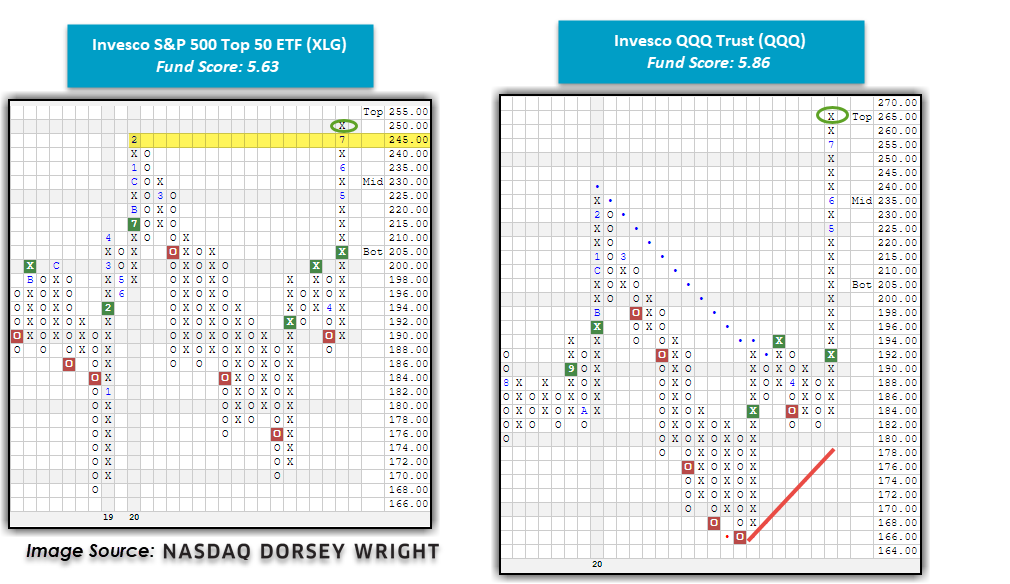
New All-Time Highs for XLG & QQQ
Earlier this week, the Invesco S&P 500 Top 50 ETF XLG printed an X at $250, marking a new all-time high for the fund. Recall that XLG returned to a buy signal in April at $205 and has continued to trade on a stem ever since. Both weekly and monthly momentum have flipped positive, suggesting the potential for higher prices for the large-cap fund. Additionally, XLG has a strong fund score of 5.63, adding to the positive technical picture. Currently, XLG is 64% overbought so those looking to initiate new positions could scale in here or wait for a minor pullback. Since the default chart is on a stem, we will use the fund’s 2-point chart to identify additional support levels. The 2-point chart reversed up into X’s with today’s action, establishing initial support at $244, while additional support sits at the $323 level.
The Invesco QQQ Trust QQQ also printed a new all-time high on Monday with a rally to $265. Similar to XLG, QQQ is up on a significant stem and initial support isn't offered until the $182 level. The 1 point per box chart, however, shows initial support available at $253 with additional support at $238. QQQ has a strong fund score of 5.86 and has experienced three weeks of positive weekly momentum and three months of positive monthly momentum. This recent move to the upside has pushed QQQ into overbought territory with an OBOS% reading of 78%, so those looking to initiate new long positions would best be served to scale in or wait for a pullback/normalization of the 10-week trading band.
SECTOR BULLISH PERCENT CHANGES
| Reversed to X | Reversed to O |
|---|---|
| 4 (BPEUTI | 56), (BPFORE | 54), (BPGAME | 48), (BPSEMI | 76), |
2 (BPBIOM | 50), (BPWAST | 38), |
| To Xs | To Os |
|---|---|
| Healthcare ( 0.84 to 48 ) | Building ( 0.84 to 60 ) |
Average Level
48.96
| Sector |
|---|
| None |
| Sector |
|---|
| Gaming (48%) - Bear Correction |
| Textiles / Apparel (46%) - Bull Confirmed |
| Sector |
|---|
| Autos & Parts (54%) - Bear Alert |
| Biomedics/Genetics (50%) - Bear Confirmed |
| Business Products (56%) - Bear Alert |
| Electronics (54%) - Bear Alert |
| Finance (50%) - Bull Correction |
| Internet (56%) - Bull Correction |
| Machinery and Tools (54%) - Bear Alert |
| Real Estate (52%) - Bear Alert |
| Retailing (52%) - Bull Correction |
| Software (52%) - Bear Confirmed |
| Transports / Non Air (50%) - Bull Correction |
| Wall Street (66%) - Bear Alert |
SECTOR INDICATOR CHART CHANGES
PT is the percentage of stocks within a sector that are trading above their bullish support lines. RSX is the percentage of stocks within a sector whose relative strength charts are in a column of Xs. RSP is the percentage of stocks within a sector whose relative strength charts are on a buy signal. The strongest sectors, i.e. market leaders, will have most of these indicators positive and moving higher in a column of Xs.
|
There were mostly falling sector PT charts this week, with 8 falling and 2 rising. The following sector charts rose: Electronics [^PTELEC], Precious Metals [^PTPREC]. The following sector charts fell: Aerospace Airline [^PTAERO], Banks [^PTBANK], Insurance [^PTINSU]-Rev. , Media [^PTMEDI]-Rev. , Protection Safety Equipment [^PTPROT]-Rev. , Restaurants [^PTREST], Steel/Iron [^PTSTEE]-Rev. , Textiles/Apparel [^PTTEXT]. There were 4 that reversed to O. |
|
| ^PT Charts Reversing Up - | ^PT Charts Reversing Down - |
|
|
|
| ^PT Charts Moving Higher - | ^PT Charts Moving Lower - |
|
There were mostly falling sector RSX charts this week, with 20 falling and 3 rising. The following sector charts rose: Forest Prods/Paper [^RSXFORE], Internet [^RSXINET], Precious Metals [^RSXPREC]. The following sector charts fell: Aerospace Airline [^RSXAERO], Autos and Parts [^RSXAUTO]-Rev. , Banks [^RSXBANK]-Rev. , Biomedics/Genetics [^RSXBIOM]-Rev. , Business Products [^RSXBUSI]-Rev. , Drugs [^RSXDRUG]-Rev. , Healthcare [^RSXHEAL]-Rev. , Leisure [^RSXLEIS], Machinery and Tools [^RSXMACH]-Rev. , Media [^RSXMEDI], Oil [^RSXOIL], Oil Service [^RSXOILS], Real Estate [^RSXREAL], Restaurants [^RSXREST], Retailing [^RSXRETA], Savings & Loans [^RSXSAVI]-Rev. , Steel/Iron [^RSXSTEE]-Rev. , Textiles/Apparel [^RSXTEXT], Transports/Non Air [^RSXTRAN]-Rev. , Waste Management [^RSXWAST]. There were 0 that moved to buy signals and 5 that moved to sell signals. The following were buy signals: . The following were sell signals: Business Products [^RSXBUSI],Leisure [^RSXLEIS],Restaurants [^RSXREST],Retailing [^RSXRETA],Waste Management [^RSXWAST]. |
|
| ^RSX Charts Reversing Up - | ^RSX Charts Reversing Down - |
|
|
|
| ^RSX Charts Moving Higher - | ^RSX Charts Moving Lower - |
|
There were equal amounts of rising and falling sector RSP charts this week, with 4 both rising and falling. The following sector charts rose: Autos and Parts [^RSPAUTO], Electronics [^RSPELEC], Metals Non Ferrous [^RSPMETA], Precious Metals [^RSPPREC]. The following sector charts fell: Biomedics/Genetics [^RSPBIOM]-Rev. , Drugs [^RSPDRUG]-Rev. , Oil [^RSPOIL], Restaurants [^RSPREST]. There were 2 that reversed to O. |
|
| ^RSP Charts Reversing Up - | ^RSP Charts Reversing Down - |
|
|
|
| ^RSP Charts Moving Higher - | ^RSP Charts Moving Lower - |
FAVORED SECTOR STATUS CHANGES
A sector is considered to be Favored if it has 3 or 4 of the sector indicators (Relative Strength, RSX, RSP, & PT) positive, Average if it has 2 of the 4 indicators positive, & Unfavored if it has 0 or 1 of the indicators positive. The table below contains those sectors that have experienced a Favored Sector Status change over the past week. It is best to focus on sectors that are about 50% or lower on their Bullish Percent charts & are in Xs. Note: If a sector moves from Favored to Average, it doesn't necessarily mean that the sector in question has to be sold - it just means you need to evaluate your individual positions with exposure to that sector.
| Changes since 07/08/2020 | Full Report |
|
|
|
|
|||||||||||||
|
|
|
|
|
|
|||||||||||
|
|
|
|
|
|
|||||||||||
|
|
|
|
|
|
|||||||||||

The past week of market action has seen continued upside movement for most major international equity markets, with the iShares MSCI Emerging Markets ETF EEM and iShares MSCI EAFE ETF EFA each posting gains in excess of 1%. If we look back at the past 30 days, however, we can see that much of the improvement has come from the emerging market space, with EEM posting a significant gain of 7.88% (through 7/14). This is depicted on the trend chart of EEM, which shows that the fund has given four consecutive buy signals since moving off its multi-year low of $30.50 in March to recently reach $43.50 earlier this month. While the improvement in technical strength is easily visible from the default trend chart, we have also seen a notable rise in the fund score of EEM, which can be seen by clicking on the actual score in the upper left-hand side of the page. EEM saw its first major score gain on July 6th, rising over a full point from a score of 2.49 on July 2nd to 3.56 that following Monday. The score then underwent another significant increase later that week, as the July 9th reading saw another full point increase to 4.68. Currently, EEM remains close to that reading with a recent score posting of 4.57 following trading Tuesday. This swift improvement in score speaks to the flexible nature of the fund score system, as the readings will adjust nightly to reflect the underlying strength of the fund as examined through the 19 different factors that contribute to each fund’s score. In addition to the strong score itself, we see that EEM also carries an intensely positive score direction of 3.98, indicative of the recent ascent from its multi-year low.

Much of this score improvement can be attributed to Chinese equities, as China continues to lead the way for all non-US groups in the Asset Class Group Scores (ACGS) page with a recent score average of 4.99. China has been the highest scoring international group throughout the majority of the global equity market rally we have experienced over the past few months, and remains the only international equity group with an average group score north of 4.00. However, this continued strength has led the broader emerging market space to close the gap, with the all emerging markets equity and emerging markets diversified groups posting recent score averages of 3.59 and positive score directions of 1.99 and 2.19, respectively. Looking specifically at the score history for all emerging markets equity, we can see that this is the highest average score the group has seen since January of this year. Prior to that, the group had not scored this well since April of 2019. In fact, in looking throughout the full history of this group score, we can see that the 3.50 to 4.00 range has served as somewhat of a “cap” in score for all emerging markets equity for much of the last decade, with the exception of a one-year period from April 2017 to April 2018. The group has experienced multiple bouts of strength over this timeframe, but each have these have failed to lead to prolonged periods of strength with an average score above 4.00. The most recent rally for emerging markets makes this historical relationship a place to keep a close eye on as we head down the remainder of the year.

The US Treasury 10YR Yield Index TNX gave a second consecutive sell signal at 0.60% in last week’s trading. The index has completed a series of lower tops and lower bottoms since rallying to 0.95% in June.
Convertible bonds have reached the top of the Asset Class Group Scores (ACGS) fixed income rankings with an average group score of 4.86, the highest level it has ever reached; the group now ranks sixth out of all 135 groups in the ACGS system. There are now 20 fixed income groups with average scores above the 4.0 threshold.

After reaching an all-time high of $76 in Monday’s (7/13) trading, the iShares Convertible Bond ETF ICVT reversed down on Tuesday and currently sits at $73 on its default chat. ICVT currently has a near-perfect 5.88 fund score and a positive 4.33 fund score direction. Since bottoming in at $47 in March, the fund has given four consecutive buy signals. Year-to-date (through 7/14) ICVT has gained 17.83% outperforming the S&P 500 SPX which has returned -1.03% and the iShares US Core Bond ETF AGG which has notched a price return of 5.61%. The fund currently yields 1.56%. Even with this pullback, ICVT remains in overbought territory with a weekly overbought/oversold reading of 80%, so those considering adding exposure may be best served to do so on a pullback or after prices have normalized at current levels. ICVT has most recently found support at $66.

Remember, these are technical comments only. Just as you must be aware of fundamental data for the stocks we recommend based on technical criteria in the report, so too must you be aware of important data regarding delivery, market moving government releases, and other factors that may influence commodity pricing. We try to limit our technical comments to the most actively traded contracts in advance of delivery, but some contracts trade actively right up to delivery while others taper off well in advance. Be sure you check your dates before trading these contracts. For questions regarding this section or additional coverage of commodities email james.west@dorseywright.com.
Data represented in the table below is through 07/14/2020:
Broad Market Commodities Report
| Symbol | Name | Price | PnF Trend | RS Signal | RS Col. | 200 Day MA | Weekly Mom |
|---|---|---|---|---|---|---|---|
| CL/ | Crude Oil Continuous | 40.29 | Negative | Buy | X | 43.94 | -2W |
| DBLCIX | Deutsche Bank Liquid Commodities Index | 262.92 | Negative | Sell | O | 283.64 | +14W |
| DWACOMMOD | DWA Continuous Commodity Index | 459.87 | Negative | Buy | O | 459.57 | -179W |
| GC/ | Gold Continuous | 1812.20 | Positive | Buy | X | 1607.60 | +2W |
| HG/ | Copper Continuous | 2.92 | Positive | Buy | O | 2.57 | +13W |
| ZG/ | Corn (Electronic Day Session) Continuous | 334.75 | Negative | Buy | O | 358.65 | +11W |
When last discussed on June 24th, Doctor Copper was already pushing up against its pre-COVID levels at $2.66, as the shorter-term chart ($0.02 scale) for Copper Continuous HG/ gave six consecutive buy signals following its multi-year low of $2.12 established in March. Today (as of 7/14), HG/ resides at $2.92, on seven consecutive buy signals on the short-term chart and almost marking a full 10% gain from just three weeks prior! Notable qualitative and thematic hypotheses are also at play here. As stated in the Wall Street Journal this morning, “Global investors are piling into bullish wagers on copper prices, sparking the quickest rally in the industrial metal in years and signaling that many money managers remain hopeful about the economic outlook despite rising coronavirus cases in much of the U.S. Keep in mind the wide-ranging and fundamental uses of copper, spanning from electronics to house construction, underscoring its rationale as a leading economic indicator.
The rapidly improving technical picture can largely be attributed to front-month copper futures climbing in 12 consecutive sessions through Monday, reaching their highest level in over a year (wsj.com). Revisiting the shorter-term chart ($0.02 scale) for HG/, the seven consecutive buy signals previously discussed pushed copper into heavily overbought territory, most recently pulling back into a column of Os at $2.90. Despite the reversal down, HG/ remains heavily overbought and well-above its nearest support level at $2.56. Pivoting to the iPath Series B Bloomberg Copper Subindex Total Return ETN JJC, we also find technical strength. JJC sports an optimal fund score of 4.07 and strongly positive score direction of 2.67. Furthermore, the fund trades on five consecutive buy signals and also pulled back in the most recent trading session, now residing just below the top of its ten-week trading band. Weekly and monthly momentum are also both positive for HG/ and JJC, suggesting the potential for additional price appreciation. Further bullish confirmation for HG/ would come with a move to $3.00 on its default chart (pictured below), resulting in a spread triple top break. Further bullish confirmation for JJC would come with a reversal back up into Xs, resulting in a higher bottom.

Average Level
34.26
| AGG | iShares US Core Bond ETF |
| USO | United States Oil Fund |
| DIA | SPDR Dow Jones Industrial Average ETF |
| DVY | iShares Dow Jones Select Dividend Index ETF |
| DX/Y | NYCE U.S.Dollar Index Spot |
| EFA | iShares MSCI EAFE ETF |
| FXE | Invesco CurrencyShares Euro Trust |
| GLD | SPDR Gold Trust |
| GSG | iShares S&P GSCI Commodity-Indexed Trust |
| HYG | iShares iBoxx $ High Yield Corporate Bond ETF |
| ICF | iShares Cohen & Steers Realty ETF |
| IEF | iShares Barclays 7-10 Yr. Tres. Bond ETF |
| LQD | iShares iBoxx $ Investment Grade Corp. Bond ETF |
| IJH | iShares S&P 400 MidCap Index Fund |
| ONEQ | Fidelity Nasdaq Composite Index Track |
| QQQ | Invesco QQQ Trust |
| RSP | Invesco S&P 500 Equal Weight ETF |
| IWM | iShares Russell 2000 Index ETF |
| SHY | iShares Barclays 1-3 Year Tres. Bond ETF |
| IJR | iShares S&P 600 SmallCap Index Fund |
| SPY | SPDR S&P 500 Index ETF Trust |
| TLT | iShares Barclays 20+ Year Treasury Bond ETF |
| GCC | WisdomTree Continuous Commodity Index Fund |
| VOOG | Vanguard S&P 500 Growth ETF |
| VOOV | Vanguard S&P 500 Value ETF |
| EEM | iShares MSCI Emerging Markets ETF |
| XLG | Invesco S&P 500 Top 50 ETF |
Relative strength is a measure of how a stock is performing when compared to something else, in this case the S&P 500 Equal Weighted Index (SPXEWI). Each day the stock's closing price is divided by that of the SPXEWI, the resulting numbers decimal is moved two places and then plotted on a Point & Figure chart. Whenever the relative strength chart shows a double top buy signal (e.g. RS Buy or Positive Relative Strength), it suggests the stock is likely to outperform the market for the foreseeable future. Conversely, whenever the relative strength chart gives a double bottom sell signal (e.g. RS Sell or Negative Relative Strength) it suggests the stock will under-perform the market. Relative strength signals tend to last roughly 18 to 24 months on average. Consequently, changes from buy signals to sell signals (and vice versa) are important to be aware of as they are longer-term implications of a stock's likely performance versus the indices. Using the Point & Figure chart along with the relative strength chart will allow you to better ascertain risk-reward and other trade management tools, but we always want to over-weight our portfolios toward those stocks that are on RS buy signals, giving us the best chance of outperforming the broader market.
In the Optionable Universe, this week we saw 19 relative strength buy signals compared to 19 last week. On the sell side, there were 21 relative strength sell signals compared to 17 last week.
| Symbol | Company | Sector | Price | RS vs Market Signal | RS vs Market Column | RS vs Peer Signal | RS vs Peer Column | Tech Attrib |
|---|---|---|---|---|---|---|---|---|
| AEIS | Advanced Energy Industries | Industrial Goods & Svcs | 70.020 | Buy | X | Buy | X | 5 |
| AMAT | Applied Materials, Inc. | Semiconductors | 62.540 | Buy | X | Buy | X | 5 |
| CRH | CRH plc (Ireland) ADR | Construction | 37.160 | Buy | X | Sell | X | 4 |
| HRI | Herc Holdings Inc | Noncyclical Goods and Svcs | 32.880 | Buy | X | Sell | X | 4 |
| FQVLF | First Quantum Minerals Ltd. | Basic Resources | 10.210 | Buy | X | Buy | X | 5 |
| FBHS | Fortune Brands Home & Security Inc. | Construction | 66.710 | Buy | X | Sell | X | 4 |
| PRCP | Perceptron Inc | Industrial Goods & Svcs | 6.500 | Buy | X | Buy | X | 5 |
| LUNMF | Lundin Mining Corporation | Basic Resources | 6.082 | Buy | X | Buy | X | 5 |
| JKS | JinkoSolar Holding Company Limited | Industrial Goods & Svcs | 20.900 | Buy | X | Buy | X | 5 |
| SCCO | Southern Copper Corporation | Basic Resources | 42.470 | Buy | X | Buy | X | 5 |
| SPWR | Sunpower Corporation | Industrial Goods & Svcs | 9.865 | Buy | X | Buy | X | 5 |
| XENT | Intersect ENT Inc. | Medical Products | 18.130 | Buy | X | Buy | X | 5 |
| TDOC | Teladoc Health Inc. | Healthcare Providers | 209.220 | Buy | X | Buy | X | 5 |
| TPIC | TPI Composites Inc | Industrial Goods & Svcs | 25.780 | Buy | X | Buy | X | 5 |
| NEW | Puxin Ltd. Sponsored ADR | Retail | 8.970 | Buy | X | Sell | X | 3 |
| UPWK | Upwork, Inc. | Technology Services | 13.870 | Buy | X | Sell | X | 4 |
| AEIS.TR | Advanced Energy Industries TR | Industrial Goods & Svcs | 70.020 | Buy | X | Buy | X | 5 |
| SPWR.TR | Sunpower Corporation TR | Industrial Goods & Svcs | 9.865 | Buy | X | Buy | X | 5 |
| FOUR | Shift4 Payments, Inc. Class A | Industrial Goods & Svcs | 37.760 | Buy | X | Buy | X | 5 |
| Symbol | Company | Sector | Price | RS vs Market Signal | RS vs Market Column | RS vs Peer Signal | RS vs Peer Column | Tech Attrib |
|---|---|---|---|---|---|---|---|---|
| ABCB | Abc Bancorp | Banks | 21.010 | Sell | O | Buy | O | 1 |
| ADS | Alliance Data Systems Corporation | Industrial Goods & Svcs | 40.530 | Sell | O | Sell | O | 0 |
| DENN | Denny's Corporation | Cyclical Goods and Services | 8.110 | Sell | O | Sell | O | 0 |
| DVN | Devon Energy Corporation | Oil Companies Secondary | 10.430 | Sell | O | Sell | O | 1 |
| FBNC | First Bancorp North Carolina | Banks | 21.920 | Sell | O | Buy | O | 1 |
| GBCI | Glacier Bancorp Inc | Banks | 32.910 | Sell | O | Buy | O | 2 |
| DIN | DineEquity, Inc. | Cyclical Goods and Services | 35.130 | Sell | O | Buy | O | 1 |
| JAKK | Jakks Pacific | Cyclical Goods and Services | 6.330 | Sell | O | Sell | O | 0 |
| RRGB | Red Robin Gourmet Burgers | Cyclical Goods and Services | 7.480 | Sell | O | Sell | O | 0 |
| TOWN | Towne Bank | Banks | 17.700 | Sell | O | Buy | O | 1 |
| TSN | Tyson Foods, Inc. | Food and Beverage | 58.810 | Sell | O | Buy | O | 1 |
| VHC | Virnetx Holding Corporation | Software | 5.520 | Sell | O | Sell | O | 1 |
| FNHC | FedNat Holding Co | Insurance | 10.630 | Sell | O | Buy | O | 1 |
| EPZM | Epizyme | Biotechnology | 14.790 | Sell | O | Buy | O | 1 |
| ARDX | ARDELYX, INC. | Biotechnology | 6.390 | Sell | O | Sell | O | 1 |
| NLTX | Neoleukin Therapeutics Inc. | Pharmaceuticals | 11.120 | Sell | O | Sell | O | 0 |
| GWB | Great Western Bancorp Inc | Banks | 12.870 | Sell | O | Sell | O | 0 |
| VERI | Veritone Inc | Technology Services | 11.420 | Sell | O | Buy | O | 2 |
| CHX | ChampionX Corp. | Industrial Goods & Svcs | 8.850 | Sell | O | Buy | O | 1 |
| ADS.TR | Alliance Data Systems Corporation TR | Industrial Goods & Svcs | 41.439 | Sell | O | Sell | O | 0 |
| UHT.TR | Universal Health RLTY Inc T TR | Equity REITs | 69.129 | Sell | O | Buy | O | 1 |
| Symbol | Company | Sector | Current Price | Action Price | Target | Stop | Notes |
|---|---|---|---|---|---|---|---|
| BBY | Best Buy Co., Inc. | Retailing | $86.89 | 82 - 90 | 97 | 72 | 4 for 5'er, favored RETA sector, bullish catapult, 2.6% yield, pot. covered write |
| SIMO | Silicon Motion Technology Corporation (Taiwan) ADR | Semiconductors | $44.29 | upper 40s - lower 50s | 75 | 40 | 3 for 5'er, favored SEMI sector, multi consec buy signals,good support 3.4% yield Earnings 7/29 |
| HOLX | Hologic Incorporated | Healthcare | $59.43 | 54 - 59 | 106 | 48 | 4 for 5'er, top third of favored HEAL sector matrix, triple top, pos. mon mom flip, one box from peer RS buy Earnings 7/29 |
| BIG | Big Lots, Inc. | Retailing | $37.96 | hi 30s - low 40s | 66 | 32 | 5 for 5'er, #3 of 82 names in favored RETA sector matrix, pullback from multi-year high, 3%, pot. covered write |
| ABC | AmerisourceBergen Corporation | Drugs | $99.33 | mid 90s to low 100s | 122 | 81 | 4 for 5'er, favored DRUG sector, big base breakout, pullback from multi-year high, 1.7% yield. Earnings 8/5 |
| CREE | Cree Research Inc | Semiconductors | $64.34 | low to mid 60s | $79 | $50 | 5 for 5'er, top 10% of DWASEMI, LT market RS buy signal, bullish triangle, pos mon mom |
| CRM | Salesforce.com, Inc. | Software | $189.56 | hi 190s - low 200s | 240 | 164 | 4 for 5'er, favored SOFT sector matrix, breakout to ATH, pos wkly & mnthly mom flip, LT pos mkt RS |
| SAH | Sonic Automotive Inc. | Retailing | $37.92 | low-to-mid 30s | 36 | 28 | 5 for 5'er, top 20% of favored RETA sector matrix, triple top, pos monthly mom flip, 1.1% yield, good R-R, Earn. 7/30 |
| PYPL | Paypal Holdings Inc | Business Products | $172.30 | high 160s - low 180s | 200 | 138 | 4 for 5'er, top 10% of favored BUSI sector matrix, multi consec buy signals, pullback from ATH, pot. cov write, Earn. 7/29 |
| Symbol | Company | Sector | Current Price | Action Price | Target | Stop | Notes |
|---|---|---|---|---|---|---|---|
| TAP | Molson Coors Company | Food Beverages/Soap | $35.08 | mid 30s | $22 | $41 | 0 for 5'er, consec sell signals, spread triple bottom, LT market RS sell signal, bottom of DWAFOOD Earnings 7/30 |
| ICPT | Intercept Pharmaceuticals Inc | Biomedics/Genetics | $43.45 | mid 40s | $6 | $50 | 0 for 5'er, 127 out of 128 in DWABIOM, consecutive sell signals, LT market RS sell, earnings 8/5 |
| Comment |
|---|
| CMG Chipotle Mexican Grill 'A' R ($1,106.88) - Restaurants - We will now raise our stop to $960 the third potential sell signal on CMG's default chart. |
PYPL Paypal Holdings Inc R ($171.94) - Business Products - PYPL is a 4 for 5'er that ranks in the top decile of the favored business products sector matrix. After giving eight consecutive buy signals PYPL reached an all-time high last week, before pulling back to its nearest level of support at $166 and reversing up into Xs in today's trading, offering an opportune entry point for long exposure. Long exposure may be added in the high $160s through low $180s and we will set our initial stop at $138, which would take out multiple levels of support on PYPL's default chart. Using a modified vertical price objective based on the most recent buy signal we will set our target price at $200. PYPL also offers a potential covered write opportunity on the October '20 call options. Earnings are expected on 7/29.
| 20 | ||||||||||||||||||||||||||||||||||||||||||||||||||||||
| 182.00 | X | 182.00 | ||||||||||||||||||||||||||||||||||||||||||||||||||||
| 180.00 | X | O | 180.00 | |||||||||||||||||||||||||||||||||||||||||||||||||||
| 178.00 | X | O | 178.00 | |||||||||||||||||||||||||||||||||||||||||||||||||||
| 176.00 | 7 | O | 176.00 | |||||||||||||||||||||||||||||||||||||||||||||||||||
| 174.00 | X | X | O | 174.00 | ||||||||||||||||||||||||||||||||||||||||||||||||||
| 172.00 | X | O | X | X | O | x | 172.00 | |||||||||||||||||||||||||||||||||||||||||||||||
| 170.00 | X | O | X | O | X | O | x | 170.00 | ||||||||||||||||||||||||||||||||||||||||||||||
| 168.00 | X | O | X | O | X | O | x | 168.00 | ||||||||||||||||||||||||||||||||||||||||||||||
| 166.00 | X | O | O | O | 166.00 | |||||||||||||||||||||||||||||||||||||||||||||||||
| 164.00 | X | 164.00 | ||||||||||||||||||||||||||||||||||||||||||||||||||||
| 162.00 | X | 162.00 | ||||||||||||||||||||||||||||||||||||||||||||||||||||
| 160.00 | X | X | 160.00 | |||||||||||||||||||||||||||||||||||||||||||||||||||
| 158.00 | X | X | O | X | Mid | 158.00 | ||||||||||||||||||||||||||||||||||||||||||||||||
| 156.00 | 6 | O | X | O | X | 156.00 | ||||||||||||||||||||||||||||||||||||||||||||||||
| 154.00 | X | X | O | X | O | X | 154.00 | |||||||||||||||||||||||||||||||||||||||||||||||
| 152.00 | X | O | X | O | X | O | 152.00 | |||||||||||||||||||||||||||||||||||||||||||||||
| 150.00 | X | O | X | O | 150.00 | |||||||||||||||||||||||||||||||||||||||||||||||||
| 148.00 | X | O | X | 148.00 | ||||||||||||||||||||||||||||||||||||||||||||||||||
| 146.00 | X | X | O | X | 146.00 | |||||||||||||||||||||||||||||||||||||||||||||||||
| 144.00 | X | O | X | O | X | 144.00 | ||||||||||||||||||||||||||||||||||||||||||||||||
| 142.00 | X | O | X | O | 142.00 | |||||||||||||||||||||||||||||||||||||||||||||||||
| 140.00 | X | O | 140.00 | |||||||||||||||||||||||||||||||||||||||||||||||||||
| 138.00 | X | 138.00 | ||||||||||||||||||||||||||||||||||||||||||||||||||||
| 136.00 | X | 136.00 | ||||||||||||||||||||||||||||||||||||||||||||||||||||
| 134.00 | X | 134.00 | ||||||||||||||||||||||||||||||||||||||||||||||||||||
| 132.00 | X | 132.00 | ||||||||||||||||||||||||||||||||||||||||||||||||||||
| 130.00 | X | 130.00 | ||||||||||||||||||||||||||||||||||||||||||||||||||||
| 128.00 | X | 128.00 | ||||||||||||||||||||||||||||||||||||||||||||||||||||
| 126.00 | • | 5 | Bot | 126.00 | ||||||||||||||||||||||||||||||||||||||||||||||||||
| 124.00 | X | • | X | 124.00 | ||||||||||||||||||||||||||||||||||||||||||||||||||
| 122.00 | X | O | • | X | X | 122.00 | ||||||||||||||||||||||||||||||||||||||||||||||||
| 120.00 | 7 | 2 | O | • | X | O | X | 120.00 | ||||||||||||||||||||||||||||||||||||||||||||||
| 118.00 | X | O | X | O | • | X | O | X | 118.00 | |||||||||||||||||||||||||||||||||||||||||||||
| 116.00 | X | O | X | O | • | X | O | 116.00 | ||||||||||||||||||||||||||||||||||||||||||||||
| 114.00 | 5 | X | O | X | O | X | • | X | X | 114.00 | ||||||||||||||||||||||||||||||||||||||||||||
| 112.00 | X | O | X | O | 1 | O | X | O | • | X | O | X | • | 112.00 | ||||||||||||||||||||||||||||||||||||||||
| 110.00 | X | O | X | O | X | C | O | 3 | O | X | • | X | O | X | • | 110.00 | ||||||||||||||||||||||||||||||||||||||
| 108.00 | X | 6 | X | 8 | X | O | X | X | X | O | X | O | X | X | O | • | X | O | • | 108.00 | ||||||||||||||||||||||||||||||||||
| 106.00 | 4 | O | X | O | X | O | X | O | X | O | X | O | X | O | X | O | X | O | • | X | • | 106.00 | ||||||||||||||||||||||||||||||||
| 104.00 | X | O | O | 9 | X | O | X | X | O | X | O | O | X | O | X | O | • | X | • | 104.00 | ||||||||||||||||||||||||||||||||||
| 102.00 | X | O | O | X | O | X | B | X | O | X | O | X | O | • | X | • | 102.00 | |||||||||||||||||||||||||||||||||||||
| 100.00 | X | A | X | O | X | O | O | O | X | O | X | • | X | • | 100.00 | |||||||||||||||||||||||||||||||||||||||
| 99.00 | 3 | X | O | O | X | • | O | X | O | X | O | X | • | X | • | 99.00 | ||||||||||||||||||||||||||||||||||||||
| 98.00 | X | O | X | O | X | • | O | X | O | X | X | O | X | O | • | X | • | 98.00 | ||||||||||||||||||||||||||||||||||||
| 97.00 | X | O | X | O | X | • | O | X | O | X | O | X | O | X | O | X | • | 97.00 | ||||||||||||||||||||||||||||||||||||
| 96.00 | X | O | X | O | X | • | O | X | O | X | O | X | O | X | 4 | X | • | 96.00 | ||||||||||||||||||||||||||||||||||||
| 95.00 | X | O | O | • | O | O | X | O | X | O | X | O | X | • | 95.00 | |||||||||||||||||||||||||||||||||||||||
| 94.00 | X | X | • | O | X | O | X | O | O | X | X | • | 94.00 | |||||||||||||||||||||||||||||||||||||||||
| 93.00 | X | O | X | • | O | X | O | X | O | X | O | X | • | 93.00 | ||||||||||||||||||||||||||||||||||||||||
| 92.00 | X | O | X | • | O | X | O | X | O | X | O | X | • | 92.00 | ||||||||||||||||||||||||||||||||||||||||
| 91.00 | X | O | X | • | O | X | O | X | O | O | X | • | 91.00 | |||||||||||||||||||||||||||||||||||||||||
| 90.00 | X | O | 2 | • | O | X | O | X | O | • | 90.00 | |||||||||||||||||||||||||||||||||||||||||||
| 89.00 | X | O | X | • | O | X | O | X | • | 89.00 | ||||||||||||||||||||||||||||||||||||||||||||
| 88.00 | X | O | X | • | O | X | O | X | • | 88.00 | ||||||||||||||||||||||||||||||||||||||||||||
| 87.00 | X | O | • | O | O | X | • | 87.00 | ||||||||||||||||||||||||||||||||||||||||||||||
| 86.00 | • | X | • | O | X | • | 86.00 | |||||||||||||||||||||||||||||||||||||||||||||||
| 85.00 | O | X | • | O | X | • | 85.00 | |||||||||||||||||||||||||||||||||||||||||||||||
| 84.00 | O | X | • | O | X | • | 84.00 | |||||||||||||||||||||||||||||||||||||||||||||||
| 83.00 | O | X | • | O | • | 83.00 | ||||||||||||||||||||||||||||||||||||||||||||||||
| 82.00 | O | • | • | 82.00 | ||||||||||||||||||||||||||||||||||||||||||||||||||
| 20 |
| ADNT Adient plc ($18.23) - Autos and Parts - ADNT returned to a buy signal with a double top breakout at $18 before moving higher to $18.50. This stock is a solid 3 for 5’er within the favored autos and parts sector that moved into a positive trend in early June. From here, support sits at $15.50, the bullish support line. Note earnings are expected 8/6. |
| AMP Ameriprise Financial ($152.63) - Finance - Ameriprise shares pushed higher today to break through a double top at $152, marking its fifth consecutive buy signal. The 4 for 5'er has been in a positive trend since May and on an RS buy signal versus its peer group since 2010. Monthly momentum recently flipped positive, suggesting potential for higher prices. AMP is actionable at current levels. From here initial support can be found at $144. AMP offers a 2.78% yield and is expected to announce earnings 7/22/20. |
| APAM Artisan Partners Asset Management, Inc ($34.83) - Finance - Shares of APAM continued higher Wednesday to break a double top at $34, marking a third consecutive buy signal. This 4 for 5'er moved to a positive trend in May and ranks in the top quintile of the favored finance sector RS matrix. The overall weight of the evidence is positive here and continues to improve. Exposure may be considered at current levels, with initial support offered at $29 and further support offered at $26. Note that APAM carries a 7.25% yield and has earnings expected on 7/28. |
| APO Apollo Global Management Inc. ($51.86) - Wall Street - APO continued higher Wednesday to break a double top at $52. This 5 for 5'er moved to a positive trend in April and ranks 4th out of 25 names in the wall street sector RS matrix. Monthly momentum also recently flipped positive, suggesting the potential for further upside from here. Those looking to add exposure may consider APO at current levels, with initial support offered at $48 and further support found at $46. The potential for overhead resistance may come initially at $55. Note that APO carries a 5.46% yield and has earnings expected on 7/30. |
| CMI Cummins Inc. ($182.74) - Machinery and Tools - Shares of CMI advanced on Wednesday to break a double top at $180 and move higher to $182, resulting in a fourth consecutive buy signal. The 4 for 5’er ranks in the top half of the favored machinery and tools stock sector matrix and reentered a positive trend in April of this year, each indicating positive relative and absolute strength, respectively. Furthermore, CMI recently experienced a flip to positive monthly momentum, suggesting the potential for additional upside from here. Demand is in control. The next level of resistance resides at $184 while initial support is offered at $172. Note earnings are expected on July 28th. |
| DHI D.R. Horton, Inc. ($59.38) - Building - Shares of DHI climbed on Wednesday to break a spread triple top at $60 and move higher to $61, resulting in a second consecutive buy signal. The 5 for 5’er resides in the top half of the favored building stock sector matrix and demonstrates positive long-term relative strength versus the market, remaining on an RS buy signal since January of 2012. In addition, monthly momentum recently flipped to positive, suggesting the potential for further price appreciation from here. The weight of the evidence is positive for DHI. The next level of resistance resides at $62, the all-time chart high, while initial support is offered at $53. Note earnings are expected on July 28th. |
| HOG Harley-Davidson, Inc. ($28.89) - Leisure - HOG moved higher Wednesday to break a double top at $29, marking its fourth consecutive buy signal. This 3 for 5'er moved to a positive trend in April and ranks in the top third of the favored leisure sector RS matrix. The technical picture continues to strengthen here. Initial support may be found at $23 with further support offered at $22. The bullish support line is also currently found at $20. Note that earnings are expected on 7/21. |
| MAR Marriott International, Inc. ($94.22) - Leisure - MAR returned to a buy signal with a triple top breakout at $91 before moving higher to $94. This stock is a 3 for 5’er that moved back into a positive trend in May. From here, initial support sits at $86. MAR expects earnings on 8/3. |
| ROK Rockwell Automation, Inc. ($220.38) - Electronics - Rockwell Automation shares moved higher today to break a double top at $220 to mark its third consecutive buy signal. The 5 for 5'er has been in a positive trend since April and on an RS buy signal versus the market since 2010. Monthly momentum has been positive for two months, suggesting potential for higher prices. ROK is actionable at current levels. From here, initial support is found at $204. Earnings are expected on 7/23/20. |
| UFPI UFP Industries Inc ($51.26) - Forest Prods/Paper - UFPI advanced on Wednesday to complete a bullish triangle pattern with a break at $50, resulting in a second consecutive buy signal. The 5 for 5’er is currently a holding in the DWA Forest Products Sector Portfolio and has remained on an RS buy signal versus the market since October of 2019, each demonstrating favorable relative strength. In addition, UFPI reentered a positive trend in May of this year and is actionable from an Overbought/Oversold (OBOS) perspective. Demand is in control. Further bullish confirmation would come with a move past current resistance at $51, while initial support is offered at $46. Note earnings are expected on July 22nd. |
| Name | Option Symbol | Action | Stop Loss |
|---|---|---|---|
| Lennar Corporation - $68.32 | LEN2020K65 | Buy the November 65.00 calls at 10.20 | 62.00 |
| Name | Option | Action |
|---|---|---|
| Morgan Stanley ( MS) | Sep. 46.00 Calls | Raise the option stop loss to 4.50 (CP: 6.50) |
| Lowe's Companies, Inc. ( LOW) | Sep. 130.00 Calls | Raise the option stop loss to 12.70 (CP: 14.70) |
| Lowe's Companies, Inc. ( LOW) | Oct. 130.00 Calls | Initiate an option stop loss of 14.00 (CP: 16.00) |
| Name | Option Symbol | Action | Stop Loss |
|---|---|---|---|
| Walgreens Boots Alliance Inc. - $40.68 | WBA2016V45 | Buy the July 45.00 puts at 6.75 | 45.00 |
| Name | Option | Action |
|---|---|---|
| Cognizant Technology Solutions (CTSH) | Oct. 55.00 Puts | Stopped at 60.00 (CP: 59.81) |
| Medtronic PLC (MDT) | Nov. 92.50 Puts | Stopped at 97.00 (CP: 97.03) |
| Vornado Realty Trust (VNO) | Sep. 40.00 Puts | Stopped at 5.00 (CP: 4.90) |
| Capri Holdings Ltd (CPRI) | Nov. 17.50 Puts | Stopped at 17.00 (CP: 16.89) |
| Simon Property Group, Inc. (SPG) | Oct. 65.00 Puts | Stopped at 66.00 (CP: 66.36) |
| Name | Option Sym. | Call to Sell | Call Price | Investment for 500 Shares | Annual Called Rtn. | Annual Static Rtn. | Downside Protection |
|---|---|---|---|---|---|---|---|
| Salesforce.com, Inc. $189.56 | CRM2020K195 | Nov. 195.00 | 12.80 | $88,649.45 | 25.44% | 17.36% | 5.74% |
| Name | Action |
|---|---|
| Micron Technology, Inc. (MU) - 49.71 | Sell the October 50.00 Calls. |
| Bank of America (BAC) - 24.14 | Sell the November 25.00 Calls. |
| D.R. Horton, Inc. (DHI) - 59.15 | Sell the November 60.00 Calls. |
| Applied Materials, Inc. (AMAT) - 62.54 | Sell the October 65.00 Calls. |
| Chegg Inc (CHGG) - 69.20 | Sell the October 75.00 Calls. |
| Big Lots, Inc. (BIG) - 37.96 | Sell the October 42.50 Calls. |
| Best Buy Co., Inc. (BBY) - 86.89 | Sell the September 90.00 Calls. |
| Texas Instruments Incorporated (TXN) - 131.89 | Sell the November 135.00 Calls. |
| Wendy's Company (WEN) - 21.72 | Sell the October 23.00 Calls. |
| Fifth Third Bancorp (FITB) - 18.15 | Sell the November 19.00 Calls. |
| J.P. Morgan Chase & Co. (JPM) - 98.21 | Sell the September 100.00 Calls. |
| Name | Covered Write |
|---|---|
|
|
|
Daily Equity & Market Analysis
Loading, Please Wait...
