With today’s market action, we saw a handful of US major market funds give buy signals which we'll highlight below in addition to the new all-time highs recorded this week for both XLG and QQQ.
Portfolio View - Major Market ETFs
| Symbol | Name | Price | Yield | PnF Trend | RS Signal | RS Col. | Fund Score | 200 Day MA | Weekly Mom |
|---|---|---|---|---|---|---|---|---|---|
| DIA | SPDR Dow Jones Industrial Average ETF Trust | 266.59 | 2.25 | Positive | X | 3.59 | 262.38 | -3W | |
| EEM | iShares MSCI Emerging Markets ETF | 43.01 | 2.08 | Positive | Sell | O | 4.57 | 40.57 | +14W |
| EFA | iShares MSCI EAFE ETF | 62.84 | 2.60 | Positive | Sell | O | 1.40 | 62.94 | -2W |
| FM | iShares MSCI Frontier 100 ETF | 24.08 | 3.30 | Negative | Sell | O | 0.39 | 26.41 | -2W |
| IJH | iShares S&P MidCap 400 Index Fund | 177.74 | 1.81 | Positive | Buy | O | 2.11 | 183.21 | -3W |
| IJR | iShares S&P SmallCap 600 Index Fund | 67.59 | 1.75 | Positive | Buy | O | 1.81 | 72.52 | -2W |
| QQQ | Invesco QQQ Trust | 260.37 | 0.63 | Positive | Buy | X | 5.86 | 213.79 | +3W |
| RSP | Invesco S&P 500 Equal Weight ETF | 103.24 | 2.08 | Positive | Buy | X | 3.26 | 104.54 | -3W |
| SPY | SPDR S&P 500 ETF Trust | 318.92 | 1.79 | Positive | O | 4.20 | 302.43 | -3W | |
| XLG | Invesco S&P 500 Top 50 ETF | 249.13 | 1.46 | Positive | O | 5.63 | 224.57 | +1W |
Additional Comments:
It was a generally positive week across the board as nine out of the 10 major market funds finished in positive territory. The iShares MSCI Frontier 100 ETF FM was the single fund to finish in the red with a loss of -0.04% while the best performing over the last seven days was the SPDR Dow Jones Industrial Average ETF DIA, up 2.92%. Year-to-date, the Invesco QQQ Trust QQQ continues its lead with a double-digit gain of 22.46%, followed by the Invesco S&P 500 Top 50 ETF XLG, up 6.74%. With today’s market action, we saw a handful of US major market funds give buy signals which we'll highlight below in addition to the new all-time highs recorded this week for both XLG and QQQ.
New Intraday Buy Signals: DIA, IJH, & IJR
Today, the SPDR Dow Jones Industrial Average ETF DIA completed a fourth consecutive buy signal with a double top break at $270, confirming that demand is in control. In addition, DIA just experienced a flip to positive monthly momentum after having spent the prior five months negative, suggesting the potential for higher prices. From a scoring perspective, DIA is a solid 3.59 with a strongly positive score direction of 1.11. From current levels, DIA faces resistance at $275, its June high, while initial support sits at $250, a level that has held twice since June.
The iShares S&P MidCap 400 Index Fund IJH also gave a buy signal today, marking the second consecutive to occur on its chart when it broke a triple top at $182. Although this is a positive development, IJH possesses a weak score of 2.11 and has experienced three weeks of negative weekly momentum. IJH has been somewhat range-bound over the last few months; from current levels, initial resistance sits at $184 while its June high sits at $194. From here, initial support is offered at $174. Year-to-date, IJH is down over -13% versus the S&P 500 Index SPX’s loss of -1.03%.
The iShares S&P SmallCap 600 Index Fund IJR returned to a buy signal with Wednesday’s market action with a double top breakout at $70. IJR has now formed solid support at $65, a level that it has tested on three previous occasions. Like IJH, IJR has traded in a bit of a range over the last few months and from here, faces overhead resistance at $71 and $75. Weekly momentum has been negative for two weeks and IJH remains in negative territory for the year, down over -19%. Today’s breakout is positive however we will continue to monitor for additional follow through to the upside.

Breakout on SPY
On Monday, the SPDR S&P 500 ETF Trust SPY gave a fourth consecutive buy signal on its default chart with a double top breakout at $320. With today’s action, the more sensitive 2-point chart for SPY has formed a spread triple top at $322, which would be broken with a move to $324. Currently, SPY has a solid fund score of 4.20 with a positive score direction of 1.25. Furthermore, monthly momentum just flipped positive and SPY continues to trade well above its bullish support line. From current levels, the default chart for SPY faces resistance here at $320, with the last remaining level of resistance lying at the $335 level, the fund’s all-time high from February. Initial supports sits at $300. New positions are welcome here as SPY has a relatively normal OBOS% reading of 41% overbought.

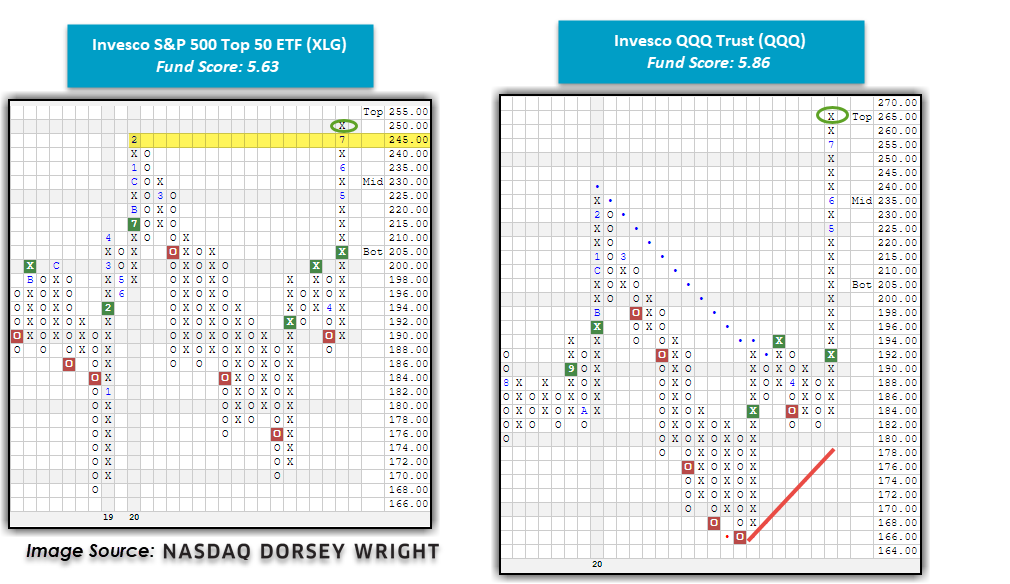
New All-Time Highs for XLG & QQQ
Earlier this week, the Invesco S&P 500 Top 50 ETF XLG printed an X at $250, marking a new all-time high for the fund. Recall that XLG returned to a buy signal in April at $205 and has continued to trade on a stem ever since. Both weekly and monthly momentum have flipped positive, suggesting the potential for higher prices for the large-cap fund. Additionally, XLG has a strong fund score of 5.63, adding to the positive technical picture. Currently, XLG is 64% overbought so those looking to initiate new positions could scale in here or wait for a minor pullback. Since the default chart is on a stem, we will use the fund’s 2-point chart to identify additional support levels. The 2-point chart reversed up into X’s with today’s action, establishing initial support at $244, while additional support sits at the $323 level.
The Invesco QQQ Trust QQQ also printed a new all-time high on Monday with a rally to $265. Similar to XLG, QQQ is up on a significant stem and initial support isn't offered until the $182 level. The 1 point per box chart, however, shows initial support available at $253 with additional support at $238. QQQ has a strong fund score of 5.86 and has experienced three weeks of positive weekly momentum and three months of positive monthly momentum. This recent move to the upside has pushed QQQ into overbought territory with an OBOS% reading of 78%, so those looking to initiate new long positions would best be served to scale in or wait for a pullback/normalization of the 10-week trading band.