Daily Summary
Fund Score Overview
The Money Market Percentile Rank (MMPR) continues lower, while convertible bonds push higher.
Daily Equity Roster
Today's featured stock is Jack Henry & Associates Inc (JKHY)
Analyst Observations
ATSG, DCO, GBT, HOV, MS, HELE, SCHW, ESTC, ADBE, & DIS
Daily Option Ideas
Call: Valero Energy (VLO), Put: Molson Coors (TAP), Covered Write: JP Morgan Chase (JPM)
ESS Webinar Series Replays: We are excited to bring you replays of each of the Enhanced Security Selection (ESS) package webinars that we have conducted over the past four weeks. These webinars provide some background information on the tools you get with the ESS package and offer potential implementation ideas to put these tools to work. Each webinar is approximately an hour long. Please see the breakdown of topics and their respective video replays listed below.
- May 7th - The Matrix tool & Models
- May 14th - Fund Scores & Asset Class Group Scores
- May 22nd - FSM Models
- May 28th - Team Builder
Market Webinar Replay: We also have a video replay and slides available from our lastest Market Update Webinar from Monday, June 1st:
Beginners Series Webinar - Join us on Friday, June 5th at 2 PM (ET) for our NDW Beginners Series Webinar. This week's topic is Reading a Point & Figure Chart. Register here.
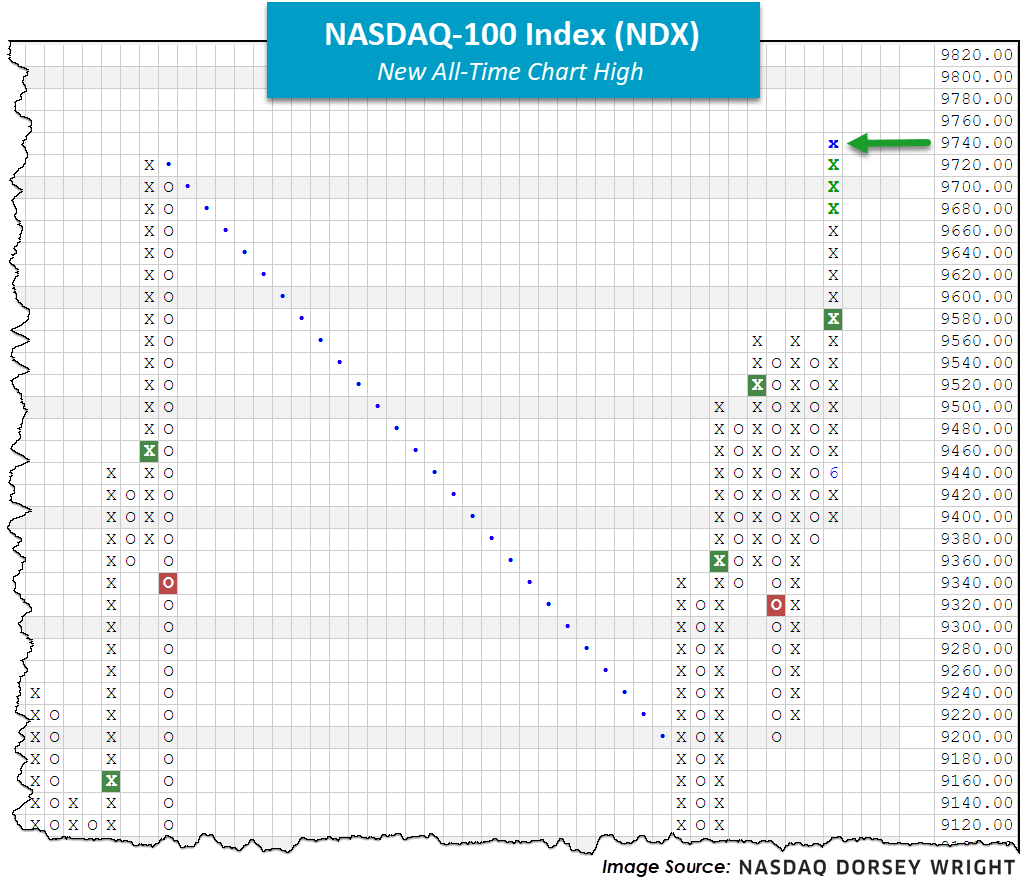
Just like that, we’re back. Intraday action on Thursday pushed the Nasdaq 100 Index NDX to an all-time chart high at 9740. Since posting a bottom at the end of March, NDX has rallied over 38%, contributing to an astounding year-to-date return north of 11% (data from 3/23 - 6/3). As recently highlighted, the overwhelming strength from the large-cap growth (technology and friends in particular) camp continues to be evident here. Comparatively speaking, the S&P 500 SPX has rallied over 39% since March 23rd while the Dow Jones Industrial Average DJIA has rebounded over 41%; however, NDX is the only major equity index of the three with positive year-to-date returns, as SPX and DJIA trail at -3.34% and -7.95%, respectively (as of 6/3).
The findings above and those similarly discussed in yesterday's Weekly DALI &US Equity Overview (which can be accessed here) speak to the velocity of the equity markets’ recent movement, to the downside and upside. From the previously linked research piece, it took the S&P just 16 days to rally 20% off the March 23rd low! In looking back at all the major bottoms in the market, the average length of time before rallying 20% is 84 days or nearly three months, a far cry from 16 days. As we stand today (6/4), the S&P 500 and Nasdaq 100 default charts have successfully returned to a positive trend, while the DJIA still has some work to do. Those looking to monitor these charts for further action should make sure to use the "Set Alert" button at the top of each chart.

The CBOE S&P 500 Volatility Index VIX, which is often referred to as the ‘fear index’ is a measure of uncertainty or volatility in the US equity market. The VIX uses data from S&P 500 index options to project the expected volatility in the market as an annualized figure. So, when the VIX reached 85 in March amid the COVID19-induced sell-off, it implied an annualized volatility level of 85% and during that period we saw some of the most volatile trading days on record. Although the VIX is often referred to as the fear index, a high VIX is not bearish in and of itself. The index gauges expected volatility in either direction, up or down, as we have experienced over the last two months as the market has rallied strongly while the VIX has remained elevated. Of course, the VIX is a volatility expectation, it does not actually determine the level of volatility that is ultimately realized. Although market makers do use the VIX as input when analyzing how much liquidity to provide to the market, so we can’t say that it has no effect on actual volatility.
In any case, the heightened levels of volatility this year and the fact that the VIX remains above its long-term average made us curious how accurate the VIX estimate was in predicting the actual level of realized volatility. To answer this question, we looked at the daily VIX levels since the beginning of 2004 (when the index calculation was changed) and compared them to the daily movement of the S&P 500. As mentioned above, the VIX is an annualized number, so to convert it to a daily number we divided by the square root of 252 (the number of trading days in a year). We then compared the daily VIX number (from the prior’s day close) to the daily return of the S&P 500 (absolute value) and the day’s range ((high-low)/previous close). It is worth noting that the VIX is actually an estimate of expected 30-day volatility, but, the daily conversion we’ve described above is regularly used by traders and other market participants as a rule of thumb for gauging the magnitude of daily market moves. If you regularly watch CNBC or Bloomberg TV, on multiple occasions you have probably heard something like “the VIX is currently at 30, which implies a daily move of about 2%.”
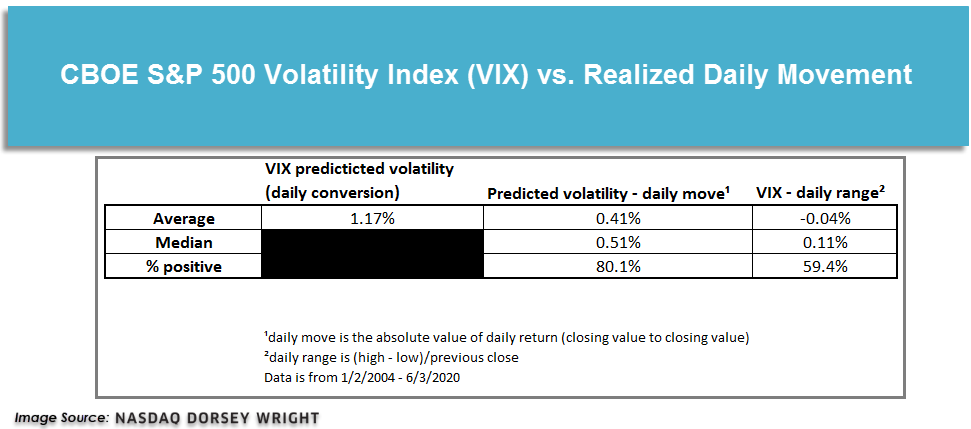
As the table above shows, since 2004, the VIX has had an average level of 18.6, which implies daily volatility of around 1.17%. which is 0.41% greater than the average daily move of the S&P 500. Interestingly, compared to the average daily range of the S&P 500, the VIX is almost spot on, undershooting by just 4 basis points (0.04%). We can also see that just over 80% of the time the daily VIX conversion less the actual daily move is positive, meaning that it overshoots the daily change in the index fairly consistently. Looking at the daily range comparison we see that even though the average difference is slightly negative, just the figure is positive 59% of the time, meaning that it also most often overestimates the daily range of the S&P 500. So, while the VIX is certainly a useful tool for judging the overall level of volatility we may encounter in the market, it tends to overestimate the actual movement of the S&P 500 on any given day.
The Money Market Percentile Rank (MMPR) has continued to decline over the past week, falling to a recent posting of 27.46%. As a refresher, this reading tracks the relative position of the US money market group against the rest of the groups on the Asset Class Group Scores (ACGS) system, and we have now seen the reading fall below 30% for the first time since it began to rise in early March. Interestingly enough, we can also see that the MMPR never sat in the 30s during its ascent, jumping from a level of 23% to 47% on March 12th. This exemplifies the swift moves this reading is capable of, and while we have yet to see a drastic tick to the downside, that is certainly something to keep an eye out for as we continue to see the level drop.
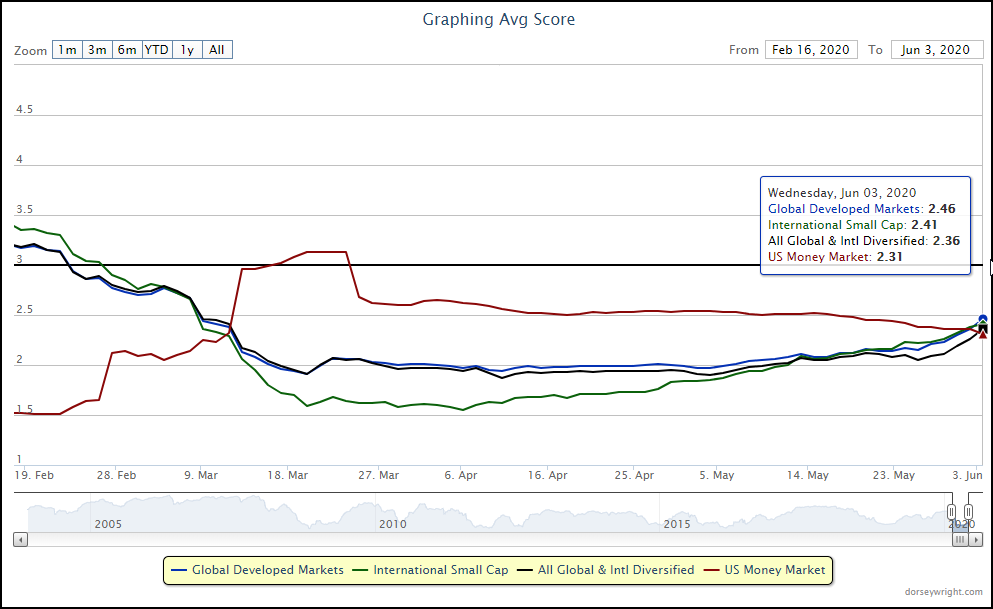
One point we have continued to monitor in the recent movement of the MMPR has been what groups have moved above the US money market group, as the actual average score of the group has declined but continued to show rather muted score changes. The past few days have seen some notable improvement in unfavorable areas, with MLPs advancing ahead of US money market. The bulk of other groups that have risen above money market come from foreign equity classifications, as we have seen the all global & international diversified, international small-cap, and global developed markets groups push higher towards the 2.50 score threshold. This indicates a continuing broadening of improvement across foreign equities, following the increased participation we have seen in US markets.
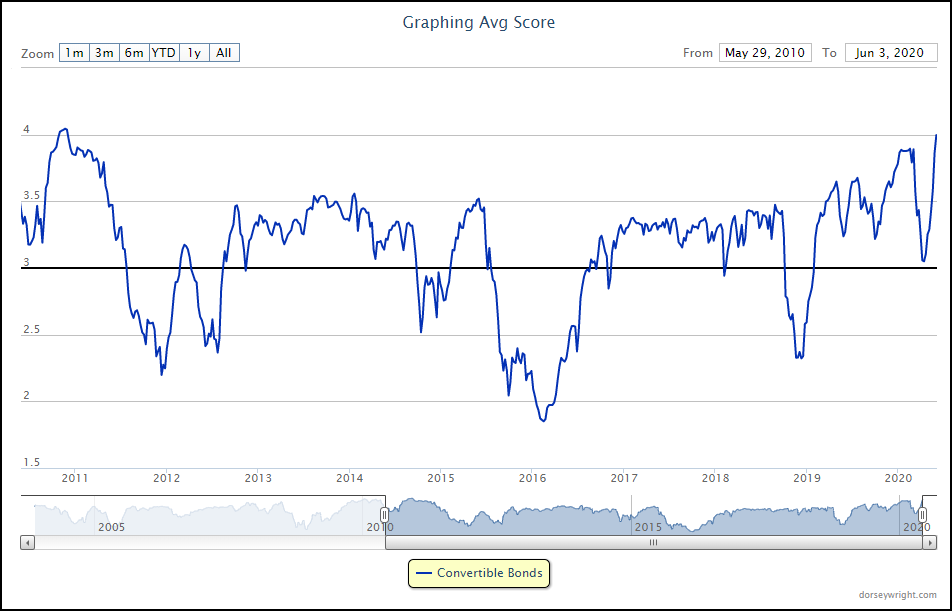
The top of the ACGS rankings continues to be dominated by domestic equity-focused areas, as there are now 10 such groups that score above the sought-after 4 score line. One of the more surprising areas that have seen improvement has been convertible bonds, which rose into above the blue threshold this week with a recent average score posting of 4.04. Convertible bonds tend to be more correlated to equity movement given their structure, however, it is certainly noteworthy to see such significant improvement from a more defensively-minded group on the backs of broadening strength in domestic equities. The recent score posting of the group actually marks its highest level since November of 2010, when the group saw an average score above 4.00 for about a month before moving back south. This will also be an area to monitor as we move towards the halfway point of the year, especially given its current overbought status created by the recent price rally.

Average Level
41.49
| AGG | iShares US Core Bond ETF |
| USO | United States Oil Fund |
| DIA | SPDR Dow Jones Industrial Average ETF |
| DVY | iShares Dow Jones Select Dividend Index ETF |
| DX/Y | NYCE U.S.Dollar Index Spot |
| EFA | iShares MSCI EAFE ETF |
| FXE | Invesco CurrencyShares Euro Trust |
| GLD | SPDR Gold Trust |
| GSG | iShares S&P GSCI Commodity-Indexed Trust |
| HYG | iShares iBoxx $ High Yield Corporate Bond ETF |
| ICF | iShares Cohen & Steers Realty ETF |
| IEF | iShares Barclays 7-10 Yr. Tres. Bond ETF |
| LQD | iShares iBoxx $ Investment Grade Corp. Bond ETF |
| IJH | iShares S&P 400 MidCap Index Fund |
| ONEQ | Fidelity Nasdaq Composite Index Track |
| QQQ | Invesco QQQ Trust |
| RSP | Invesco S&P 500 Equal Weight ETF |
| IWM | iShares Russell 2000 Index ETF |
| SHY | iShares Barclays 1-3 Year Tres. Bond ETF |
| IJR | iShares S&P 600 SmallCap Index Fund |
| SPY | SPDR S&P 500 Index ETF Trust |
| TLT | iShares Barclays 20+ Year Treasury Bond ETF |
| GCC | WisdomTree Continuous Commodity Index Fund |
| VOOG | Vanguard S&P 500 Growth ETF |
| VOOV | Vanguard S&P 500 Value ETF |
| EEM | iShares MSCI Emerging Markets ETF |
| XLG | Invesco S&P 500 Top 50 ETF |
Long Ideas
| Symbol | Company | Sector | Current Price | Action Price | Target | Stop | Notes |
|---|---|---|---|---|---|---|---|
| DGX | Quest Diagnostics Incorporated | Healthcare | $119.50 | mid $110s to $130s | $132 | $92 | 4 for 5'er, pullback from AT high, consec buy signals, top 25% of favored healthcare sector, 2.02% yield |
| VRSK | Verisk Analytics, Inc. | Business Products | $170.76 | high 150s to 170s | $184 | $126 | 5 for 5'er, LT market & peer RS buy, consec buy signals, LT pos trend |
| BGS | B&G Foods, Inc. | Food Beverages/Soap | $24.05 | 22 - 24 | 28.50 | 18 | 5 for 5'er, #3 of 70 names in favored FOOD sector matrix, bullish catapult, 8.6% yield, pot. cov write |
| INTC | Intel Corporation | Semiconductors | $61.93 | hi 50s - mid 60s | 73 | 51 | 3 for 5'er, favored SEMI sector matrix, spread triple top, 2.1% yield, pot. covered write |
| CMCSA | Comcast Corporation | Media | $41.30 | hi 30s - low 40s | 48 | 32 | 4 for 5'er, LT mkt RS buy signal, spread quad top breakout, 2.3% yield |
| COP | ConocoPhillips | Oil | $45.12 | low-to-mid 40s | 60 | 35 | 4 for 5'er, top half of favored oil sector matrix, quad top breakout, pos trend flip, 4% yield, R-R>2.0 |
| MDLZ | Mondelez International Inc. | Food Beverages/Soap | $52.09 | 50s | $70 | $41 | 4 for 5'er, consec buy signals, fav DWAFOOD, pos weekly mom flip, 2.19% yield |
| CVX | Chevron Corporation | Oil | $97.18 | uppers 90s | 112 | 77 | 4 for 5'er, favored OIL sector matrix, multiple recent breakouts, 5.6% yield, pot. covered write |
| CONE | CyrusOne Inc | Real Estate | $74.77 | mid-to-upper 70s | 99 | 61 | 5 for 5'er, top 25% of favored REAL sector matrix, spread triple top, pos monthly mom flip, 2.7% yield |
| JKHY | Jack Henry & Associates Inc | Software | $178.40 | $180s to upper $190s | $268 | $142 | 4 for 5'er, LT pos trend since 09, pullback from AT high, LT market RS buy signal |
Short Ideas
| Symbol | Company | Sector | Current Price | Action Price | Target | Stop | Notes |
|---|---|---|---|---|---|---|---|
| HSBC | HSBC Holding PLC (United Kingdom) ADR | Banks | $25.26 | (26 - 23) | 17 | 28 | 0 for 5'er, bottom third of unfavored BANK sector matrix, LT neg mkt RS, multi sell signals, lower tops and lower bottoms |
Removed Ideas
| Symbol | Company | Sector | Current Price | Action Price | Target | Stop | Notes |
|---|---|---|---|---|---|---|---|
| ICE | IntercontinentalExchange Inc. | Wall Street | $97.88 | 90s | 125 | 77 | See follow comment below. |
Follow-Up Comments
| Comment |
|---|
| ATSG Air Transport Services Group Inc. R ($23.13) - Aerospace Airline - Raise stop to $18.50, the bullish support line. |
| ICE IntercontinentalExchange Inc. R ($95.16) - Wall Street - Okay to add new exposure at current levels. We will abide by the $77 stop. |
DWA Spotlight Stock
JKHY Jack Henry & Associates Inc R ($178.21) - Software - JKHY is a solid 4 for 5’er within the favored software sector that has maintained a positive trend since June 2009. Additionally, JKHY has demonstrated superior long-term strength versus the broader market since giving a market RS buy signal in October 2008. After returning to a buy signal at $166 last month, this software stock moved as high as $194, marking a new all-time high. JKHY then experienced a slight pullback to $176, however, with the most recent action, the chart has returned to a column of Xs. Okay to add new exposure in the $180s – upper $190s. We will set our initial stop loss at $142 and we will use the stock’s bullish price objective of $268 as our near-term price target.
| 19 | 20 | ||||||||||||||||||||||||||||||||||||||||||||||||||||
| 194.00 | X | 194.00 | |||||||||||||||||||||||||||||||||||||||||||||||||||
| 192.00 | X | O | 192.00 | ||||||||||||||||||||||||||||||||||||||||||||||||||
| 190.00 | X | O | 190.00 | ||||||||||||||||||||||||||||||||||||||||||||||||||
| 188.00 | X | O | 188.00 | ||||||||||||||||||||||||||||||||||||||||||||||||||
| 186.00 | X | O | 186.00 | ||||||||||||||||||||||||||||||||||||||||||||||||||
| 184.00 | X | O | 184.00 | ||||||||||||||||||||||||||||||||||||||||||||||||||
| 182.00 | X | O | 6 | 182.00 | |||||||||||||||||||||||||||||||||||||||||||||||||
| 180.00 | X | O | X | 180.00 | |||||||||||||||||||||||||||||||||||||||||||||||||
| 178.00 | X | O | X | 178.00 | |||||||||||||||||||||||||||||||||||||||||||||||||
| 176.00 | X | O | 176.00 | ||||||||||||||||||||||||||||||||||||||||||||||||||
| 174.00 | X | X | 174.00 | ||||||||||||||||||||||||||||||||||||||||||||||||||
| 172.00 | X | O | X | X | 172.00 | ||||||||||||||||||||||||||||||||||||||||||||||||
| 170.00 | X | O | X | O | X | X | X | 170.00 | |||||||||||||||||||||||||||||||||||||||||||||
| 168.00 | X | O | X | O | X | O | X | O | X | Mid | 168.00 | ||||||||||||||||||||||||||||||||||||||||||
| 166.00 | X | O | X | O | X | O | X | O | X | 166.00 | |||||||||||||||||||||||||||||||||||||||||||
| 164.00 | X | O | X | X | O | X | O | X | O | X | X | 164.00 | |||||||||||||||||||||||||||||||||||||||||
| 162.00 | X | X | O | X | O | X | X | X | X | O | X | O | O | X | O | X | 162.00 | ||||||||||||||||||||||||||||||||||||
| 160.00 | 9 | O | X | O | X | O | X | O | X | O | X | O | X | O | O | X | O | X | 160.00 | ||||||||||||||||||||||||||||||||||
| 158.00 | X | O | X | O | X | O | X | O | X | O | X | O | X | X | O | X | 5 | 158.00 | |||||||||||||||||||||||||||||||||||
| 156.00 | X | A | X | O | X | O | X | O | X | O | X | O | X | O | X | O | 156.00 | ||||||||||||||||||||||||||||||||||||
| 154.00 | X | O | X | 2 | O | 3 | O | X | O | X | O | X | O | X | O | X | 154.00 | ||||||||||||||||||||||||||||||||||||
| 152.00 | X | O | X | O | X | X | 1 | O | X | O | O | X | O | X | O | X | 4 | X | 152.00 | ||||||||||||||||||||||||||||||||||
| 150.00 | X | O | X | O | X | O | X | X | X | O | X | O | X | O | X | O | X | O | X | O | X | 150.00 | |||||||||||||||||||||||||||||||
| 148.00 | X | O | O | X | O | X | O | 9 | X | X | O | X | O | X | O | O | X | O | X | O | X | O | X | 148.00 | |||||||||||||||||||||||||||||
| 146.00 | X | O | B | X | O | X | O | X | O | B | O | X | C | O | O | O | X | O | X | 146.00 | |||||||||||||||||||||||||||||||||
| 144.00 | X | O | X | 5 | X | X | O | X | O | X | O | O | X | O | 144.00 | ||||||||||||||||||||||||||||||||||||||
| 142.00 | X | O | C | X | O | X | O | X | O | A | X | O | X | 142.00 | |||||||||||||||||||||||||||||||||||||||
| 140.00 | 8 | O | X | O | 4 | O | 7 | O | X | O | O | X | 140.00 | ||||||||||||||||||||||||||||||||||||||||
| 138.00 | X | O | X | O | X | O | X | O | X | O | X | 138.00 | |||||||||||||||||||||||||||||||||||||||||
| 136.00 | X | O | X | O | X | 3 | O | 6 | O | X | O | X | 136.00 | ||||||||||||||||||||||||||||||||||||||||
| 134.00 | 7 | O | O | 2 | O | X | O | X | 8 | O | X | 134.00 | |||||||||||||||||||||||||||||||||||||||||
| 132.00 | X | O | X | O | X | O | X | O | X | 132.00 | |||||||||||||||||||||||||||||||||||||||||||
| 130.00 | X | O | X | O | X | O | O | X | Bot | 130.00 | |||||||||||||||||||||||||||||||||||||||||||
| 128.00 | X | O | 1 | O | X | O | X | 128.00 | |||||||||||||||||||||||||||||||||||||||||||||
| 126.00 | X | 6 | O | X | O | O | X | 126.00 | |||||||||||||||||||||||||||||||||||||||||||||
| 124.00 | X | O | X | X | O | X | O | 124.00 | |||||||||||||||||||||||||||||||||||||||||||||
| 122.00 | X | X | O | X | O | X | O | 122.00 | |||||||||||||||||||||||||||||||||||||||||||||
| 120.00 | X | O | X | O | X | O | X | 120.00 | |||||||||||||||||||||||||||||||||||||||||||||
| 118.00 | X | O | X | 4 | 5 | 118.00 | |||||||||||||||||||||||||||||||||||||||||||||||
| 116.00 | X | 3 | 116.00 | ||||||||||||||||||||||||||||||||||||||||||||||||||
| 19 | 20 |

| ADBE Adobe Systems Incorporated ($385.50) - Software - ADBE broke a double top at $392 and is now trading at new all-time highs. This breakout marks the seventh consecutive buy signal, confirming that demand is in control. This stock is a 4 for 5’er that has maintained a long-term RS buy signal since August 2015. From here, initial support sits at $364. Note earnings are expected 6/11. |
| ATSG Air Transport Services Group Inc. ($22.32) - Aerospace Airline - Air Transport Services shares broke a double top at $23 today, marking a fourth consecutive buy signal. This 3 for 5'er moved to a positive trend in April and has recently experienced a flip to positive monthly momentum, suggesting the potential for further gains. Okay to add long exposure here as the weight of the evidence is positive. Note that initial support is offered at $19.50. |
| DCO Ducommun Inc ($36.06) - Aerospace Airline - Ducommun shares broke a double top at $35 today, marking a second consecutive buy signal before advancing further to $36. This 3 for 5'er ranks 4th of 42 names included in the favored aerospace airline sector RS matrix and moved to a market RS buy signal in mid-May. The technical picture is improving. From here, the bearish resistance line for the stock is found at $42 and intial support is offered at $31. Note that DCO is heavily overbought with today's action. |
| DIS The Walt Disney Company ($122.87) - Media - DIS broke a double top at $124 on Thursday, marking the second consecutive buy signal on the chart. DIS is a solid 4 for 5’er that has maintained superior strength versus the market since September 2008. In late April, DIS returned to a positive trend. Demand is in control. From here, support is offered at $116 and $100, the bullish support line. |
| ESTC Elastic NV ($84.94) - Software - Shares of ESTC pulled back on Thursday to break a double bottom at $85, initiating a shakeout pattern and making the stock actionable on the first reversal back up into Xs. The move comes after 5 consecutive buy signals and reentrance into a positive trend. The 4 for 5’er ranks 12th out of 113 names in the favored software stock sector matrix and recently returned to an RS buy signal versus the market on May 12th. Additionally, weekly and monthly momentum are now both positive, suggesting the potential for higher prices from here. Demand is in control. Resistance resides at $90 while further support is offered at $78. |
| GBT Global Blood Therapeutics Inc ($66.30) - Drugs - Global Blood Therapeutics shares reversed lower today, breaking a triple bottom at $66 to mark a fourth consecutive sell signal. Today's break also signifies a negative trend reversal for the stock, demoting GBT to a 2 for 5'er. Additionally, both weekly and monthly momentum have recently flipped negative, suggesting the potential for further declines. Avoid. |
| HELE Helen of Troy Limited ($183.12) - Household Goods - Shares of HELE broke a double top at $188 on Thursday to give a third consecutive buy signal and complete a bullish catapult pattern. The 5 for 5’er ranks 8th out of 31 names in the favored household goods stock sector matrix and demonstrates positive long-term relative strength versus the market, remaining on an RS buy signal since July of 2009. In addition, HELE recently reentered a positive trend on April 29th. The weight of the evidence is positive here; however, those looking to initiate new long exposure may consider HELE on a pullback, as it is nearing the top of its trading band. The next level of resistance resides at $198, the stock’s all-time high, while initial support is offered at $178. |
| HOV Hovnanian Enterprises, Inc. ($20.01) - Building - Hovnanian shares broke a double top at $18 today in response to earnings, marking a third consecutive buy signal before advancing further to $21. Today's break also signifies a positive trend reversal for the stock, promoting HOV to a 5 for 5'er. HOV ranks 6th of 72 names included in the favored building sector RS matrix. Additionally, HOV moved to a market RS buy signal in mid-May, confirming long-term strength. Demand is clearly in control - however, today's action puts the stock in heavily overbought territory. Those considering long exposure may be well served to wait for a pullback, noting that initial support is offered at $15.50. |
| MS Morgan Stanley ($47.74) - Wall Street - Morgan Stanley shares completed a bullish catapult with today's break at $48, marking a second consecutive buy signal. This 3 for 5'er returned to a positive trend in late May and has maintained a market RS buy signal since June of 2013. Additionally, MS ranks in the top half of the wall street sector RS matrix. Although demand is in control, those seeking long exposure may be well served to wait for a pullback, as MS is heavily overbought here. Note that support is offered at $44 and that the stock carries a yield of 2.98%. |
| SCHW The Charles Schwab Corporation ($40.20) - Wall Street - Charles Schwab shares returned to a buy signal with a double top break at $40 today. This action signifies a positive trend reversal for the stock, promoting SCHW to a 3 for 5'er. Additionally, SCHW has maintained a market RS buy signal since December of 2016 and recently witnessed a flip to positive weekly momentum, suggesting the potential for further gains. Okay to add here on the breakout as the weight of the evidence is positive. Note that support is offered at $32 and that SCHW carries a yield of 1.82%. |
Daily Option Ideas for June 4, 2020
New Recommendations
| Name | Option Symbol | Action | Stop Loss |
|---|---|---|---|
| Valero Energy Corp - $70.05 | VLO2018I65 | Buy the September 65.00 calls at 10.35 | 63.00 |
Follow Ups
| Name | Option | Action |
|---|---|---|
| QUALCOMM Incorporated ( QCOM) | Jul. 70.00 Calls | Raise the option stop loss to 14.55 (CP: 16.55) |
| Dollar General Corp. ( DG) | Aug. 175.00 Calls | Stopped at 18.20 (CP: 15.60) |
| PACCAR Inc. ( PCAR) | Aug. 65.00 Calls | Raise the option stop loss to 9.50 (CP: 11.50) |
| Square Inc ( SQ) | Sep. 80.00 Calls | Stopped at 15.65 (CP: 14.10) |
New Recommendations
| Name | Option Symbol | Action | Stop Loss |
|---|---|---|---|
| Molson Coors Company - $42.31 | TAP2016V47.5 | Buy the October 47.50 puts at 7.20 | 49.00 |
Follow Up
| Name | Option | Action |
|---|---|---|
| Textron Inc. (TXT) | Sep. 35.00 Puts | Stopped at 35.00 (CP: 36.75) |
New Recommendations
| Name | Option Sym. | Call to Sell | Call Price | Investment for 500 Shares | Annual Called Rtn. | Annual Static Rtn. | Downside Protection |
|---|---|---|---|---|---|---|---|
| J.P. Morgan Chase & Co. $104.27 | JPM2018I110 | Sep. 110.00 | 6.30 | $50,578.15 | 26.48% | 17.61% | 4.87% |
Still Recommended
| Name | Action |
|---|---|
| Micron Technology, Inc. (MU) - 48.92 | Sell the October 50.00 Calls. |
| Intel Corporation (INTC) - 61.93 | Sell the September 65.00 Calls. |
| Live Nation Entertainment Inc. (LYV) - 53.91 | Sell the October 55.00 Calls. |
| Phillips 66 (PSX) - 83.73 | Sell the August 82.50 Calls. |
| Hess Corporation (HES) - 52.11 | Sell the August 55.00 Calls. |
The Following Covered Write are no longer recommended
| Name | Covered Write |
|---|---|
|
|
|


