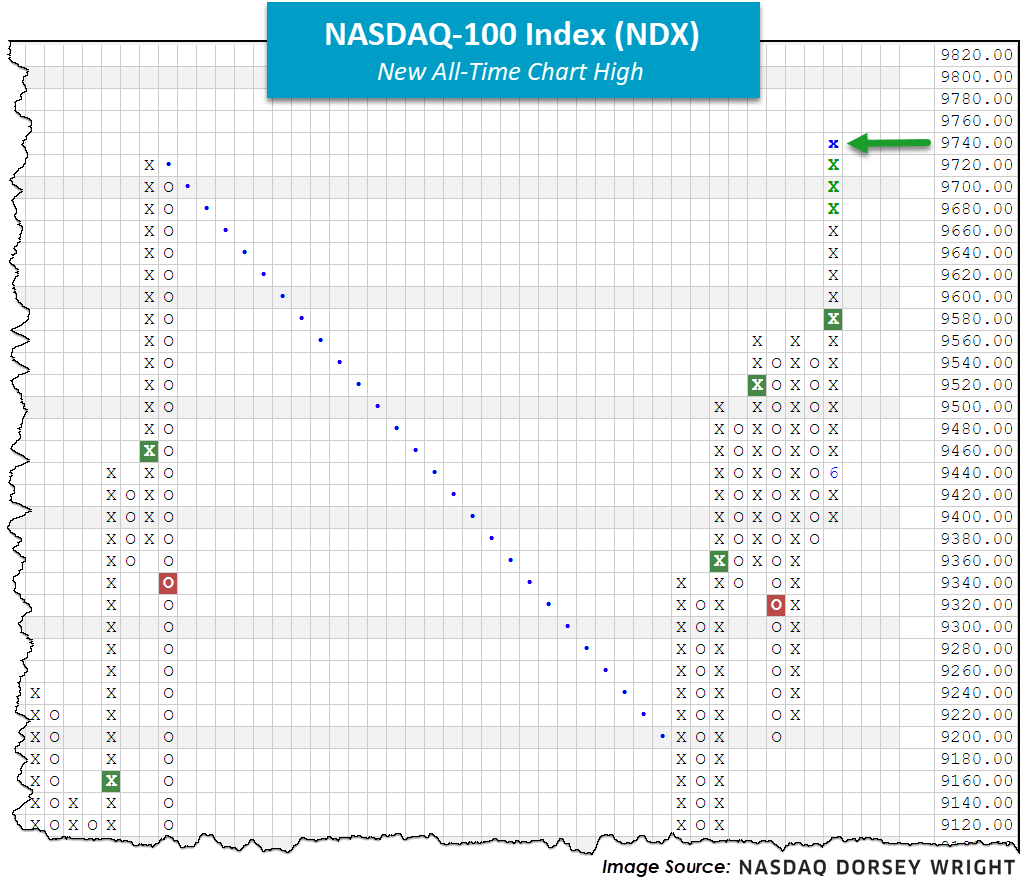
And just like that, the Nasdaq 100 (NDX) is back at all-time highs
ESS Webinar Series Replays: We are excited to bring you replays of each of the Enhanced Security Selection (ESS) package webinars that we have conducted over the past four weeks. These webinars provide some background information on the tools you get with the ESS package and offer potential implementation ideas to put these tools to work. Each webinar is approximately an hour long. Please see the breakdown of topics and their respective video replays listed below.
- May 7th - The Matrix tool & Models
- May 14th - Fund Scores & Asset Class Group Scores
- May 22nd - FSM Models
- May 28th - Team Builder
Market Webinar Replay: We also have a video replay and slides available from our lastest Market Update Webinar from Monday, June 1st:
Beginners Series Webinar - Join us on Friday, June 5th at 2 PM (ET) for our NDW Beginners Series Webinar. This week's topic is Reading a Point & Figure Chart. Register here.
Just like that, we’re back. Intraday action on Thursday pushed the Nasdaq 100 Index NDX to an all-time chart high at 9740. Since posting a bottom at the end of March, NDX has rallied over 38%, contributing to an astounding year-to-date return north of 11% (data from 3/23 - 6/3). As recently highlighted, the overwhelming strength from the large-cap growth (technology and friends in particular) camp continues to be evident here. Comparatively speaking, the S&P 500 SPX has rallied over 39% since March 23rd while the Dow Jones Industrial Average DJIA has rebounded over 41%; however, NDX is the only major equity index of the three with positive year-to-date returns, as SPX and DJIA trail at -3.34% and -7.95%, respectively (as of 6/3).
The findings above and those similarly discussed in yesterday's Weekly DALI &US Equity Overview (which can be accessed here) speak to the velocity of the equity markets’ recent movement, to the downside and upside. From the previously linked research piece, it took the S&P just 16 days to rally 20% off the March 23rd low! In looking back at all the major bottoms in the market, the average length of time before rallying 20% is 84 days or nearly three months, a far cry from 16 days. As we stand today (6/4), the S&P 500 and Nasdaq 100 default charts have successfully returned to a positive trend, while the DJIA still has some work to do. Those looking to monitor these charts for further action should make sure to use the "Set Alert" button at the top of each chart.

