
Most Requested Symbols

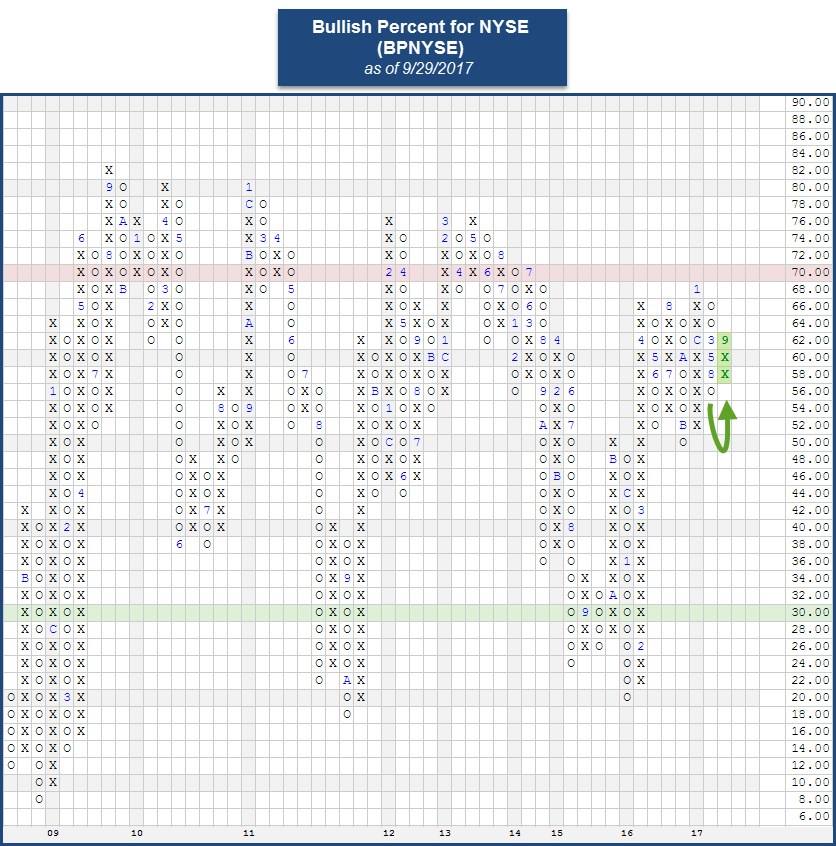
After Friday’s action, we witnessed three major market Bullish Percent charts return to Xs. The Bullish Percent for the New York Stock Exchange BPNYSE reversed back up into a column of X’s at 62%. This risk barometer for the US equity market had been in a column of O's since March 22nd of this year, and this reversal effectively puts the "offensive team" back onto the field with respect to broad US stocks. In addition to the BPNYSE, both the Bullish Percent for OTC BPOTC and the Bullish Percent for the Optional Universe BPOPTI reversed up into Xs on their respective charts as well. These three BPs join the BPNDX, BPMID, and BPSML, which returned to X's earlier this month.

There are still some spots left to attend the November for the Fall 2017 Point & Figure Institute in Richmond, VA. The agenda has been updated, and Ralph Acampora will deliver a keynote address not to be missed.
The event will provide an opportunity to engage with experts from Dorsey Wright and seasoned peers in the business. You will be exposed to new ideas, frameworks, and tools that can help you manage your business more effectively, through a combination of lectures, small group sessions, case study work, website tutorials, and Q&A time. You will leave not only with increased knowledge, but also the renewed energy and confidence that comes from mastering the Point & Figure methodology.
Keynote Address by Ralph Acampora

Fall 2017 Point & Figure Institute Details:
Dates: November 8 - 10, 2017
Location: The Jefferson Hotel
101 West Franklin St.
Richmond, VA
The market is full of winners and losers. Not a new or radical idea, in fact it is the reason that active managers have a job and the world does not just buy an index fund for all of their money. The degree to which the winners are better than the market and losers are worse however can be surprising. A couple of years ago Eric Crittenden wrote an article analyzing where the stock market returns really come from.
“We analyzed 14,455 active stocks between 1989 and 2015, identifying the best-performing stocks on both an annualized return and total return basis.Looking at total returns of individual stocks, 3,683 or 25% underperformed the S&P 500 Index by at least 75% during their lifetimes. Likewise, 2,844 stocks (20%) outperformed the S&P 500 by at least 300%. The remaining stocks performed above, at or below the same level as the S&P 500.”
Source: https://longboardfunds.com/articles/what-can-nfl-draft-teach-you-about-stocks
A newer study by Hendrik Bessembinder, a finance professor at the W. P. Carey School of Business at Arizona State University finds that most stocks are not only sources of lackluster returns, but investors are better off buying 1 Month T-Bills. Out of the stock market as defined by the study, roughly 4 percent of all traded stocks account for nearly all of the returns earned by investors in the stock market since 1926. 30 stocks account for approximately 30 percent of the net wealth generated by stocks in that period, and 50 stocks account for 40 percent of the net wealth creation. The full study can be found here, in addition Bloomberg and NY Times have also written stories on Professor Bessembinder’s study. The widely followed "FAANG" stocks over the past year are a prime example of this finding. They now comprise over 10% of the S&P 500 and have all handedly outperformed the broad index. If you started with an equal weight portfolio of the 5 securities one year ago you would have gained 37%, compared to the 15.46% return by the fully diversified/diluted index.
| SYMBOL | RETURN 9/28/2016-9/28/2017 |
| FB | 29.75% |
| AMZN | 14.74% |
| NFLX | 86.67% |
| AAPL | 35.35% |
| GOOGL | 18.50% |
| SPX | 15.46% |
| SPXEWI | 13.51% |
| Price only returns not inclusive of distributions | |
At first glance the idea that only a handful of stocks are worth investing in over the long period and you would be better off owning T-Bills rather than owning the remaining stocks is a bit shocking. After digesting the data however it is similar to a study that John Lewis (Senior Portfolio Manager for the Dorsey Wright Relative Strength strategies) conducted in 2014 in the whitepaper Point and Figure RS Signals. John took the top 1000 market cap stocks and divided them into four baskets (BX, BO, SX, SO) based on the stocks PnF relative strength vs the S&P 500. This process was repeated on a monthly basis from 1989-2014 to create indexes to track the returns.
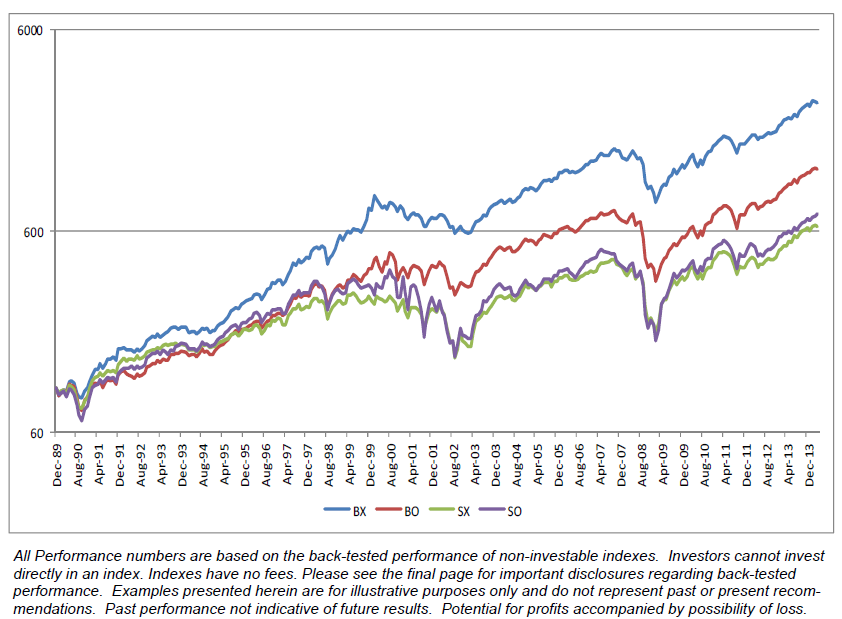

John’s paper found that owning just those high conviction names in a positive trend showing strong intermediate trend support greatly outpaced owning the S&P500 Total Return by 3 times and the S&P500 EW by 2 times as well as all of the security baskets that are not exhibiting positive momentum characteristics.
The studies both find that owning only the strongest names over their respective periods and letting them run yields the best results. They can also make the case that you should be making meaningful investments in your portfolio rather than over diversifying around thousands of securities like so many passive strategies do. The key is finding ways like relative strength to cut out the noise of the flat or underperforming markets and buy the winners.

With market close on Friday, September 29th, we have effectively closed the book on Q3 2017 and entered Q4 2017, quickly closing in on on the final stretch of 2017. With that in mind, today we wanted to review how we've arrived at this point by examining important areas of the market, such as the S&P 500, Energy and International Markets, and explore what areas have contributed to the strong market performance thus far. In today's feature, we'll provide a comprehensive performance attribution, looking at what sectors and stocks have contributed to the S&P 500's performance, not only this year but also the past few years. We've also seen a strong rebound in Energy this past month, so we want to find out which large cap stocks have led to this. We'll close with a unique review of International Equities. Yes, International Equities have rallied from the basement of DALI to second place, so in this section, we'll look at what countries brought us here. Later this week, we'll explore the major performance trends from Q3 2017.
Over the previous three years, U.S. Equities have had a seemingly unstoppable run. Over that period, the SPDR S&P 500 ETF Trust SPY has returned 34.42% (on a total return basis) and US equities has been the top ranked asset class in DALI for the entire period. From a sector perspective, Technology has been the biggest contributor to SPY’s rise, having both the highest total return over the period (60.51%) and the highest average weighting. On a monthly basis, it has been the highest ranked sector in US DALI since September 2016. Just as remarkable as SPY’s overall performance has been the breadth of positive contributors – only the Energy sector has had a negative total return over that time.
Looking at the period since the U.S. elections last year, Financials has been the strongest performing sector with a 30.95% total return. This was largely due to the Q4 2016 rally in Bank stocks following Donald Trump’s election and speculation that the incoming administration would reduce regulations on the industry. In just 15 trading days from 10/25/16 to 11/14/16, Financials went from the seventh ranked sector in DALI to number three, ultimately moving to the number two spot in February, where it has remained since.
Year-to-date, SPY has returned 13.77%; however over this period there has been significant dispersion in the performance of the component sectors. Once again Technology has led the pack followed by Health Care, respectively, they have returned 26.42% and 19.60%. As has been the case over the longer-term, Energy has remained a laggard returning -6.57%. The sector has shown signs of improvement over the last month and has moved out of last place in the US DALI rankings.
Heading into the final quarter of the year, US equities remains the top-ranked asset class in DALI; however, International Equities has steadily been closing the gap since the beginning of the year and currently trails by 35 buy signals. Within US Equities, Technology, Financials, and Industrials have the highest DALI buy tallies. Both Energy and Basic Materials have both had notable increases to their tallies over the past month, while Financials has lost ground. The current buy tallies for US Equity sectors are (as of 9/28/17):
- Technology – 248
- Financials – 200
- Industrials – 186
- Basic Materials – 135
- Telecommunications – 128
- Healthcare – 127
- Consumer Cyclicals – 123
- Utilities – 115
- Consumer Non-cyclicals – 109
- Energy – 60
- Real Estate – 49

Given that Technology has been the primary contributor to the S&P 500 Index SPX this year as well as the past few years, it's not surprising to see Technology stocks at the top of the SPX performance attribution report for 2017. While Apple Inc AAPL is not the best performing S&P 500 stock, its +34% return through this point in 2017 is enough to contribute 1.11% to the S&P 500's return this year. Facebook, Inc. FB, which is up 46.66% this year, has contributed 0.66% to the S&P 500. Other Technology stocks can be found at the top as well, such as the Microsoft MSFT, Amazon.com AMZN, and even Alphabet, Inc. (Google) GOOGL, as they are all up over 20% this year and have added 0.52%, 0.44%, and 0.28% to the S&P 500, respectively. A list of the top 20 contributors to the S&P 500 this year can be seen below:

Through the month of September, Energy has been the best performing area within the US Sector landscape. From August 31 through September 28, the DWA Oil Service DWAOILS and DWA Oil Sector DWAOIL are the two best performing DWA Groups, up 12.96% and 12.53% respectively. This improvement has been accompanied by improvement across Energy's sector indicators. As you recall from our earlier discussions on Energy, both the Bullish Percents for Oil BPOIL and Oil Services BPOILS reversed back into a column of X’s, and on September 14th, the Bullish Percent for Energy BPECENERGY reversed up into a column of X’s at 34% from below 30% as well. We have also seen some of the major Energy ETFs turnaround. For example, the Vanguard Energy ETF VDE moved back into a positive trend and we recently saw the SPDR Energy ETF XLE complete a double top buy signal on September 25. So which stocks are contributing to this improvement in several Energy ETFs?
In order to see what stocks are pushing these Energy ETFs higher, we ran a performance attribution screen on the XLE ETF, using Bloomberg. In the month of September, XLE is up 10.11% on a total return basis. Since XLE is a cap weighted ETF, the primary contributors to XLE's return are the mega-large-cap Energy stocks, which fortunately for XLE, have experienced a strong September. Exxon Mobil Corp [XOM ]is up 7.68% in September. With a 22% average weight in XLE, XOM has contributed 1.7% to XLE's return this past month. Chevron Corp CVX, which has an average weight of 17.19%, managed to gain 9.29% in September, contributing 1.61% to XLE's return. Since CVX and XOM make up 39% of XLE, those stocks are quite important to XLE's return stream. That said, the average return for the other XLE holdings, excluding XOM and CVX, was 14.3% through September 28, 2017, so there were some outperformers within this space, outside of the mega cap Energy Names. Some top performers were Helmerich & Payne HP and Marathon Oil Cor MRO, which gained 23.78% and 21.67%, respectively. That was enough to contribute .32% to XLE's return.

(Editor's Note: The table's header was mislabeled. The data provided in the table is for the month of September (8/31/17 - 9/28/17) and not Year-to-Date. The table headers have been fixed.)
In hindsight, we now know that Brexit served as an inflection point for International Markets, not just European markets. If you look at how International Equities have improved in DALI, much of it came after the Brexit referendum. Looking at a monthly DALI Tally Ranking snapshot, International Equities bottomed on June 30, 2016, at a total of 89 signals, placing it in last place in DALI. Since then, International Equities have gained over 200 signals to 291, placing it in second place, just behind US Equities. So what areas have contributed to International Equities ascendance in DALI?
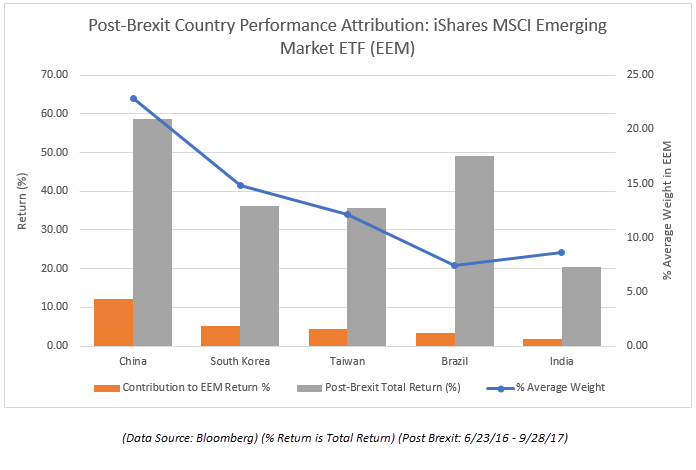
Since the Brexit vote on June 23, 2016, International Equities are in double digit positive territory. The Developed Markets (iShares MSCI EAFE ETF EFA) is up 21.01% on a total return basis since the vote while Emerging Markets (iShares MSCI Emerging Markets ETF EEM) is up an impressive 33.10%. Within the Developed Markets space, Japan, France, and Germany are the three leading contributors to EFA's return. Granted, Japan makes up 23.58% of the fund, it still has had an impressive year. Japan is up 22.74%, adding 5.29% to EFA's return. France is up 28.3% while Germany is up 27.61%, adding 2.75% and 2.50% to EFA, respectively. Even though the UK has been in the midst of the Brexit conundrum, it's gained 10.09%, adding 1.54% to EFA. Most of these returns are due to the weakness in the US Dollar, but are still noteworthy. While Austria has been one of the best performing International Markets to date, it's up 68.7%, its weighting in EFA has only added 0.12% to the fund's performance streak this year.
The chart below shows the alpha of each country within EFA - calculated as the difference between each country’s individual return and the equal-weighted average country return multiplied by the country’s average weight within EFA. The first thing that jumps out here is that the UK, the second most heavily weighted country in EFA, severely underperformed the average, while France had a higher than average return. Strategies that were underweight to the UK, overweight to France, or ideally both, relative to EFA would, have outperformed the benchmark post-brexit, all else equal.

In Emerging Markets, the leaders have been China and Brazil, both of which are up 58.66% and 49.20%, respectively. Since China makes up over 22% of the EEM, it added 12.19% to the fund's performance this year while Brazil has added 3.45%. Poland and Hungary had strong showings as well, up 47.71% and 41.92%. South Korea managed to gain 36.14% this year, adding 5.29% to EEM's 33.10% total return. Detractors from EEM this year are Malta, Pakistan, Qatar, Egypt, and Philippines, all of which are in negative for the year, but since they have such low weightings, they've only taken away -0.22% from EEM's returns.
We are closing the third quarter of the year with close to 33 groups above or near the 4 score line. At this point, 90% of all equity funds are positive in their trend on the short term sensitivity level and 92% are in a long term positive trend. 44% of any type of equity funds have their RS charts in a column of X’s versus the Equal Weighted S&P 500 SPXEWI. This 44% current RS level is the best mark we have seen on this side since of the Bear Market of 2008. We've seen head room on this RS reading as high as 84%, so that gives you a sense that we “could” see an even broader expansion of strong performance down the road.
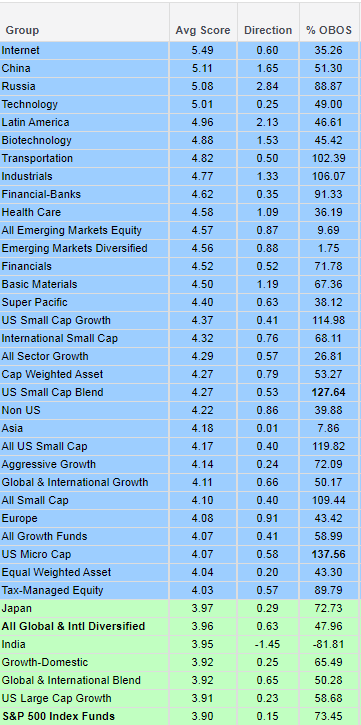
Internet funds close the quarter at #1 in score, which is 1.60 points above the S&P 500 group of funds, holding a solid dominance through this part of 2017. Leading US Styles is the US Small Caps and then Large Growth with a strong score showing by the Growth Funds universe with a score of 4.07, trading well over the score of All Value funds holding and average score of 3.41. The last crossover by these two groups was on February 27, 2017, where Growth took the control and is still making progress on its score premium over Value.
Return-wise “for the quarter”, the landscape shows Latin America at #1, with an on average return at 18% on the 90 day roll, an incredible reawakening by this group after pausing earlier in the year. Russia gets the second slot, coming from out of nowhere just within the second half of this quarter. The Internet Funds, though #1 in score hold the fifth best quarter return with an on average fund performance of 9.4% on the 90 day roll. Non-US takes much of the headcount of the leader returns for the 3rd quarter and on average the whole Non-US universe made 5.13% in this period. By stealth the Transport actually shows the best 1 year rolling return here, up 26.72% edging out Technology by a hair in this sector competition.


The Distribution Report below places Major Market ETFs and Indices into a bell curve style table based upon their current location on their 10-week trading band. The middle of the bell curve represents areas of the market that are "normally" distributed, with the far right being 100% overbought on a weekly distribution and the far left being 100% oversold on a weekly distribution. The weekly distribution ranges are calculated at the end of each week, while the placement within that range will fluctuate during the week. In addition to information regarding the statistical distribution of these market indexes, a symbol that is in UPPER CASE indicates that the RS chart is on a Buy Signal. If the symbol is dark Green then the stock is on a Point & Figure buy signal, and if the symbol is bright Red then it is on a Point & Figure sell signal.
The average Bullish Percent reading this week is 58.13% up 1.91% from the previous week
| <--100 | -100--80 | -80--60 | -60--40 | -40--20 | -20-0 | 0-20 | 20-40 | 40-60 | 60-80 | 80-100 | 100-> | |||
 |
||||||||||||||
| Symbol | Name | Symbol | Name |
| AGG | iShares US Core Bond ETF | NASD | Nasdaq Composite |
| CL/ | Crude Oil Continuous | NDX | NASDAQ-100 Index |
| DJIA | Dow Jones Industrial Average | RSP | Guggenheim S&P 500 Equal Weight ETF |
| DVY | iShares Dow Jones Select Dividend Index | RUT | Russell 2000 Index |
| DX/Y | NYCE U.S.Dollar Index Spot | SHY | iShares Barclays 1-3 Year Tres. Bond Fund |
| EFA | iSharesMSCI EAFE Index Fund | SML | S&P 600 Small Cap Index |
| FXE | CurrencyShares Euro Trust | SPX | S & P 500 Index |
| GC/ | Gold Continuous | TLT | iShares Barclays 20+ Year Treasury Bond Fund |
| GSG | iShares S&P GSCI Commodity-Indexed Trust | UV/Y | Continuous Commodity Index |
| HYG | iShares iBoxx $ High Yield Corporate Bond ETF | VOOG | Vanguard S&P 500 Growth ETF |
| ICF | iShares Cohen & Steers Realty Index | VOOV | Vanguard S&P 500 Value ETF |
| IEF | iShares Barclays 7-10 Yr. Tres. Bond Fund | VWO | Vanguard FTSE Emerging Markets ETF |
| LQD | iShares iBoxx $ Investment Grade Corp. | XLG | Guggenheim S&P 500 Top 50 ETF |
| MID | S&P 400 MidCap Index |
| Stock | Symbol | Sector | Current Price | Action Price | Target | Stop | Notes |
|---|---|---|---|---|---|---|---|
| Cemex S.A.B. de C.V. (Mexico) ADR | CX | Building | $9.01 | 9.0-10.0 | 14.0 | 7.0/8.0 | 5/5'er, Recent Pullback to improve Risk-Reward, Access to Int'l markets via ADR. |
| Wyndham Worldwide Corporation | WYN | Leisure | $105.25 | 100-106 | 133 | 93 | 5 for 5'er, leader in favored LEIS sector, bullish triangle pattern, pos wkly mom change, Earn. 10/24. |
| Cai International, Inc. | CAI | Transports/Non Air | $30.94 | hi-20s | 37.50 | 25 | 5/5'er, Improvement for Transport area, New RS buy signals in 2017, Can be used as covered write (Jan 30 calls). |
| Crane Co. | CR | Machinery and Tools | $80.51 | 74-78 | 91 inc. | 70 | 3/5'er, New buy signal after test of long-term trend, Positive weekly momentum change, Earn. 10/23. |
| Marsh & McLennan Companies, Inc. | MMC | Insurance | $83.66 | lo 80s | 100 | 76/71 | 5 for 5'er, favored Insurance sector, consecutive buy signals and new highs, pos wkly and monthly mom, Earn. 10/26. |
| Y P F Sociedad Anoni Ads (Argentina) ADR | YPF | Oil | $21.97 | 20-22 | 41 | 18.0 | 3/5'er, Oil sector moved Bear Confirmed at 38%, PB to middle of trading band, Can be used as a Covered Write (Jan 21 calls). |
| The Toro Company | TTC | Machinery and Tools | $61.87 | lo-60s | 73 | 58/54 | 4/5'er, Long-term leader that is now oversold near-term, Bearish Signal Reversed on 1/2 pt chart. |
| Eagle Bancorp, Inc. | EGBN | Banks | $66.40 | mid-60s | 77 | 60 | 5/5'er, Sector Leadership (Banks), Big Base Breakout, Earn. 10/17. |
| Stock | Symbol | Sector | Current Price | Action Price | Target | Stop | Notes |
|---|---|---|---|---|---|---|---|
| DaVita, Inc. | DVA | Healthcare | $58.47 | (hi-50s) | 53 | 64 | 0/5, Laggard in Fav. Healthcare group, 93rd out of 104 in sector matrix, "Sell on Rally" candidate. |
| Akamai Technologies, Inc. | AKAM | Internet | $47.68 | hi 40s | BOT | 54 | 0 for 5'er, bottom of INET sector, trading at 52-week lows, consecutive sell signals |
| Stock | Symbol | Sector | Current Price | Action Price | Target | Stop | Notes |
|---|---|---|---|---|---|---|---|
| Kellogg Company | K | Food Beverages/Soap | $62.81 | (68-72) | 57 | 75 | K is about 76% OS, trading below our ideal actionable range. Okay to hold or trim open positions. Buy stops can be lowered to $73 |
| Comment |
|---|
| ALB Albemarle Corp R ($135.81) - Chemicals - ALB has reached and exceeded our price objective of $131 from the recommendation back in April. It now sits above the top of its 10-week trading band, and thus more than 100% overbought. Profits can be taken or trimmed here. A very tight stop is now afforded at $126, for those who want to remain invested but do not want to risk losing gains. |
| ADI Analog Devices, Inc. R ($86.27) - Semiconductors - A new buy signal is completed a $86 with Friday's action. Those who remain invested from the long recommendation back in April may look to raise stops to $76. |
| ESRX Express Scripts, Inc. R ($63.43) - Healthcare - We will continue to adjust our buy stop along with the trend line for short positions in ESRX. A trend change would now occur with a move to $65 or higher, and is the point at which we recommend covering any open positions. |
| AVGO Broadcom Ltd R ($242.30) - Semiconductors - AVGO was a long recommendation from early July around $240. It has spent the last two months consolidating between support at $228 and resistance at $256. Open positions may be held here, but we will raise our stop loss point to $224, a potential spread triple bottom. Note that a breakout to $260 would complete a quadruple top and would confirm demand remains in control here. |
AKAM Akamai Technologies, Inc. R ($48.72) - Internet - Although a member of the favored Internet sector, AKAM can be categorized as a negative diverger recently achieving a new 52-week low after several months over lower lows and lower highs. As a result, it ranks near the bottom of the sector matrix, coming in at 41 out of 48 stocks. It also has 0 positive attributes. New short positions can be taken on in the upper 40's, with a buy stop afforded at $54.
| 15 | 16 | 17 | |||||||||||||||||||||||||||||||||||||||||||||||||||
| 78.00 | X | 78.00 | |||||||||||||||||||||||||||||||||||||||||||||||||||
| 77.00 | X | X | O | • | • | 77.00 | |||||||||||||||||||||||||||||||||||||||||||||||
| 76.00 | X | O | 5 | O | X | • | • | X | • | 76.00 | |||||||||||||||||||||||||||||||||||||||||||
| 75.00 | X | O | X | 6 | X | O | X | • | • | X | O | • | 75.00 | ||||||||||||||||||||||||||||||||||||||||
| 74.00 | X | O | X | O | X | X | O | X | O | X | • | X | O | • | 74.00 | ||||||||||||||||||||||||||||||||||||||
| 73.00 | X | 4 | O | O | X | O | X | 8 | X | O | X | O | X | O | • | 73.00 | |||||||||||||||||||||||||||||||||||||
| 72.00 | 3 | O | X | O | X | O | X | O | 9 | O | X | O | X | O | • | • | 72.00 | ||||||||||||||||||||||||||||||||||||
| 71.00 | X | O | X | O | X | O | X | O | X | O | A | O | O | • | X | X | 2 | • | 71.00 | ||||||||||||||||||||||||||||||||||
| 70.00 | X | O | O | X | O | X | O | X | O | X | O | • | X | O | 1 | O | X | O | • | 70.00 | |||||||||||||||||||||||||||||||||
| 69.00 | X | 7 | O | X | O | X | O | X | O | • | X | O | X | O | X | O | • | 69.00 | |||||||||||||||||||||||||||||||||||
| 68.00 | X | O | O | X | O | • | O | • | X | B | X | O | O | • | 68.00 | ||||||||||||||||||||||||||||||||||||||
| 67.00 | X | O | X | • | O | • | X | O | X | O | • | 67.00 | |||||||||||||||||||||||||||||||||||||||||
| 66.00 | X | O | X | • | O | • | X | O | X | O | • | 66.00 | |||||||||||||||||||||||||||||||||||||||||
| 65.00 | X | X | X | O | X | • | O | • | X | O | X | O | 3 | • | 65.00 | ||||||||||||||||||||||||||||||||||||||
| 64.00 | X | O | X | O | X | • | O | • | O | • | X | C | X | O | X | O | • | 64.00 | |||||||||||||||||||||||||||||||||||
| 63.00 | X | O | X | O | X | • | • | O | • | X | O | O | X | O | • | 63.00 | |||||||||||||||||||||||||||||||||||||
| 62.00 | B | C | X | 1 | X | • | O | • | X | O | O | X | 5 | • | 62.00 | ||||||||||||||||||||||||||||||||||||||
| 61.00 | X | O | X | O | X | • | O | • | X | O | X | O | X | O | 61.00 | ||||||||||||||||||||||||||||||||||||||
| 60.00 | X | O | O | X | • | B | • | X | O | X | O | X | O | 60.00 | |||||||||||||||||||||||||||||||||||||||
| 59.00 | X | O | X | • | O | X | 4 | X | O | • | O | 59.00 | |||||||||||||||||||||||||||||||||||||||||
| 58.00 | X | 2 | X | • | O | X | X | O | • | • | O | 58.00 | |||||||||||||||||||||||||||||||||||||||||
| 57.00 | X | O | • | O | X | X | X | X | O | X | • | O | 57.00 | ||||||||||||||||||||||||||||||||||||||||
| 56.00 | X | • | O | 3 | O | X | O | X | O | 7 | O | X | • | O | 56.00 | ||||||||||||||||||||||||||||||||||||||
| 55.00 | X | • | C | X | O | X | O | 6 | X | O | X | O | X | X | • | O | 55.00 | ||||||||||||||||||||||||||||||||||||
| 54.00 | X | • | O | X | 4 | X | O | X | O | X | O | X | O | X | O | A | • | O | 54.00 | ||||||||||||||||||||||||||||||||||
| 53.00 | X | • | O | X | O | X | O | X | O | X | O | X | O | X | O | X | • | O | X | Top | 53.00 | ||||||||||||||||||||||||||||||||
| 52.00 | • | O | X | O | X | O | X | O | O | X | O | 8 | 9 | X | • | O | 7 | O | 52.00 | ||||||||||||||||||||||||||||||||||
| 51.00 | O | X | O | X | O | X | O | O | X | O | • | O | X | O | 51.00 | ||||||||||||||||||||||||||||||||||||||
| 50.00 | 1 | X | O | 5 | X | O | X | • | O | 6 | O | 50.00 | |||||||||||||||||||||||||||||||||||||||||
| 49.00 | O | X | O | O | X | • | O | X | O | 49.00 | |||||||||||||||||||||||||||||||||||||||||||
| 48.00 | O | X | X | O | • | O | X | O | 9 | 48.00 | |||||||||||||||||||||||||||||||||||||||||||
| 47.00 | O | X | O | X | X | • | O | O | X | Med | 47.00 | ||||||||||||||||||||||||||||||||||||||||||
| 46.00 | O | X | O | X | O | X | O | X | 46.00 | ||||||||||||||||||||||||||||||||||||||||||||
| 45.00 | O | O | X | O | X | 8 | 45.00 | ||||||||||||||||||||||||||||||||||||||||||||||
| 44.00 | O | O | X | 44.00 | |||||||||||||||||||||||||||||||||||||||||||||||||
| 43.00 | 2 | X | 43.00 | ||||||||||||||||||||||||||||||||||||||||||||||||||
| 42.00 | O | X | 42.00 | ||||||||||||||||||||||||||||||||||||||||||||||||||
| 41.00 | O | X | Bot | 41.00 | |||||||||||||||||||||||||||||||||||||||||||||||||
| 40.00 | O | 40.00 | |||||||||||||||||||||||||||||||||||||||||||||||||||
| 15 | 16 | 17 |
| Comments |
|---|
| ABEO Abeona Therapeutics Inc. ($16.60) - Healthcare - With the most recent action, ABEO broke a double top at $18 and moved higher to $18.50, a new 52 week high on the chart and the seventh consecutive buy signal on the chart. ABEO is within the favored Healthcare sector and is a strong 5 for 5’er trading well above the bullish support line. Okay to hold here or buy on a pullback. The first sign of trouble from here comes with a move to $13.50, a double bottom sell signal. |
| ACLS Axcelis Technoliges, Inc. ($26.95) - Semiconductors - ACLS broke a double top at $27 with the most recent action. This stock is a 5 for 5’er within the Semiconductors sector that just had a flip to positive monthly momentum. Overall, demand is in control. Okay to buy on a pullback. The first sign of trouble comes with a move to $18.50, a double bottom sell signal. |
| BHLB Berkshire Hills Bancorp, Inc. ($38.60) - Savings & Loans - After finding support at $33, BHLB found demand and broke a double top at $39. This is the fourth consecutive buy signal on the chart for this strong 4 for 5’er within the Savings & Loans sector. Weekly momentum has been positive for three weeks, suggesting the potential for further upside from here. The technical picture is positive. The first sign of trouble from here comes with a move to $32, a triple bottom sell signal. The bullish support line lies at $30. |
| CHE Chemed, Inc. ($201.34) - Household Goods - CHE returned to a buy signal after breaking a triple top at $200. The stock is a 5 for 5'er ranking in the top ten of the Household Goods sector matrix. New positions may be initiated on this breakout. Support is at $188. Earnings are expected on 10/26. |
| CSFL CenterState Bank Corp ($26.94) - Banks - CFSL broke a double top at $27. This stock is a 5 for 5’er within the Banks sector that has maintained an overall positive trend dating back to October 2013. Weekly momentum has been positive for three weeks, suggesting the potential for further upside from here. Additionally, CFSL ranks within the top quartile of the Banks sector RS matrix. Overall, the technical picture is positive. Okay to hold here or buy on a pullback. Support lies at $22. Note earnings 10/16. |
| KRA Kraton Corp ($40.53) - Chemicals - KRA broke through overhead resistance with a spread triple top break at $38. The stock continued higher to $40, a new 52 week high. KRA is a perfect 5 for 5’er as all of its trending and relative strength characteristics are positive here. Additionally, weekly momentum has been positive for two weeks and the price target is $54. Okay to hold here or buy on a pullback as KRA is trading over the top of the 10 week trading band. The first sign of trouble from here comes with a move to $31, a double bottom sell signal. Note earnings are slated for 10/24. |
| REI Ring Energy, Inc. ($14.54) - Oil - REI broke a spread quadruple top with Friday’s market action. This is a new 52 week high as well as the second consecutive buy signal on the chart. REI is a strong 4 for 5’er within the Oil sector that recently saw its monthly momentum flip positive. Additionally, the bullish price objective is $23.50, adding to the positive technical picture. Okay to initiate new positions here. The first sign of trouble comes with a move to $11.50, a double bottom sell signal as well as a long term trend violation. |
| SNV Synovus Financial Corp. ($46.25) - Banks - SNV broke a double top at $46 on Friday. This stock is a perfect 5 for 5’er within the favored Banks sector that has maintained a positive trend since February 2012. Weekly momentum has been positive for three weeks and the bullish price objective is $79. Okay to hold here or buy on a pullback. The first sell signal comes with a move to $40, a double bottom break. |
| TSN Tyson Foods, Inc. ($70.52) - Food Beverages/Soap - TSN broke a spread triple top at $68 and continued higher to $70 intraday. The stock took out resistance dating back to February this year on this move. The 3 for 5'er also flipped to positive weekly momentum with this breakout. Those interested in gaining exposure are best served on a pullback since it trades at the top of its 10-week trading band. Support is in the low $60's. |
| ZION Zions Bancorporation ($47.30) - Banks - ZION broke a double top at $47 on Friday, completing a bullish triangle pattern on the chart. ZION is trading in a positive trend and is a strong 5 for 5’er within the Banks sector. Weekly momentum just flipped positive and ZION has a price target of $97. Okay to buy or hold here as demand is in control. The first sign of trouble from here comes with a move to $41, a double bottom sell signal. |
| Name | Option Symbol | Action | Stop Loss |
|---|---|---|---|
| Zions Bancorporation - $47.18 | O:ZION 18A40.00D19 | Buy the January 40.00 calls at 7.70 | 41.00 |
| Name | Option | Action |
|---|---|---|
| Amphenol Corporation ( APH) | Oct. 70.00 Calls | Raise the option stop loss to 12.40 (CP: 14.40) |
| Synopsys Inc ( SNPS) | Sep. 70.00 Calls | Stopped at 7.90 (CP: 9.70) |
| Analog Devices, Inc. ( ADI) | Dec. 77.50 Calls | Raise the option stop loss to 7.50 (CP: 9.50) |
| Textron Inc. ( TXT) | Jan. 46.00 Calls | Raise the option stop loss to 6.50 (CP: 8.50) |
| Micron Technology, Inc. ( MU) | Jan. 28.00 Calls | Raise the option stop loss to 9.70 (CP: 11.70) |
| Wyndham Worldwide Corporation ( WYN) | Mar. 95.00 Calls | Raise the option stop loss to 10.70 (CP: 12.70) |
| D.R. Horton, Inc. ( DHI) | Jan. 33.00 Calls | Raise the option stop loss to 5.20 (CP: 7.20) |
| Celgene Corporation ( CELG) | Dec. 125.00 Calls | Raise the option stop loss to 19.85 (CP: 21.85) |
| Old Dominion Freight Line, Inc. ( ODFL) | Jan. 95.00 Calls | Raise the option stop loss to 14.40 (CP: 16.40) |
| Eastman Chemical Company ( EMN) | Dec. 80.00 Calls | Raise the option stop loss to 9.00 (CP: 11.00) |
| Ameriprise Financial ( AMP) | Dec. 130.00 Calls | Raise the option stop loss to 17.50 (CP: 19.50) |
| BorgWarner Inc. ( BWA) | Jan. 45.00 Calls | Initiate an option stop loss of 5.20 (CP: 7.20) |
| Texas Instruments Incorporated ( TXN) | Jan. 80.00 Calls | Raise the option stop loss to 8.50 (CP: 10.50) |
| Name | Option Symbol | Action | Stop Loss |
|---|---|---|---|
| Akamai Technologies, Inc. - $48.72 | O:AKAM 18N55.00D16 | Buy the March 55.00 puts at 8.00 | 54.00 |
| Name | Option | Action |
|---|---|---|
| Tyson Foods, Inc. (TSN) | Oct. 65.00 Puts | Stopped at 68.00 (CP: 70.67) |
| Kellogg Company (K) | Jan. 70.00 Puts | Raise the option stop loss to 6.10 (CP: 8.10) |
| Name | Option Sym. | Call to Sell | Call Price | Investment for 500 Shares | Annual Called Rtn. | Annual Static Rtn. | Downside Protection |
|---|---|---|---|---|---|---|---|
| International Game Technology $24.56 | O:IGT 18A25.00D19 | Jan. 25.00 | 1.85 | $11,482.00 | 25.41% | 22.51% | 6.46% |
| Name | Action |
|---|---|
| Teladoc Inc. (TDOC) - 32.65 | Sell the January 35.00 Calls. |
| Avis Budget Group, Inc. (CAR) - 38.29 | Sell the January 35.00 Calls. |
| The Chemours Company (CC) - 50.41 | Sell the January 55.00 Calls. |
| RH (RH) - 71.10 | Sell the March 75.00 Calls. |
| Servicenow Inc (NOW) - 116.65 | Sell the January 120.00 Calls. |
| LGI Homes, Inc (LGIH) - 47.86 | Sell the March 50.00 Calls. |
| Name | Covered Write |
|---|---|
| Tempur Sealy International Inc. ( TPX - 63.75 ) | January 65.00 covered write. |
Daily Equity & Market Analysis
Loading, Please Wait...
