
Fund returns for the quarter
We are closing the third quarter of the year with close to 33 groups above or near the 4 score line. At this point, 90% of all equity funds are positive in their trend on the short term sensitivity level and 92% are in a long term positive trend. 44% of any type of equity funds have their RS charts in a column of X’s versus the Equal Weighted S&P 500 SPXEWI. This 44% current RS level is the best mark we have seen on this side since of the Bear Market of 2008. We've seen head room on this RS reading as high as 84%, so that gives you a sense that we “could” see an even broader expansion of strong performance down the road.
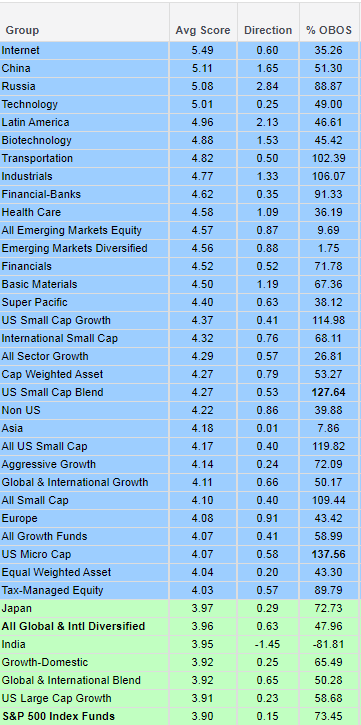
Internet funds close the quarter at #1 in score, which is 1.60 points above the S&P 500 group of funds, holding a solid dominance through this part of 2017. Leading US Styles is the US Small Caps and then Large Growth with a strong score showing by the Growth Funds universe with a score of 4.07, trading well over the score of All Value funds holding and average score of 3.41. The last crossover by these two groups was on February 27, 2017, where Growth took the control and is still making progress on its score premium over Value.
Return-wise “for the quarter”, the landscape shows Latin America at #1, with an on average return at 18% on the 90 day roll, an incredible reawakening by this group after pausing earlier in the year. Russia gets the second slot, coming from out of nowhere just within the second half of this quarter. The Internet Funds, though #1 in score hold the fifth best quarter return with an on average fund performance of 9.4% on the 90 day roll. Non-US takes much of the headcount of the leader returns for the 3rd quarter and on average the whole Non-US universe made 5.13% in this period. By stealth the Transport actually shows the best 1 year rolling return here, up 26.72% edging out Technology by a hair in this sector competition.

