
Not all stocks are created equal.
The market is full of winners and losers. Not a new or radical idea, in fact it is the reason that active managers have a job and the world does not just buy an index fund for all of their money. The degree to which the winners are better than the market and losers are worse however can be surprising. A couple of years ago Eric Crittenden wrote an article analyzing where the stock market returns really come from.
“We analyzed 14,455 active stocks between 1989 and 2015, identifying the best-performing stocks on both an annualized return and total return basis.Looking at total returns of individual stocks, 3,683 or 25% underperformed the S&P 500 Index by at least 75% during their lifetimes. Likewise, 2,844 stocks (20%) outperformed the S&P 500 by at least 300%. The remaining stocks performed above, at or below the same level as the S&P 500.”

Source: https://longboardfunds.com/articles/what-can-nfl-draft-teach-you-about-stocks
A newer study by Hendrik Bessembinder, a finance professor at the W. P. Carey School of Business at Arizona State University finds that most stocks are not only sources of lackluster returns, but investors are better off buying 1 Month T-Bills. Out of the stock market as defined by the study, roughly 4 percent of all traded stocks account for nearly all of the returns earned by investors in the stock market since 1926. 30 stocks account for approximately 30 percent of the net wealth generated by stocks in that period, and 50 stocks account for 40 percent of the net wealth creation. The full study can be found here, in addition Bloomberg and NY Times have also written stories on Professor Bessembinder’s study. The widely followed "FAANG" stocks over the past year are a prime example of this finding. They now comprise over 10% of the S&P 500 and have all handedly outperformed the broad index. If you started with an equal weight portfolio of the 5 securities one year ago you would have gained 37%, compared to the 15.46% return by the fully diversified/diluted index.
| SYMBOL | RETURN 9/28/2016-9/28/2017 |
| FB | 29.75% |
| AMZN | 14.74% |
| NFLX | 86.67% |
| AAPL | 35.35% |
| GOOGL | 18.50% |
| SPX | 15.46% |
| SPXEWI | 13.51% |
| Price only returns not inclusive of distributions | |
At first glance the idea that only a handful of stocks are worth investing in over the long period and you would be better off owning T-Bills rather than owning the remaining stocks is a bit shocking. After digesting the data however it is similar to a study that John Lewis (Senior Portfolio Manager for the Dorsey Wright Relative Strength strategies) conducted in 2014 in the whitepaper Point and Figure RS Signals. John took the top 1000 market cap stocks and divided them into four baskets (BX, BO, SX, SO) based on the stocks PnF relative strength vs the S&P 500. This process was repeated on a monthly basis from 1989-2014 to create indexes to track the returns.
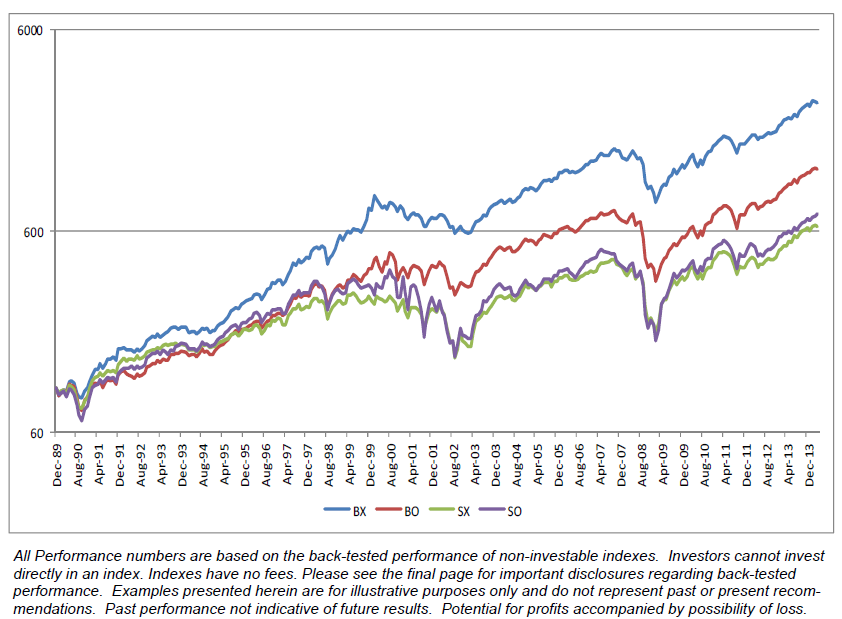

John’s paper found that owning just those high conviction names in a positive trend showing strong intermediate trend support greatly outpaced owning the S&P500 Total Return by 3 times and the S&P500 EW by 2 times as well as all of the security baskets that are not exhibiting positive momentum characteristics.
The studies both find that owning only the strongest names over their respective periods and letting them run yields the best results. They can also make the case that you should be making meaningful investments in your portfolio rather than over diversifying around thousands of securities like so many passive strategies do. The key is finding ways like relative strength to cut out the noise of the flat or underperforming markets and buy the winners.
