As we enter the last quarter of 2017, we take a look at how we got to this point by examining important areas of the market, such as the S&P 500, Energy and International Markets, and explore what areas have contributed to the strong market performance thus far.
With market close on Friday, September 29th, we have effectively closed the book on Q3 2017 and entered Q4 2017, quickly closing in on on the final stretch of 2017. With that in mind, today we wanted to review how we've arrived at this point by examining important areas of the market, such as the S&P 500, Energy and International Markets, and explore what areas have contributed to the strong market performance thus far. In today's feature, we'll provide a comprehensive performance attribution, looking at what sectors and stocks have contributed to the S&P 500's performance, not only this year but also the past few years. We've also seen a strong rebound in Energy this past month, so we want to find out which large cap stocks have led to this. We'll close with a unique review of International Equities. Yes, International Equities have rallied from the basement of DALI to second place, so in this section, we'll look at what countries brought us here. Later this week, we'll explore the major performance trends from Q3 2017.
S&P 500: Where is the performance coming from?
Over the previous three years, U.S. Equities have had a seemingly unstoppable run. Over that period, the SPDR S&P 500 ETF Trust SPY has returned 34.42% (on a total return basis) and US equities has been the top ranked asset class in DALI for the entire period. From a sector perspective, Technology has been the biggest contributor to SPY’s rise, having both the highest total return over the period (60.51%) and the highest average weighting. On a monthly basis, it has been the highest ranked sector in US DALI since September 2016. Just as remarkable as SPY’s overall performance has been the breadth of positive contributors – only the Energy sector has had a negative total return over that time.
Looking at the period since the U.S. elections last year, Financials has been the strongest performing sector with a 30.95% total return. This was largely due to the Q4 2016 rally in Bank stocks following Donald Trump’s election and speculation that the incoming administration would reduce regulations on the industry. In just 15 trading days from 10/25/16 to 11/14/16, Financials went from the seventh ranked sector in DALI to number three, ultimately moving to the number two spot in February, where it has remained since.
Year-to-date, SPY has returned 13.77%; however over this period there has been significant dispersion in the performance of the component sectors. Once again Technology has led the pack followed by Health Care, respectively, they have returned 26.42% and 19.60%. As has been the case over the longer-term, Energy has remained a laggard returning -6.57%. The sector has shown signs of improvement over the last month and has moved out of last place in the US DALI rankings.
Heading into the final quarter of the year, US equities remains the top-ranked asset class in DALI; however, International Equities has steadily been closing the gap since the beginning of the year and currently trails by 35 buy signals. Within US Equities, Technology, Financials, and Industrials have the highest DALI buy tallies. Both Energy and Basic Materials have both had notable increases to their tallies over the past month, while Financials has lost ground. The current buy tallies for US Equity sectors are (as of 9/28/17):
- Technology – 248
- Financials – 200
- Industrials – 186
- Basic Materials – 135
- Telecommunications – 128
- Healthcare – 127
- Consumer Cyclicals – 123
- Utilities – 115
- Consumer Non-cyclicals – 109
- Energy – 60
- Real Estate – 49

Given that Technology has been the primary contributor to the S&P 500 Index SPX this year as well as the past few years, it's not surprising to see Technology stocks at the top of the SPX performance attribution report for 2017. While Apple Inc AAPL is not the best performing S&P 500 stock, its +34% return through this point in 2017 is enough to contribute 1.11% to the S&P 500's return this year. Facebook, Inc. FB, which is up 46.66% this year, has contributed 0.66% to the S&P 500. Other Technology stocks can be found at the top as well, such as the Microsoft MSFT, Amazon.com AMZN, and even Alphabet, Inc. (Google) GOOGL, as they are all up over 20% this year and have added 0.52%, 0.44%, and 0.28% to the S&P 500, respectively. A list of the top 20 contributors to the S&P 500 this year can be seen below:

Energy Rebound:
Through the month of September, Energy has been the best performing area within the US Sector landscape. From August 31 through September 28, the DWA Oil Service DWAOILS and DWA Oil Sector DWAOIL are the two best performing DWA Groups, up 12.96% and 12.53% respectively. This improvement has been accompanied by improvement across Energy's sector indicators. As you recall from our earlier discussions on Energy, both the Bullish Percents for Oil BPOIL and Oil Services BPOILS reversed back into a column of X’s, and on September 14th, the Bullish Percent for Energy BPECENERGY reversed up into a column of X’s at 34% from below 30% as well. We have also seen some of the major Energy ETFs turnaround. For example, the Vanguard Energy ETF VDE moved back into a positive trend and we recently saw the SPDR Energy ETF XLE complete a double top buy signal on September 25. So which stocks are contributing to this improvement in several Energy ETFs?
In order to see what stocks are pushing these Energy ETFs higher, we ran a performance attribution screen on the XLE ETF, using Bloomberg. In the month of September, XLE is up 10.11% on a total return basis. Since XLE is a cap weighted ETF, the primary contributors to XLE's return are the mega-large-cap Energy stocks, which fortunately for XLE, have experienced a strong September. Exxon Mobil Corp [XOM ]is up 7.68% in September. With a 22% average weight in XLE, XOM has contributed 1.7% to XLE's return this past month. Chevron Corp CVX, which has an average weight of 17.19%, managed to gain 9.29% in September, contributing 1.61% to XLE's return. Since CVX and XOM make up 39% of XLE, those stocks are quite important to XLE's return stream. That said, the average return for the other XLE holdings, excluding XOM and CVX, was 14.3% through September 28, 2017, so there were some outperformers within this space, outside of the mega cap Energy Names. Some top performers were Helmerich & Payne HP and Marathon Oil Cor MRO, which gained 23.78% and 21.67%, respectively. That was enough to contribute .32% to XLE's return.

(Editor's Note: The table's header was mislabeled. The data provided in the table is for the month of September (8/31/17 - 9/28/17) and not Year-to-Date. The table headers have been fixed.)
Post-Brexit Performance: Developed and Emerging Markets get Stronger
In hindsight, we now know that Brexit served as an inflection point for International Markets, not just European markets. If you look at how International Equities have improved in DALI, much of it came after the Brexit referendum. Looking at a monthly DALI Tally Ranking snapshot, International Equities bottomed on June 30, 2016, at a total of 89 signals, placing it in last place in DALI. Since then, International Equities have gained over 200 signals to 291, placing it in second place, just behind US Equities. So what areas have contributed to International Equities ascendance in DALI?
Since the Brexit vote on June 23, 2016, International Equities are in double digit positive territory. The Developed Markets (iShares MSCI EAFE ETF EFA) is up 21.01% on a total return basis since the vote while Emerging Markets (iShares MSCI Emerging Markets ETF EEM) is up an impressive 33.10%. Within the Developed Markets space, Japan, France, and Germany are the three leading contributors to EFA's return. Granted, Japan makes up 23.58% of the fund, it still has had an impressive year. Japan is up 22.74%, adding 5.29% to EFA's return. France is up 28.3% while Germany is up 27.61%, adding 2.75% and 2.50% to EFA, respectively. Even though the UK has been in the midst of the Brexit conundrum, it's gained 10.09%, adding 1.54% to EFA. Most of these returns are due to the weakness in the US Dollar, but are still noteworthy. While Austria has been one of the best performing International Markets to date, it's up 68.7%, its weighting in EFA has only added 0.12% to the fund's performance streak this year.
The chart below shows the alpha of each country within EFA - calculated as the difference between each country’s individual return and the equal-weighted average country return multiplied by the country’s average weight within EFA. The first thing that jumps out here is that the UK, the second most heavily weighted country in EFA, severely underperformed the average, while France had a higher than average return. Strategies that were underweight to the UK, overweight to France, or ideally both, relative to EFA would, have outperformed the benchmark post-brexit, all else equal.

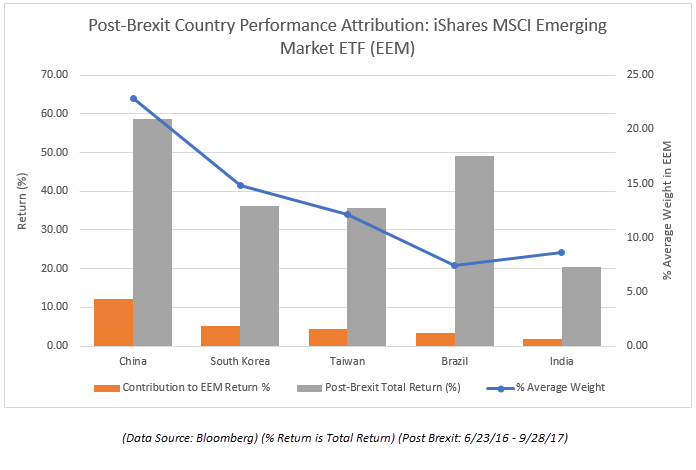
In Emerging Markets, the leaders have been China and Brazil, both of which are up 58.66% and 49.20%, respectively. Since China makes up over 22% of the EEM, it added 12.19% to the fund's performance this year while Brazil has added 3.45%. Poland and Hungary had strong showings as well, up 47.71% and 41.92%. South Korea managed to gain 36.14% this year, adding 5.29% to EEM's 33.10% total return. Detractors from EEM this year are Malta, Pakistan, Qatar, Egypt, and Philippines, all of which are in negative for the year, but since they have such low weightings, they've only taken away -0.22% from EEM's returns.