Most Requested Symbols

Join us Friday, June 16th at 2:00 pm ET for a live webinar exclusively for new or beginner DWA Platform users. The webinar will cover different aspects of the research as well as provide new users with the opportunity to ask questions. Click here to access the registration link. The password is pnfpnf. Registration is required.
Listen to DWA’s Tom Dorsey and John Lewis on Wednesday (6/21) at 1:00 pm EDT as they join the AdvisorShares Alpha All-Star Summit featuring other top ETF managers from Wilshire Funds Management and Newfleet Asset Management. It will be an interactive presentation that provides an all-access pass to better understand the right questions to ask when hiring an active manager, learn what potential red flags to recognize, and how to evaluate the best choices possible for your clients. Click here to register and to add it to your schedule!
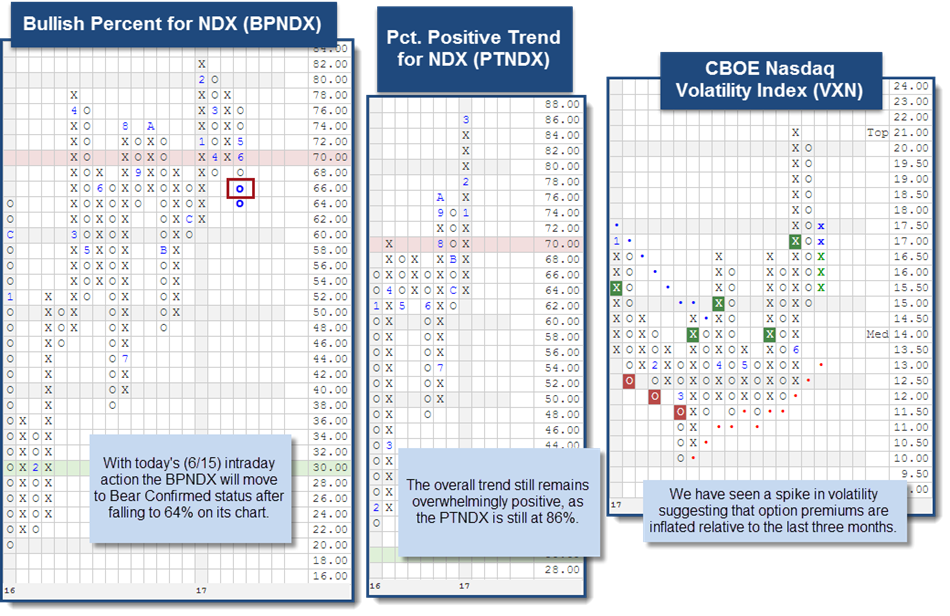
With today’s intraday action (6/15) the Bullish Percent for the NDX BPNDX will fall to 64% on its chart. This is notable because it moves the chart into Bear Confirmed status. The percent of stocks within the NDX that are on a Point and Figure buy signal is narrowing. Those with Technology exposure may want to review your positions and establish where support is located. You may need to lower the scale in order to obtain a suitable visual in some cases. Despite the BPNDX breaking down, the overall trend for Technology is still overwhelmingly positive. We are able to see this via the Percent Positive Trend for NDX PTNDX, as it measures the percent of stocks within the NDX that are trading above their bullish support lines. As you can see in the chart below, this figure is at 86%. Lastly, we have noticed increased volatility within the NDX by looking at the CBOE Nasdaq Volatility Index VXN. The added volatility is evidence of the recent tremors for the Technology sector, which implies option premiums have been inflated relative to the past three months. Overall, the Technology sector remains number one in our DALI Tool, more than half of the stocks within the NDX are still on a PnF buy signal, and 86% of those 100 stocks are trading in a positive trend. Our takeaways from these observations are to review your positions and identify support levels in case supply gets stronger from here. The chart of the NDX itself sits against support at 5640 with further support coming at 5580.

After a near term peak in Q1 of this year, interest rates have resumed a downward trajectory. Both the US Treasury 10-Year Yield Index TNX and the US Treasury 20-Year Yield Index TYX have fallen into negative trends and completed new sell signals earlier this week, at 21.25 (2.125%) and 27.75 (2.775%), respectively. While these are certainly not the lowest levels we've witnessed in recent years, it is fair to say that the low rate environment persists. As a result, the door remains open for high dividend paying stocks as an alternative.
One strategy to consider for clients seeking income is the “check-a-month” concept that provides monthly income for investors, helping to enhance any income they may be receiving from other sources. When putting together the list of ideas, it is important to find high yielding stocks that also have a positive technical picture, allowing both for income and capital appreciation. After all, the dividend yield of 3% for a stock becomes almost meaningless when the share price drops 20%. We can leverage the tools on the DWA research platform to help us identify positions that meet both criteria. For instance, using the Query function we can identify 242 stocks in the S&P 1500 universe that have a dividend yield of 3.0% or greater. However, only 65 of those stocks are currently in a positive trend with at least three positive technical attributes. So, while there are a number of potential ideas for stocks to include in a yield portfolio (strictly on dividend yield alone), you can add value by identifying those with the characteristics that make viable investment choices as well.
Below is a list of the basic criteria that we used in the Query Function:
The screen above left us with 44 results, which we whittled down to our final list of 33 actionable ideas. From there, we categorized each of the stocks into one of three groups based one when they typically pay their dividend.
The idea behind the construction of this portfolio is to provide a steady stream of income throughout the year in your client's portfolio (ideally with a check each month of the year).
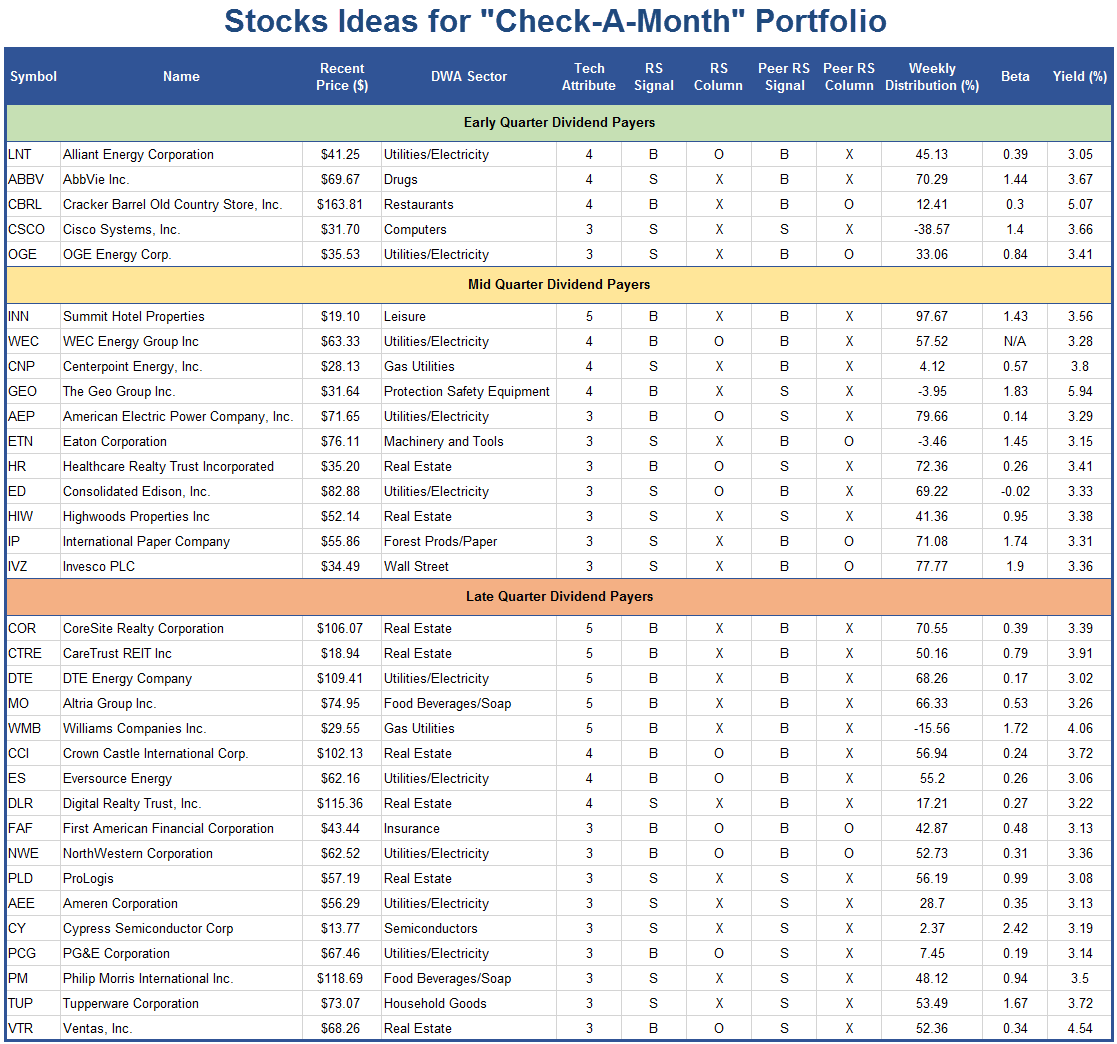
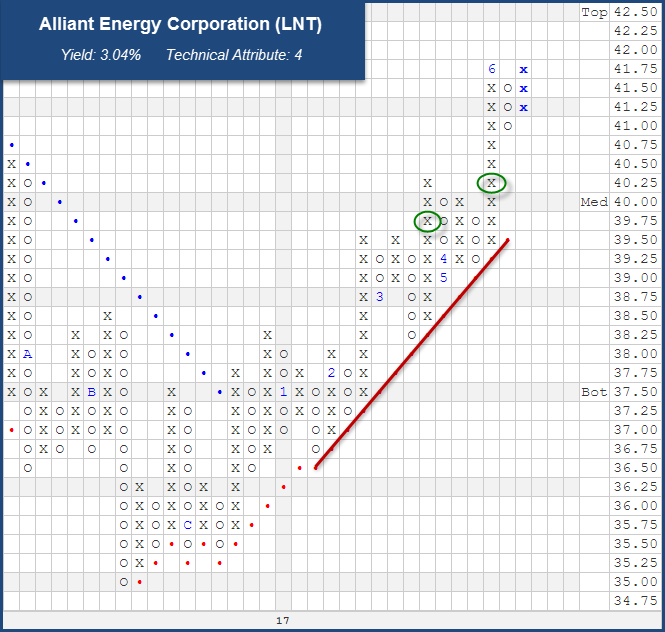
LNT Alliant Energy Corporation ($41.56) - Utilities/Electricity - LNT is a name from the "Early Quarter Payers" that offers a yield just north of 3%. The stock is a 4 for 5'er within the favored Electric Utilities sector and currently ranks in the top half of the sector matrix, ranking 19th out of 52 stocks. Over the course of the last few months it has completed consecutive buy signals (a shakeout in March, followed by a bullish triangle in May), and is now within one box of completing a potential double top at $42 on its 0.25-point chart. New positions can be taken on in the low $40's, while $38 can be used as a potential stop, which would take out its near term positive trend line and its March pullback low.
ETN Eaton Corporation ($76.00) - Machinery and Tools - From the list of "Mid Quarter Payers" ETN is a name that caught our eye for a few reasons. It made our list due to its 3.2% yield that is paired with a positive trend and buy signal. It managed a new high at $79 in May and has since pulled back to the middle of its 10-week trading band. New positions can be taken on in the low-mid $70's, while a violation of its trend line at $63 offers a reasonable stop.

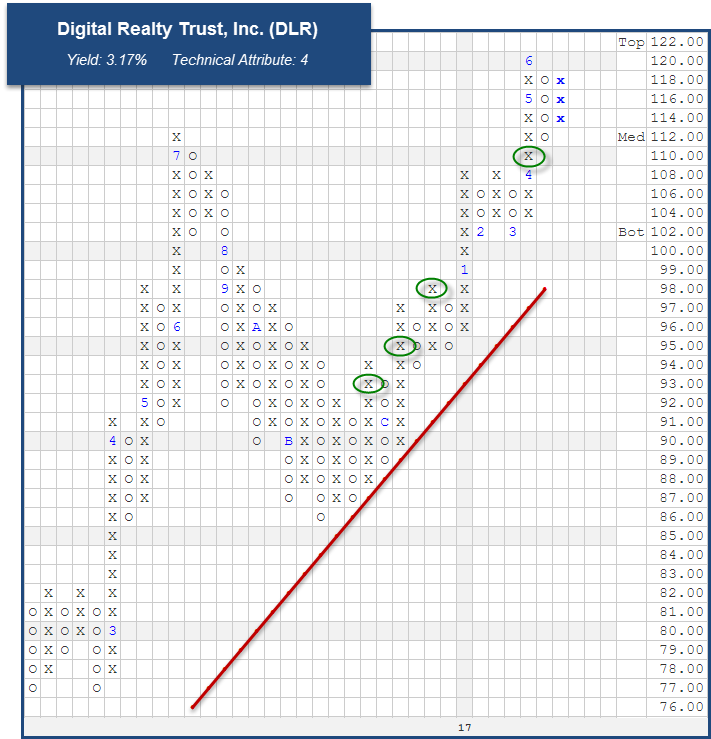
DLR Digital Realty Trust, Inc. ($118.28) - Real Estate - Out of the three categories, we had the most names in the "Late Quarter Payers" group. DLR is among those in that group, offering a technical attribute rating of 4 and a yield of 3.17%. It sits in the top quartile of the favored Real Estate sector RS matrix, which is a group that is well represented in the table above. So far this year it has been consistent with a steady climb higher, providing consolidation phases along the way which now serve as support levels. New positions can be initiated at current levels, with a stop provided at $99, a potential trend violation.
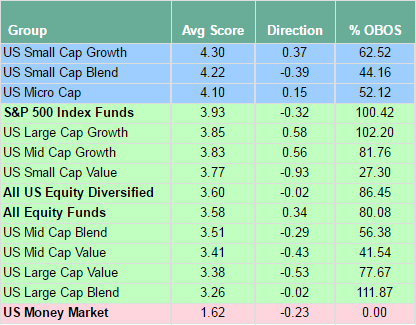
Concerning US Styles, the group scores for Small Growth continue to lead and are starting to uptick again. This 4.30 score is the best score we have seen from this group in this particular cycle coming up from the score lows in February 2016. They seemed to hover during the second quarter, but are showing signs of movement in this present month. Small Cap and Micro Caps also are upticking this month and comprise the only groups that score above the 4 score threshold. At this point in the rally, none of the US Style boxes are in extreme overbought territory on their ten week trading bands and thereby are workable here. Large Value, in general are at the tail end of the list as Large Growth and Small Growth lead in either score or score direction.
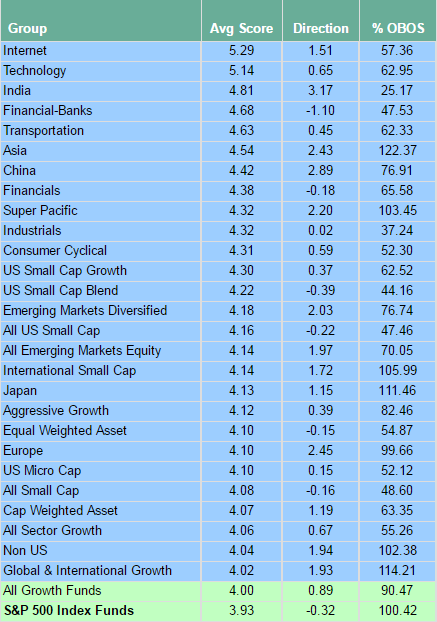
Internet and Tech continue to officially lead the entire list as they alone hold the top two scores above the 5 area. Concerning all groups, the amount of blue groups (those that score above the 4 score line) is pretty huge. As we have been pointing too, is the infiltration of all of these International-related assets that have shown dominance among the rankings. You would be using this information over the quarter to get your international weighting increased as well as paying attention to the US leadership in your available fund inventory. As I hear, your firms are just beginning to highlight Non-US areas, so you have their backing as well as this technical data that you have been using from DWA. In general we don’t see extreme OBOS reading in this universe either, although Asia assets have an elevated reading at this moment. Many of the other blue groups have very modest readings on their ten week trading bands and look very workable here in June. Commodities sit at the very bottom of the score list today offering the lowest long-side score in this cycle. The current score of 1.19 is the lowest score we’ve seen on a 1 year roll, but keep in mind that in the last three years we have seen the group touch on the 0.5 score level. If we see that kind of relative washout, I’ll bring that to your attention.

The Distribution Report below places Major Market ETFs and Indices into a bell curve style table based upon their current location on their 10-week trading band. The middle of the bell curve represents areas of the market that are "normally" distributed, with the far right being 100% overbought on a weekly distribution and the far left being 100% oversold on a weekly distribution. The weekly distribution ranges are calculated at the end of each week, while the placement within that range will fluctuate during the week. In addition to information regarding the statistical distribution of these market indexes, a symbol that is in UPPER CASE indicates that the RS chart is on a Buy Signal. If the symbol is dark Green then the stock is on a Point & Figure buy signal, and if the symbol is bright Red then it is on a Point & Figure sell signal.
The average Bullish Percent reading this week is 57.96% up 1.03% from the previous week
| <--100 | -100--80 | -80--60 | -60--40 | -40--20 | -20-0 | 0-20 | 20-40 | 40-60 | 60-80 | 80-100 | 100-> | |||
 |
||||||||||||||
| Symbol | Name | Symbol | Name |
| AGG | iShares US Core Bond ETF | NASD | Nasdaq Composite |
| CL/ | Crude Oil Continuous | NDX | NASDAQ-100 Index |
| DJIA | Dow Jones Industrial Average | RSP | Guggenheim S&P 500 Equal Weight ETF |
| DVY | iShares Dow Jones Select Dividend Index | RUT | Russell 2000 Index |
| DX/Y | NYCE U.S.Dollar Index Spot | SHY | iShares Barclays 1-3 Year Tres. Bond Fund |
| EFA | iSharesMSCI EAFE Index Fund | SML | S&P 600 Small Cap Index |
| FXE | CurrencyShares Euro Trust | SPX | S & P 500 Index |
| GC/ | Gold Continuous | TLT | iShares Barclays 20+ Year Treasury Bond Fund |
| GSG | iShares S&P GSCI Commodity-Indexed Trust | UV/Y | Continuous Commodity Index |
| HYG | iShares iBoxx $ High Yield Corporate Bond ETF | VOOG | Vanguard S&P 500 Growth ETF |
| ICF | iShares Cohen & Steers Realty Index | VOOV | Vanguard S&P 500 Value ETF |
| IEF | iShares Barclays 7-10 Yr. Tres. Bond Fund | VWO | Vanguard FTSE Emerging Markets ETF |
| LQD | iShares iBoxx $ Investment Grade Corp. | XLG | Guggenheim S&P 500 Top 50 ETF |
| MID | S&P 400 MidCap Index |
GLW Corning Incorporated R ($29.28) - Telephone - Shares of GLW were a prominent player in the original Tech bubble (and burst) in the late-90s, and has returned to form during a general re-flation of the Tech sector in recent times. This month the stock returned to its highest prices since 2001 as it very nearly printed $30. While having been generally out of favor for much of the past 17 years, this stock improved to an attribute rating of 3 last year and with a new RS buy signal in April the stock now carries an attribute rating of 5. GLW now ranks well within the Top 10 of the Telecom sector matrix, showing good standing on the Peer RS front as well. The default trend chart shows a substantial breakout as the stock moved thru the mid-20s and the 1/2 pt and 1/4 pt charts provide more sensitivity with which to begin mapping out a new long position. We will use the high-20s to accumulate GLW, and will use stops of $26 for traders (sell signal on 1/2 pt chart), and $24 for investors (negative trend change on the 1/4 pt chart). We will use a price objective of $36 based upon the vertical count on the 1/4 pt chart.
Long Ideas
Stock
Symbol
Sector
Current Price
Action Price
Target
Stop
Notes
Manpower Inc
MAN
Business Products
$105.72
102-108
146
97/91
3 for 5'er, top 20% of BUSI sector matrix, pos wkly mom change, Pot. Bullish Catapult at $108.
Synopsys Inc
SNPS
Software
$74.34
mid 70s
106
68
4 for 5'er, favored Software sector, R-R > 5-to-1
Skyworks Solutions, Inc.
SWKS
Semiconductors
$102.47
104-108
133
93/87
5 for 5'er, leader in favored SEMI sector, pos wkly mom change, consistent higher tops and higher bottoms
j2 Global Communications, Inc.
JCOM
Internet
$87.04
85-89
112
80
5/5'er, Long-term market leaders, "90 to 100" opportunity in strong sector (INET).
Owens Corning Inc.
OC
Building
$65.39
62-65
72 (inc)
59/55
3 for 5'er, leader in favored Building Sector, positive wkly and monthly mom, bullish pattern
Wynn Resorts, Limited
WYNN
Gaming
$133.49
126-134
193
118/96
5/5'er, Big Base Breakout, Potential Covered Write candidate (Sept 135.00 calls).
Zions Bancorporation
ZION
Banks
$43.23
lo-40s
97
38
5/5'er, PB to middle of 10-week Trading Bank, Top 15 Rank in Banks matrix.
Becton, Dickinson and Company
BDX
Healthcare
$192.52
low 190's
236
174
4 for 5'er, favored Healthcare sector, good R-R, bullish pattern
Corning Incorporated
GLW
Telephone
$29.25
hi-20s
36
26/24
5/5'er, New RS Buy signal, Return to market leadership
Short Ideas
Stock
Symbol
Sector
Current Price
Action Price
Target
Stop
Notes
Genesee & Wyoming Inc
GWR
Transports/Non Air
$66.49
(mid-60s)
51
72
0 for 5'er, bottom of unfavored Non Air Transport sector matrix, bearish R-R > 2, negative diverger.
Bristol-Myers Squibb Company
BMY
Drugs
$54.52
(53-56)
22
61
1 for 5'er, negative diverger, bearish triangle, negative weekly mom change
Removed Ideas
Stock
Symbol
Sector
Current Price
Action Price
Target
Stop
Notes
Express Scripts, Inc.
ESRX
Healthcare
$63.12
(lo-60s)
55
64/68
See comment below.
Follow-Up Comments
Comment
LRCX Lam Research Corporation R ($148.53) - Semiconductors - LRCX was a long recommendation from last July in the mid-80s and traded into the 160s earlier this month. After seeing a first near-term sell signal on Thursday traders may raise stops to $144, if still long here. Investors may trim positions there to protect overall gains, while we will continue to advocate the use of protective puts in place of stops here as there is no visible support below $146 for another 50 points. Still, this is an extremely strong trend, and rates as a 5 attribute stock.
ESRX Express Scripts, Inc. R ($62.68) - Healthcare - ESRX broke a double top at $64 on Thursday, which triggers a near-term buy signal within an overall negative trend longer-term. Our recommended buy stop level for short exposure is $64 for those very short-term in nature and $68 for others. We will maintain that guidance from this point, no longer considering this trade actionable, and suggesting that those who are very short-term in nature may cover here, while others may retain bearish exposure against trend line stops.
DWA Spotlight Stock
10
11
12
13
14
15
16
17
29.00
4
29.00
28.00
3
Med
28.00
27.00
2
27.00
26.00
•
1
Bot
26.00
25.00
X
•
C
25.00
24.00
•
1
O
•
A
24.00
23.00
2
•
•
X
O
•
8
23.00
22.00
X
O
X
•
6
C
4
•
X
22.00
21.00
4
X
O
X
O
•
4
O
B
O
•
X
6
7
21.00
20.00
1
X
O
1
4
X
O
•
X
O
X
6
X
O
X
O
X
20.00
19.50
X
O
X
O
•
•
X
O
5
•
3
9
X
7
3
O
X
O
X
19.50
19.00
X
O
X
5
X
•
B
•
C
6
•
X
X
A
X
O
X
2
4
X
O
19.00
18.50
X
O
3
O
X
X
8
O
X
O
X
O
•
X
O
2
O
X
O
X
O
X
5
•
18.50
18.00
X
2
X
O
X
O
X
O
X
O
X
O
X
O
•
X
1
O
X
O
X
8
X
A
O
X
•
18.00
17.50
C
O
X
O
X
O
X
O
X
O
X
O
•
O
•
X
O
X
O
X
O
O
9
O
X
1
X
•
17.50
17.00
X
X
O
O
X
O
X
O
X
O
9
•
7
•
X
O
X
O
O
X
O
X
O
X
•
17.00
16.50
X
O
X
O
X
O
X
O
X
O
X
•
O
•
X
B
O
X
O
•
O
•
16.50
16.00
X
O
B
O
•
6
•
7
•
O
X
•
O
•
X
X
•
O
X
•
•
16.00
15.50
X
8
X
•
•
•
•
O
•
8
X
X
X
•
X
O
8
A
•
O
•
15.50
15.00
X
O
X
•
•
O
X
O
X
O
X
O
•
5
O
X
O
X
•
•
15.00
14.50
X
A
•
O
X
O
X
O
X
O
X
3
X
6
X
O
X
•
14.50
14.00
•
O
X
O
X
B
O
1
O
X
O
X
O
O
•
14.00
13.50
•
O
9
A
O
X
O
X
O
A
4
•
13.50
13.00
O
X
O
X
O
5
X
O
X
•
13.00
12.50
O
X
C
O
9
O
C
•
12.50
12.00
O
7
X
O
X
•
12.00
11.50
O
X
B
X
•
11.50
11.00
O
O
•
11.00
10
11
12
13
14
15
16
17
Create Portfolio
Create Portfolio

| Comments |
|---|
| ATRA Atara Biotherapeutics ($12.08) - Biomedics/Genetics - ATRA is trading in a negative trend and during Thursday’s trading session, broke a spread triple bottom at $12.00, a new 52 week low. This stock is an unacceptable 0 for 5’er as it does not have any positive trending or relative strength characteristics in its favor at this time. Additionally, this stock ranks in the bottom decile of the Biomedics/Genetics sector RS matrix. Avoid as supply is in control and the weight of the evidence is negative. There is no remaining support on the chart. Note resistance at $14.50. |
| BOBE Bob Evans Farms, Inc. ($68.34) - Restaurants - In negative reaction to their earnings report, BOBE broke a double bottom at $68. The stock is still a 4 for 5'er ranking 1st out of 37 stocks in the Restaurants sector matrix. Traders may exit positions here, while investors may continue to hold and look to further support at $66 from May. No new positions at this time. |
| HUBS Hubspot Inc ($64.80) - Software - HUBS broke a triple bottom at $65. The stock remains a high attribute name with a score of 5 and ranks within the top quartile of the favored Software sector matrix. Traders may exit positions here, while investors may employ a trend stop with a move to $62. No new positions at this time. |
| KR The Kroger Co. ($24.65) - Retailing - After a negative reaction to earnings, KR broke a double bottom at $28 and fell further to $25, a low level not seen on the chart since June 2014. This stock is a weak 2 for 5’er within the unfavored Retailing sector that has seen three months of negative monthly momentum. Supply is in control and the technical picture is negative here. There is no remaining support on the chart. At this juncture, resistance lies at $36. |
| LPI Laredo Petroleum Inc. ($10.88) - Oil - LPI broke a double bottom at $11 on Thursday, marking the fourth consecutive sell signal for the stock. LPI is a 3 for 5’er that is trading in a negative trend. Additionally, weekly momentum just flipped negative, suggesting the potential for further downside. Avoid this name as the trend is negative and supply is in control. The next level of support lies at $9.50, the July 2016 low while resistance is at $13. |
| MOMO Momo Inc (China) ADR ($35.94) - Software - MOMO broke a triple bottom at $36. The stock now rests against support from April and still offers all five positive technical attributes. Traders may exit positions with a move to $35, but investors may look to further support in the lower $30's from here. We do not advise adding new positions at current levels. |
| PTC PTC Inc ($56.22) - Software - PTC broke a double bottom at $54. This is the first sell signal since February 2016. As a result, we will give the stock the benefit of the doubt. The stock still comes with a score of 5 and ranks near the top third of the favored Software sector matrix. While we do not advise new positions at this time, those long may continue to hold and look to further support offered between $51 and $52. |
| SINA Sina.com ($85.46) - Internet - SINA broke a double bottom at $85 and continued lower to $84 intraday. This is the stock's third consecutive sell signal and comes after a bearish catapult formation earlier this month at $90. Those long may consider exiting positions since supply continues to gain strength at this juncture or a reversal into X's. For those that wish to give it more room may look to the next level of support against the bullish support line at $78. No new positions at this time. |
| SPNC Spectranetics Corporation ($30.20) - Healthcare - SPNC broke a double top at $30 on Thursday and is now up against resistance reached back in May of this year. This stock is an acceptable 4 for 5’er within the favored Healthcare sector. Weekly momentum just flipped positive, suggesting the potential for further upside from here. Okay to initiate new positions on the breakout as demand is in control and the weight of the evidence is positive. The first sell signal from here comes with a move $25, a triple bottom. |
| W Wayfair Inc. ($73.89) - Retailing - With the most recent action, W broke a double top at $74 and climbed higher to $75. This stock is a perfect 5 for 5’er that is trading well above the bullish support line and is showing superior strength relative to both the market and its peers. W currently ranks 2nd out of 88 names in the Retailing sector RS matrix, making this one of the strongest names in this space. At this juncture, W is in extremely overbought territory so those looking to initiate or increase exposure would be best served on a pullback. The first sign of trouble comes with a move to $65, a double bottom sell signal. |
| Name | Option Symbol | Action | Stop Loss |
|---|---|---|---|
| Royal Caribbean Cruises Ltd. - $111.53 | O:RCL 17L105.00D15 | Buy the December 105.00 calls at 12.95 | 102.00 |
| Name | Option | Action |
|---|---|---|
| Manpower Inc ( MAN) | Sep. 100.00 Calls | Raise the option stop loss to 7.10 (CP: 9.10) |
| Northern Trust Corporation ( NTRS) | Oct. 85.00 Calls | Raise the option stop loss to 8.30 (CP: 10.30) |
| Centene Corporation ( CNC) | Sep. 70.00 Calls | Initiate an option stop loss of 8.30 (CP: 10.30) |
| Name | Option Symbol | Action | Stop Loss |
|---|---|---|---|
| LyondellBasell Industries NV - $79.97 | O:LYB 17X82.50D15 | Buy the December 82.50 puts at 8.00 | 85.00 |
| Name | Option | Action |
|---|---|---|
| Dollar Tree, Inc. (DLTR) | Aug. 82.50 Puts | Raise the option stop loss to 7.50 (CP: 9.50) |
| WESCO Internation, Inc. (WCC) | Oct. 65.00 Puts | Raise the option stop loss to 6.40 (CP: 8.40) |
| Name | Option Sym. | Call to Sell | Call Price | Investment for 500 Shares | Annual Called Rtn. | Annual Static Rtn. | Downside Protection |
|---|---|---|---|---|---|---|---|
| Cirrus Logic Inc $64.10 | O:CRUS 17I65.00D15 | Sep. 65.00 | 4.20 | $29,715.80 | 32.97% | 23.55% | 5.60% |
| Name | Action |
|---|---|
| Momo Inc (China) ADR (MOMO) - 36.54 | Sell the October 40.00 Calls. |
| Lumber Liquidators Holdings Inc (LL) - 25.30 | Sell the November 30.00 Calls. |
| Dish Network Corporation (DISH) - 64.88 | Sell the September 67.50 Calls. |
| MACOM Technology Solutions Holdings Inc. (MTSI) - 56.05 | Sell the November 60.00 Calls. |
| Micron Technology, Inc. (MU) - 31.06 | Sell the October 32.00 Calls. |
| Cabot Oil & Gas Corporation (COG) - 23.10 | Sell the October 25.00 Calls. |
| Weight Watchers International, Inc. (WTW) - 27.10 | Sell the October 28.00 Calls. |
| Name | Covered Write |
|---|---|
| The Chemours Company ( CC - 38.71 ) | October 44.00 covered write. |
| Alcoa Inc. ( AA - 31.54 ) | October 35.00 covered write. |
Daily Equity & Market Analysis
Loading, Please Wait...
