Most Requested Symbols


Introducing the BMO Elkhorn DWA MLP SelectTM Index ETN
Join us Tuesday, December 13th at 12:00 pm ET for a live webcast as we discuss the upcoming BMO Elkhorn DWA MLP SelectTM Index ETN (BMLP), the first Dorsey Wright MLP strategy tracking the DWA MLP SelectTM Index. We will discuss both the advantages of the ETN structure as it relates to MLP exposure and why it's particularly appropriate for Dorsey Wright's MLP solution.
Learn the methodology behind the DWA MLP SelectTM Index, which employs a rules-based rotation in an effort to deliver positive excess returns versus its peers, while currently offering an index yield of 7.42%. Registration is required and the password for the webinar is pnfpnf.
DALI Change: International Equities moves ahead of Fixed Income
We wanted to make you aware of a change in the broad asset class rankings within DALI that occurred following yesterday's market action. International Equities overtook Fixed Income based upon the asset classes' buy signal tally history. As a result, International Equities ranks third for the first time since August 19, 2015. Fixed Income now holds the fourth position while Commodities remain in the second position. Domestic Equities continue to lead the way with over 310 buy signals in its favor. This broad asset class ranking change has caused the Conservative Tactical Tilt strategy to adjust to provide exposure to International Equities at the expense of Fixed Income.

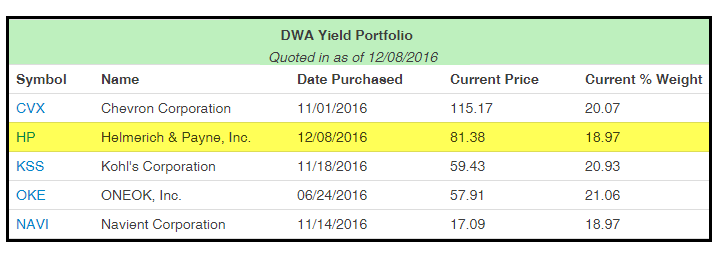
DWA Yield Portfolio Change
There was a change in the DWA Yield Portfolio SPX500YLD because the technical attribute score for Garmin Ltd. GRMN fell to an unacceptable rating of 2. The Portfolio has purchased Helmerich & Payne, Inc. HP in its place, which meets all of the buy criteria. The DWA Yield Portfolio has five holdings with an average yield of 3.73%. Note, this change is just a replacement since the collar was not triggered.

Today, we begin our annual “Twelve Days of Christmas” series. Each year we produce twelve feature articles throughout the last few weeks of the year, all revolving around one central concept. In the past, we have used this series to discuss anything from the basics of Point & Figure and Relative Strength, to tips for effectively communicating the process, to education around new tools and other innovations on the website. This year, all twelve articles will revolve around the topic of “Themes to Know” as we move into a new year. 2016 was a difficult year for relative strength. The market underwent several leadership changes, some of which seem to have more room to go, and others, which proved to be short-lived. This ultimately made for a very bumpy ride for trend adapting strategies such as RS. When we look at where the last 12 months has left us with respect to our indicators, key charts, and other relationships, there are several themes we feel are particularly noteworthy and can be leveraged within your portfolios.
We will kick off the series today by focusing on the relative and absolute improvement seen within the Financials sector, making it one of the new themes to be aware of as we head into 2017. Much of the improvement within the sector is relatively new and has come during the fourth quarter. As it stands today, Financials ranks 3rd (out of 11) in the DALI sector rankings, and prior to this recent climb up the rankings, as recently as October 4th, 2016, Financials had ranked 11th (or last). This abrupt rise up to 3rd place in DALI is notable and it is the highest the sector has ranked since December 2009. Initially, the improvement within the sector left many wondering if this improvement was legitimate, or if this was just another short-term blip on the radar during 2016. As we get closer to the end of the year, we have continued to see positive evidence mount for Financials and help validate some of the action that has occurred. Throughout the rest of the piece, we’ll look to present other positive technical developments that have occurred within the Financials sector.
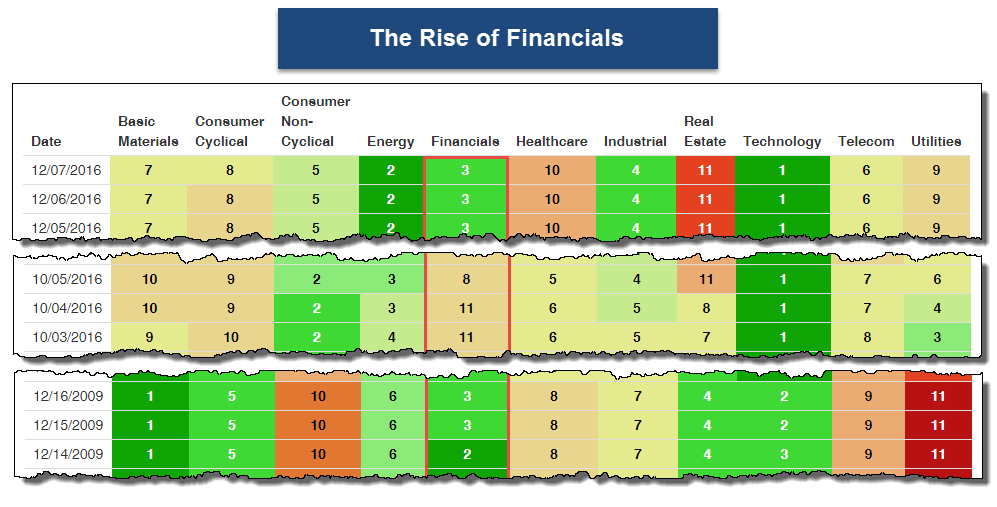
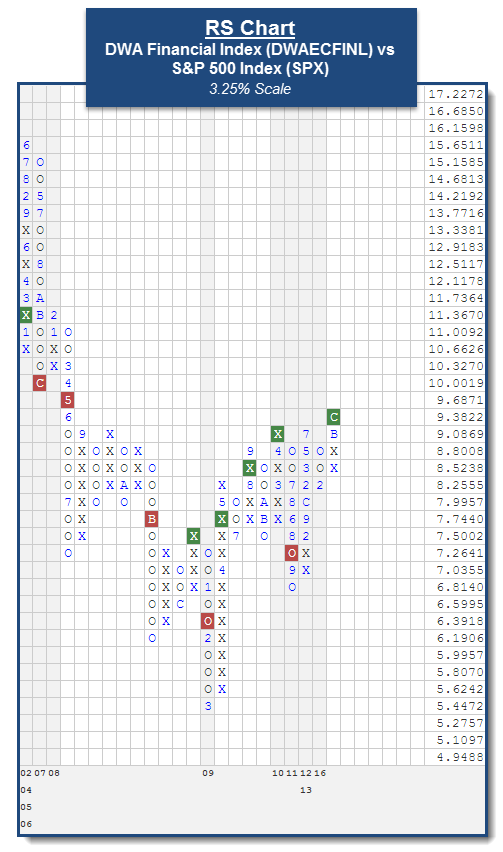
Not only have we seen broader Financials improve relative to other sectors, but we have also seen it improve against the broader market, as defined by the S&P 500 Index SPX. Evidence of this development can be seen on a relative strength chart that compares the DWA Financials Index DWAECFINL to the S&P 500 Index SPX. Using a 3.25% scale, DWAECFINL gave a RS buy signal versus the market earlier this week on December 7th. This is the first time since August 2011 that the RS chart has been on a buy signal, favoring Financials. This Index, along with a number of stocks and ETFs within the Financials and Banking space, like J.P. Morgan Chase & Co. JPM and the SPDR S&P Bank ETF KBE, gave relative strength buy signals recently as well. We’ll touch on those two, as well as other potential stocks and ETF ideas, later on in the article. First, we wanted to highlight some of the noteworthy action that has occurred on the various indicators for broad Financials as well as its sub-sectors. Our observations from these indicators are listed below the image.
Indicator Observations:

As we noted, the weight of the evidence for broader Financials is overwhelmingly positive. With that in mind, we wanted to present a couple of shopping lists for broad Financials. The first list will consist of ETFs, while the second will feature stocks. Please note that in a number of cases these ETFs and stocks still reside in highly overbought territory. Because of that, we would look to gain exposure to these names on a pullback to more buyable ranges on their overbought/oversold readings or dollar cost average into a position as the chart normalizes. The criteria used to construct these lists can be found in the paragraphs below, and we have also highlighted an ETF and a stock from each list.
Financial ETFs Shopping List |
||||||||
| Symbol | Name | Price | Score | Trend | Yield | Overbought/Oversold Reading | ||
| FNCL | Fidelity MSCI Financials Index ETF | 35.15 | 5.82 | Positive | 1.80 |
|
||
| FXO | First Trust Financials AlphaDEX Fund | 27.49 | 3.67 | Positive | 1.37 |
|
||
| IAT | iShares U.S. Regional Banks ETF | 45.68 | 5.73 | Positive | 1.54 |
|
||
| IYF | iShares U.S. Financial ETF | 103.02 | 4.48 | Positive | 1.57 |
|
||
| IYG | iShares Dow Jones U.S. Financial Service ETF | 108.54 | 4.70 | Positive | 1.22 |
|
||
| KBE | SPDR S&P Bank ETF | 44.05 | 5.74 | Positive | 1.35 |
|
||
| KBWB | PowerShares KBW Bank Portfolio | 48.08 | 5.68 | Positive | 1.44 |
|
||
| KIE | SPDR S&P Insurance ETF | 83.19 | 4.48 | Positive | 1.48 |
|
||
| KRE | SPDR S&P Regional Banking ETF | 55.91 | 5.82 | Positive | 1.43 |
|
||
| PSCF | PowerShares S&P SmallCap Financials ETF | 53.06 | 4.72 | Positive | 2.22 |
|
||
| QABA | First Trust NASDAQ ABA Community Bank Index Fund | 53.18 | 5.77 | Positive | 1.07 |
|
||
| VFH | Vanguard Financials ETF | 60.39 | 5.84 | Positive | 1.77 |
|
||
| XLF | Financial Select Sector SPDR Fund | 23.70 | 5.80 | Positive | 2.15 |
|
||
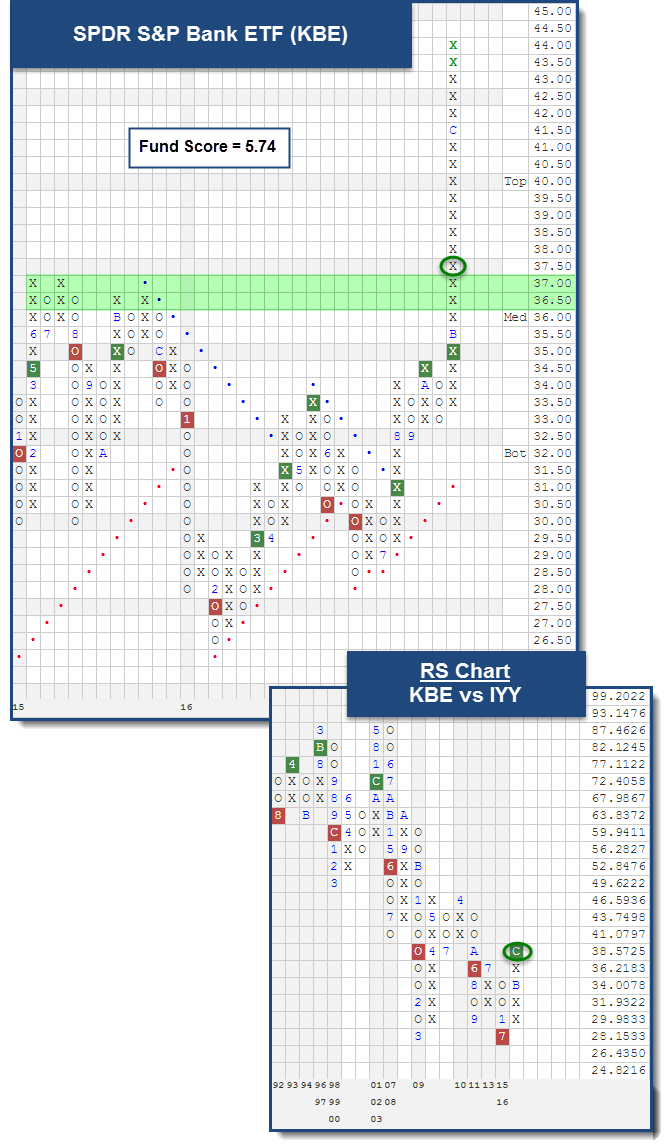
Our criteria for the ETF query consisted of Financials funds that have fund scores of 3 or higher, average volume greater than 10,000 shares, net assets north of $250 million, and are trading in a positive trend. One ETF from our list is the SPDR S&P Bank ETF KBE. With action in early November, KBE rallied above resistance in the $36.50 and $37 range to reach a new 52-week high. Since that time, KBE has continued to better those highs and recently hit the $44 level. This move to $44 caused KBE to give a buy signal on the market RS chart versus IYY. This buy signal is the first to occur on the chart since initially giving a sell signal back in June of 2008. Overall, KBE has a fund score of 5.74 and is quite strong at this time. It's also extremely overbought, as it's trading at +192% on its ten week trading band. So those who are looking to take exposure to KBE should look for the chart to normalize at these levels and dollar cost average into a position.
Financial Stocks Shopping List |
|||||||
| Symbol | Name | Price | Tech Attribute | Yield | Overbought/Oversold Reading | ||
| AKR | Acadia Realty Trust | 33.91 |
3 |
3.51 |
|
||
| AMH | American Homes 4 Rent | 21.04 |
3 |
0.95 |
|
||
| AON | Aon Corporation | 112.89 |
4 |
1.17 |
|
||
| ARE | Alexandria Real Estate Equities, Inc. | 110.62 |
4 |
3.00 |
|
||
| BAM | Brookfield Asset Management | 33.17 |
3 |
1.57 |
|
||
| BLK | BlackRock, Inc. | 390.33 |
4 |
2.35 |
|
||
| BMR | BioMed Realty Trust, Inc. | 23.81 |
4 |
4.37 |
|
||
| BNCN | BNC Bancorp. | 32.60 |
4 |
0.61 |
|
||
| BOH | Bank of Hawaii | 88.80 |
4 |
2.16 |
|
||
| BPOP | Popular, Inc. | 44.48 |
5 |
1.35 |
|
||
| CB | Chubb Ltd | 132.20 |
4 |
2.09 |
|
||
| CBSH | Commerce Bancshares | 58.82 |
3 |
1.53 |
|
||
| CLI | Mack-Cali Realty Corporation | 29.17 |
3 |
2.06 |
|
||
| CLNY | Colony Capital Inc | 20.77 |
3 |
7.70 |
|
||
| CMA | Comerica Incorporated | 69.62 |
5 |
1.32 |
|
||
| CSAL | Communications Sales & Leasing Inc | 25.78 |
3 |
9.31 |
|
||
| CYN | City National Corporation | 89.60 |
4 |
1.56 |
|
||
| DEI | Douglas Emmett, Inc. | 38.61 |
4 |
2.28 |
|
||
| EQC | CommonWealth REIT | 29.24 |
3 |
0.00 |
|
||
| EQIX | Equinix, Inc. | 346.46 |
4 |
2.02 |
|
||
| ESNT | Essent Group Ltd | 33.01 |
4 |
0.00 |
|
||
| ESRT | Empire State Realty Trust Inc. | 20.51 |
3 |
2.05 |
|
||
| ETFC | E*trade Group, Inc. | 35.44 |
5 |
0.00 |
|
||
| FAF | First American Financial Corporation | 37.45 |
3 |
3.63 |
|
||
| FFIN | First Financial Bankshares, Inc. | 46.15 |
5 |
1.56 |
|
||
| FNF | Fidelity National Financial, Inc. | 34.16 |
3 |
2.93 |
|
||
| FRC | First Republic Bank of San Francisco | 90.61 |
5 |
0.71 |
|
||
| HIW | Highwoods Properties Inc | 49.56 |
3 |
3.43 |
|
||
| HMST | Homestreet Inc | 31.05 |
4 |
0.00 |
|
||
| HR | Healthcare Realty Trust Incorporated | 30.59 |
3 |
3.92 |
|
||
| INFO | IHS Markit Ltd | 35.72 |
4 |
0.00 |
|
||
| JPM | J.P. Morgan Chase & Co. | 85.12 |
5 |
2.26 |
|
||
| KW | Kennedy-Wilson Holdings | 21.60 |
3 |
2.59 |
|
||
| LPLA | LPL Investment Holdings Inc | 35.91 |
4 |
2.79 |
|
||
| LPT | Liberty Property Trust | 40.48 |
3 |
4.69 |
|
||
| MA | Mastercard Inc. | 104.82 |
5 |
0.84 |
|
||
| PACW | PacWest Bancorp | 55.34 |
4 |
3.61 |
|
||
| PFG | Principal Financial Group | 60.86 |
3 |
2.83 |
|
||
| PRI | Primerica Inc. | 71.30 |
5 |
1.01 |
|
||
| SFR | Starwood Waypoint Residential Trust. | 30.62 |
3 |
2.87 |
|
||
| SIR | Select Income Reit | 25.61 |
3 |
7.97 |
|
||
| STT | State Street Corporation | 81.44 |
3 |
1.87 |
|
||
| UE | Urban Edge Properties | 27.86 |
4 |
3.16 |
|
||
| VOYA | ING US Inc. | 40.64 |
3 |
0.10 |
|
||
| WBS | Webster Financial Corporation | 54.32 |
5 |
1.84 |
|
||
| WFC | Wells Fargo & Company | 57.29 |
3 |
2.65 |
|
||
| WRB | W. R. Berkley Corporation | 64.78 |
3 |
0.80 |
|
||
| WRE | Washington Real Estate Investment Trust | 32.42 |
3 |
3.70 |
|
||
| WTFC | Wintrust Financial Corporation | 71.13 |
5 |
0.68 |
|
||
| Z | Zillow Group Inc. Class C | 36.97 |
5 |
0.00 |
|
||
Our criteria for the stock query consisted of optionable Financial stocks that have at least $20 in price, have at least 3 technical attributes, are in a positive trend, have an average volume of 250,000 shares, and offer a reward to risk ratio north of 2. A stock from our list that many have wondered about is J.P. Morgan Chase & Co. JPM. JPM was able to rally above resistance at the $69 and $70 range during the early part of November and rally up to the $80 level to reach a new all-time high. JPM briefly pulled back, establishing a higher bottom at $77, and then moved back into a column of X’s to form a double top at $80. As we moved into December, JPM rallied above the $81 level to break a double top for a second consecutive buy signal. JPM has since moved up to the $85 level to better its all-time high. From a relative standpoint, JPM was able to give a RS buy signal versus the S&P 500 Equal-Weighted Index SPXEWI. This is the first buy signal on the chart since initially giving a sell signal back in September of 2011. This buy signal brought JPM up to a 5 for 5’er in technical attribute rating. Like KBE, since it's so overbought, we would look to dollar cost average into a position at this time. Unlike KBE, JPM has been able to establish a higher bottom to offer up support closer to current trading levels.

I recently saw a presentation by Nadia Papagiannis, CFA, of Goldman Sachs Asset Management that provided some important insights into the landscape for asset allocation. Consider the table below, which compares the performance of a number of asset classes (Commodities, Emerging Market Debt, U.S. Bonds, High Yield, U.S. Real Estate, International Real Estate, Bank Loans, Hedge Funds, Emerging Market Equities, International Equities, International Small Cap, U.S Small Cap) to the performance of U.S. Large Cap Equities.
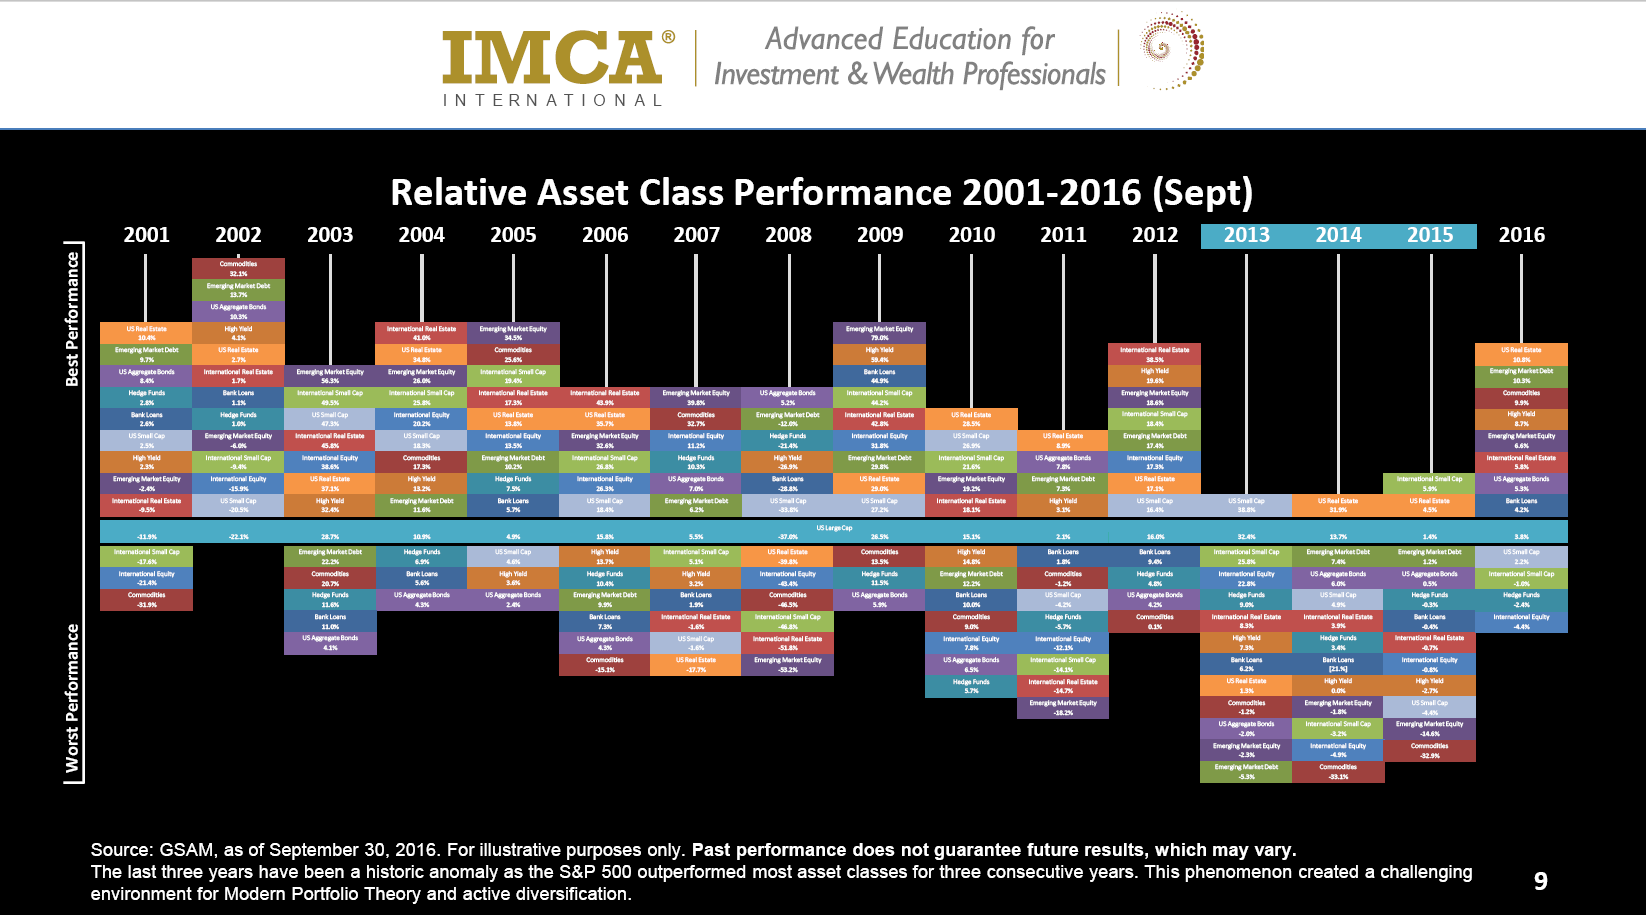
What stands out about the years 2013-2015? Very few asset classes outperformed U.S. Large Cap Equities during those years. This goes a long ways towards explaining why most people who have employed some form of asset allocation (anything that diversified away from Large Cap US Equities) have probably been left underwhelmed with their performance during those three years.
True to the human condition, recency bias has been in full effect in recent years as it applies to tactical allocation with people questioning the category's merits. However, I would suggest that clients may benefit from reviewing a table like that shown above to remember that not all years are like 2013-2015 (if they were there wouldn't be much need to own anything besides U.S. Large Cap Equities).
To me, there are five key reasons why investors would do well to consider making tactical asset allocation part of the mix:
Dorsey Wright provides a full suite of tactical asset allocation tools and solutions such as our Global Macro SMA/UMA, The Arrow DWA Tactical and Balanced Funds, The Arrow DWA Tactical ETF, DALI, Tactical Tilt Models, and more. If you would like to discuss different tools and solutions in this area, please call Andy Hyer at 626-535-0630 or andyh@dorseymm.com.
The relative strength strategy is NOT a guarantee. There may be times where all investments and strategies are unfavorable and depreciate in value.
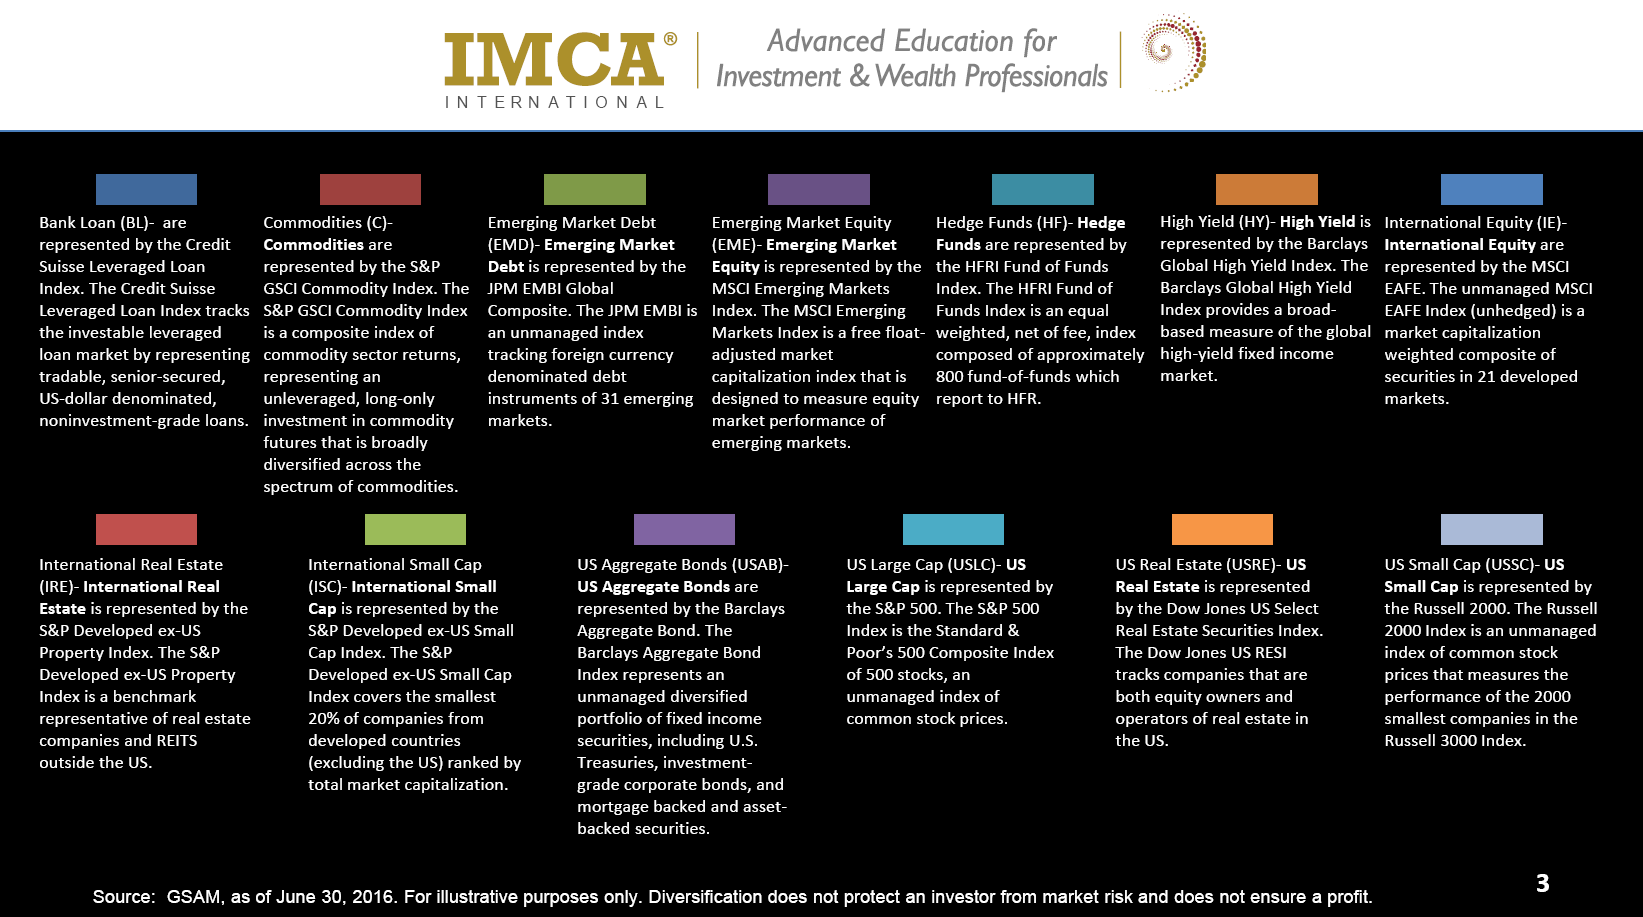
Indices are unmanaged. The figures for the index reflect the reinvestment of all income or dividends, as applicable, but do not reflect the deduction of any fees or expenses which would reduce returns. Investors cannot invest directly in indices. The indices referenced herein have been selected because they are well known, easily recognized by investors, and reflect those indices that the Investment Manager believes, in part based on industry practice, provide a suitable benchmark against which to evaluate the investment or broader market described herein. The exclusion of "failed" or closed hedge funds may mean that each index overstates the performance of hedge funds generally. Starting point selected given longest common index inception. HFRI FoF = HFRI Fund of Funds Composite Index; HFRI and related indices are trademarks and service marks of Hedge Fund Research, Inc. ("HFR") which has no affiliation with GSAM. Information regarding HFR indices was obtained from HFR's website and other public sources and is provided for comparison purposes only. HFR does not endorse or approve any of the statements made herein.

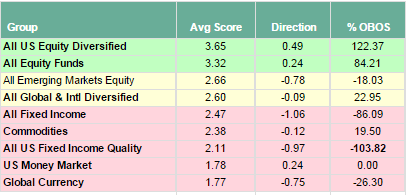
Considering the biggest asset blocks available to your allocation, US Equity is not only above the score of the average equity fund of any kind, but more importantly it is tracking a full score point above the next available asset class. In some sense, this score spread is massive enough to give you solid confidence that your US equity allocation is the most important piece of the puzzle that you need to not only pay attention to, but also get right as to what you're specifically doing.
If the EAFE is your benchmark, then you are already beating it handsomely - but the client has never nor will ever will look at the EAFE as a benchmark. Rather, they will use the Dow Jones and the S&P 500 as their benchmarks. The task here is for you to set the allocation so that it has a chance to beat those benchmarks. In doing so, you will need to take your tools and skills to isolate which configuration of your inventory can achieve this goal.
Keep open to any new nuance that could lead to something important, or that could help you navigate the end of this year and the beginning of the next. Although many say that Technology is not participating in an outperformance mode in this Trump rally and you should look elsewhere, keep in mind that this group actually is the third strongest asset group on the system. So, which sentiment is true - what they say or “what is”?
Consumer Cycs have crossed above the 4 score line and in some sense is about to print the highest score we have seen all year. This upswing will bring more new options onto the score radar in your inventory, so get ahead of this event.
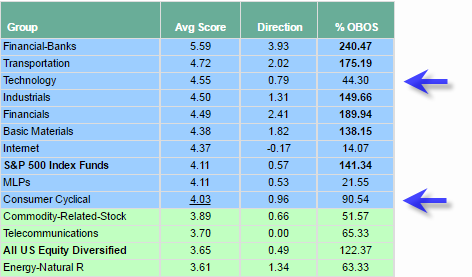
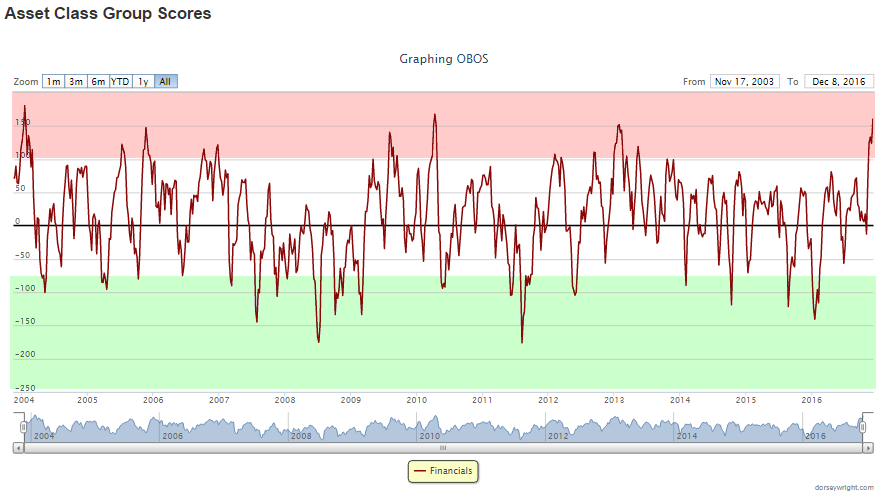
Financials, which include the subset of Financial Banks, have stretched up the OBOS reading to this printing near 190%. It is in the neighborhood of 199% which is the high watermark we have seen in the past rolling decade. Remember that a OBOS reading on the high side tends to suggest the need for the asset class to cool off on its acceleration and possibly indicates a need for a pullback in price. High side OBOS readings tend to be indicative that you should be more careful on creating new positions at these tops. Wait for the OBOS level to cool down, which as you know may or may not be accompanied by a pullback in price.
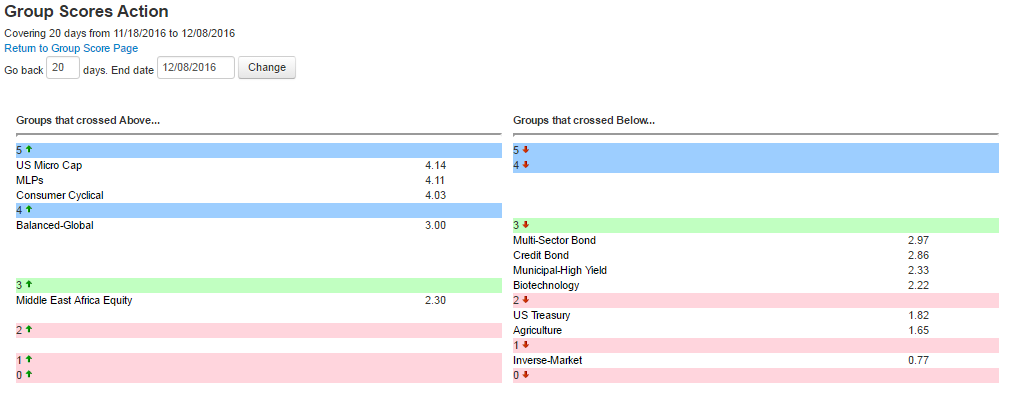
It will be a working 2016 and 2017 to stay on the curve. One reason for the “working” statement is that the market is showing rotation after rotation. What was true at the start of the year was not true at the beginning of the second quarter. More change came in the summer and then again at the election and still more motion is detected now. Below is just the activity of which groups passed through a score “Integer” over the last few weeks. The way to read this report is that those groups on the left are climbing up in score and getting to a new score integer, i.e. passing from the 3’s to the 4’s. Those groups on the right are moving down through a score integer, i.e. moving from the 3’s down to the 2’s. When you detect that “rotation” itself actually becomes a theme, you’ll have to stay on your toes, ready to adjust and then re-adjust your allocation to stay harmonious with what the market is doing. All of this activity means that you’re doing more work.
The Distribution Report below places Major Market ETFs and Indices into a bell curve style table based upon their current location on their 10-week trading band. The middle of the bell curve represents areas of the market that are "normally" distributed, with the far right being 100% overbought on a weekly distribution and the far left being 100% oversold on a weekly distribution. The weekly distribution ranges are calculated at the end of each week, while the placement within that range will fluctuate during the week. In addition to information regarding the statistical distribution of these market indexes, a symbol that is in UPPER CASE indicates that the RS chart is on a Buy Signal. If the symbol is dark Green then the stock is on a Point & Figure buy signal, and if the symbol is bright Red then it is on a Point & Figure sell signal.
The average Bullish Percent reading this week is 59.69% up 2.85% from the previous week
| <--100 | -100--80 | -80--60 | -60--40 | -40--20 | -20-0 | 0-20 | 20-40 | 40-60 | 60-80 | 80-100 | 100-> | |||
 |
||||||||||||||
| Symbol | Name | Symbol | Name |
| AGG | iShares Barclays Aggregate Bond Fund | NASD | Nasdaq Composite |
| CL/ | Crude Oil Continuous | NDX | NASDAQ Non Financial Index |
| DJIA | Dow Jones Industrial Average | RSP | Guggenheim S&P 500 Equal Weight ETF |
| DVY | iShares Dow Jones Select Dividend Index | RUT | Russell 2000 Index |
| DX/Y | NYCE U.S.Dollar Index Spot | SHY | iShares Barclays 1-3 Year Tres. Bond Fund |
| EFA | iSharesMSCI EAFE Index Fund | SML | S&P 600 Small Cap Index |
| FXE | CurrencyShares Euro Trust | SPX | S & P 500 Index |
| GC/ | Gold Continuous | TLT | iShares Barclays 20+ Year Treasury Bond Fund |
| GSG | iShares S&P GSCI Commodity-Indexed Trust | UV/Y | Continuous Commodity Index |
| HYG | iShares High Yield Corporate Bond Fund | VOOG | Vanguard S&P 500 Growth ETF |
| ICF | iShares Cohen & Steers Realty Index | VOOV | Vanguard S&P 500 Value ETF |
| IEF | iShares Lehman 7-10 Yr. Tres. Bond Fund | VWO | Vanguard MSCI Emerging Markets ETF |
| LQD | iShares iBoxx $ Investment Grade Corp. | XLG | Guggenheim Russell Top 50 ETF |
| MID | S&P 400 MidCap Index |

| Stock | Symbol | Sector | Current Price | Action Price | Target | Stop | Notes |
|---|---|---|---|---|---|---|---|
| Franklin Electric Co | FELE | Machinery and Tools | $42.10 | low-40s | 60 | 34/30 | 5/5'er, RS buy signal generated in July, Top 25% of sector matrix. |
| Align Technology, Inc. | ALGN | Healthcare | $99.30 | 95-99 | 114 inc. | 91/83 | 5 for 5'er, leader in favored HEAL sector, raise trader stop to $91. |
| Noble Energy Inc. | NBL | Oil | $39.57 | hi-30s | 53 | 32 | 3/5'er, Positive Trend change, Improving RS, Rally thru all near-term resistance. |
| Papa Johns Intl Inc | PZZA | Restaurants | $87.42 | 86-90 | 111 | 73 | 5 for 5'er, #1 spot in Restaurant sector matrix, pulled back from new all time highs, strong small cap play |
| Murphy Oil Corp | MUR | Oil | $33.16 | 31-34 | low-50s | 27 | 3/5'er, Yield of 3%, Top 15 of Oil Sector matrix, Quadruple top breakout, Potential covered write with April 35 calls. |
| Citrix Systems, Inc. | CTXS | Software | $90.00 | 86-91 | 104 | 80 | 3/5'er, Big Base Breakout, Potential New Peer RS buy signal. |
| Golar LNG Ltd | GLNG | Transports/Non Air | $23.99 | 23-24 | 37.50 | 21/19.5 | 5 for 5'er, favored TRAN sector, consecutive higher tops and higher bottoms, good R-R |
| Stock | Symbol | Sector | Current Price | Action Price | Target | Stop | Notes |
|---|---|---|---|---|---|---|---|
| Morningstar, Inc. | MORN | Finance | $75.53 | (73-77) | 65 | 82 | 0 for 5'er, laggard in otherwise strong Finance sector, consecutive sell signals, reverted to mean off of 52-week low |
| Stock | Symbol | Sector | Current Price | Action Price | Target | Stop | Notes |
|---|---|---|---|---|---|---|---|
| Gentherm Inc. | THRM | Autos and Parts | $33.50 | low 30's | 25 | 35/38 | No new positions here, continue to abide by $35 buy stop for traders and $38 for longer term investors |
| Comment | |||||||
|---|---|---|---|---|---|---|---|
|
|
|||||||
GLNG Golar LNG Ltd R ($23.81) - Transports/Non Air - GLNG is one of the stronger members within the Transports/Non Air sector, which is currently favored and had a recent reversal up into Xs on its bullish percent chart. The chart has maintained a consistent pattern of higher tops and higher bottom, completing its fifth consecutive buy signal just last month at $26. It has since pulled back to offer a more attractive entry point. Okay to initiate new positions here between $23 and $24. Traders can look to $21 as a tight stop, while investors can look to $19.50, which would be a violation of its bullish support line. The 0.5-point per box chart offers a price objective of $37.50, allowing for an attractive reward to risk ratio.
| 16 | |||||||||||||||||||||||||||||||||||||||||||||||||||||
| 26.00 | • | X | 26.00 | ||||||||||||||||||||||||||||||||||||||||||||||||||
| 25.00 | • | • | X | O | X | 25.00 | |||||||||||||||||||||||||||||||||||||||||||||||
| 24.00 | • | X | • | X | X | O | X | 24.00 | |||||||||||||||||||||||||||||||||||||||||||||
| 23.00 | • | X | O | • | A | O | X | O | X | Med | 23.00 | ||||||||||||||||||||||||||||||||||||||||||
| 22.00 | • | • | X | O | • | X | O | X | O | 22.00 | |||||||||||||||||||||||||||||||||||||||||||
| 21.00 | X | • | X | • | • | X | O | • | X | 9 | B | 21.00 | |||||||||||||||||||||||||||||||||||||||||
| 20.00 | X | X | X | X | O | X | O | X | • | X | O | • | X | O | X | 20.00 | |||||||||||||||||||||||||||||||||||||
| 19.50 | X | O | X | O | X | O | 3 | X | O | X | X | O | X | O | X | O | • | X | O | X | • | 19.50 | |||||||||||||||||||||||||||||||
| 19.00 | X | O | X | O | X | O | X | O | X | O | X | O | X | O | X | O | X | O | • | • | X | O | • | 19.00 | |||||||||||||||||||||||||||||
| 18.50 | X | O | X | O | X | O | X | X | O | X | O | X | O | X | O | 4 | O | O | X | X | • | X | X | • | 18.50 | ||||||||||||||||||||||||||||
| 18.00 | X | O | X | O | X | O | X | O | X | O | X | O | X | O | O | X | • | O | X | O | X | X | O | • | • | X | O | X | • | 18.00 | |||||||||||||||||||||||
| 17.50 | X | O | X | O | X | 2 | X | O | X | X | O | O | • | O | X | • | O | X | O | X | O | X | O | X | • | X | • | X | X | O | X | • | 17.50 | ||||||||||||||||||||
| 17.00 | O | X | X | O | O | X | O | X | X | O | X | • | O | • | O | 5 | X | O | X | O | X | O | X | O | X | O | • | X | O | X | O | X | • | Bot | 17.00 | ||||||||||||||||||
| 16.50 | O | 1 | O | X | O | X | O | X | O | X | O | X | • | • | O | X | O | X | O | 6 | O | X | O | X | O | X | • | X | O | X | 8 | • | 16.50 | ||||||||||||||||||||
| 16.00 | O | X | O | X | O | O | X | O | X | O | X | • | O | X | O | X | O | X | O | O | X | O | X | O | X | • | 16.00 | ||||||||||||||||||||||||||
| 15.50 | O | X | O | X | O | X | O | X | O | X | • | O | O | O | X | O | X | O | X | O | • | 15.50 | |||||||||||||||||||||||||||||||
| 15.00 | O | X | O | X | O | X | O | O | • | O | O | X | 7 | • | • | 15.00 | |||||||||||||||||||||||||||||||||||||
| 14.50 | O | X | O | X | O | X | • | O | • | • | 14.50 | ||||||||||||||||||||||||||||||||||||||||||
| 14.00 | O | X | O | X | O | • | • | 14.00 | |||||||||||||||||||||||||||||||||||||||||||||
| 13.50 | O | O | X | • | 13.50 | ||||||||||||||||||||||||||||||||||||||||||||||||
| 13.00 | O | X | • | 13.00 | |||||||||||||||||||||||||||||||||||||||||||||||||
| 12.50 | O | X | • | 12.50 | |||||||||||||||||||||||||||||||||||||||||||||||||
| 12.00 | O | X | • | 12.00 | |||||||||||||||||||||||||||||||||||||||||||||||||
| 11.50 | O | X | • | 11.50 | |||||||||||||||||||||||||||||||||||||||||||||||||
| 11.00 | O | X | • | 11.00 | |||||||||||||||||||||||||||||||||||||||||||||||||
| 10.50 | O | X | • | 10.50 | |||||||||||||||||||||||||||||||||||||||||||||||||
| 10.00 | O | X | • | 10.00 | |||||||||||||||||||||||||||||||||||||||||||||||||
| 9.50 | O | • | 9.50 | ||||||||||||||||||||||||||||||||||||||||||||||||||
| 16 |
| Comments |
|---|
| ABAX Abaxis Inc ($53.91) - Healthcare - broke a double top at $54. The stock is back on a buy signal and this break also violates the bearish resistance line giving the stock its second positive technical attribute. ABAX still faces resistance at $54 and a move to $55 will be a spread triple top break. Traders only should consider the stock on that break as it still lacks relative strength versus the market and peers, |
| CLW Clearwater Paper Corp. ($65.95) - Forest Prods/Paper - broke a triple top at $66. This break follows a higher bottom and puts the stock back on a buy signal after breaking a double bottom in October at $59. The stock has only one positive technical attribute, positive trend, and its RS charts are on sell signals and in Os. This would be a stock to watch to see if it can improve on a RS basis with a reversal to Xs on its RS charts. Next resistance for CLW is at $69 and a move on this chart to $61 will put it back on a sell signal. |
| DLR Digital Realty Trust, Inc. ($94.20) - Real Estate - broke a double top at $95. This is the second consecutive buy signal since holding the bullish support line. Although it has only two positive technical attributes the chart appears to be controlled by demand. Traders can consider the stock here with an initial stop loss of $85, a spread triple bottom break that follows a violation of the bullish support line. DLR has an attractive yield of 3.7%. |
| EFII Electronics For Imaging Inc ($44.56) - Computers - Broke a double top at $46. This chart has been on a buy signal since May 2016 but has not managed to break out of a large base formed in the upper $30s to upper $40s over the past couple years. While it has four positive technical attributes, we would watch for the chart to develop further and improve on a RS basis relative to other computer stocks. Currently EFII ranks 31 out of 40 in its sector matrix. |
| EXPO Exponent Inc ($64.10) - Business Products - broke a triple top at $64. This is the second buy signal and move to a new chart high for this stock. It possesses all five positive technical attributes and has a strong price objective of $92. OK to consider EXPO on this break with a stop loss of $59, a triple bottom break. Under that level the next support on the chart is at $53, the bullish support line. |
| FUN Cedar Fair, L.P. ($62.24) - Leisure - broke a triple top at $62. This break comes after the stock was able to hold its support at $57 a level its tested four times. The Leisure sector is favored and this stock is a 5 for 5'er. Positions can be considered on this breakout and pullbacks. The stock has a bullish price objective of $78. Trouble on the chart will be a move to $56 which will be a quintuple bottom break and violation of the bullish support line. |
| KN Knowles Corp ($17.05) - Electronics - broke a double to at $17. This break follows a triple top break at $16.50 and completes a bullish catapult formation. The stock is in a positive trend and its RS charts are in Xs giving it three positive technical attributes. Demand is in control of the chart and positions can be considered here and on a pullback. A stop loss can be kept at $14, a spread double bottom break that follows a violation of the bullish support line. |
| MTN Vail Resorts Inc ($166.77) - Leisure - broke a double top at $168. This is the fourth consecutive buy signal since June 2016 and is a new chart high. The stock has also made higher bottoms and shows that demand is in control. Positions cab be considered here with a stop loss of $150, a spread double bottom break. Under that level the next support on the chart is at $134. The stock ranks 4th among 53 others in its sector matrix. |
| POST Post Holdings Inc ($78.44) - Food Beverages/Soap - broke a double top at $79. This is the third consecutive buy signal and the move violates the bearish resistance line. The move to a positive trend give the stock its fourth positive technical attribute. Although the sector is unfavored traders can consider the stock on the break, A stop loss can be kept at $74, a double bottom break and violation of the bullish support line. |
| PX Praxair, Inc. ($123.87) - Chemicals - broke a double top at $124. This is the third consecutive buy signal on the chart but the stock has only manged to obtain two positive technical attributes, Both the RS charts (market and peers) are in a column of Os and we would watch to see that improve before considering new positions. A move on the chart to $114 will be a triple bottom break with the next support on the chart at $106, the bullish support line. |
| Name | Option Symbol | Action | Stop Loss |
|---|---|---|---|
| Accenture PLC - $123.35 | O:ACN 17E115.00D19 | Buy the May 115.00 calls at 12.20 | 114.00 |
| Name | Option | Action |
|---|---|---|
| Hawaiian Holdings, Inc. ( HA) | Jan. 45.00 Calls | Raise the option stop loss to 9.10 (CP: 11.10) |
| United Continental Holdings Inc. ( UAL) | Mar. 50.00 Calls | Raise the option stop loss to 23.20 (CP: 25.20) |
| Apple Inc. ( AAPL) | Apr. 105.00 Calls | Initiate an option stop loss of 9.75 (CP: 11.75) |
| Name | Option Symbol | Action | Stop Loss |
|---|---|---|---|
| Universal Health Services, Inc. - $111.99 | O:UHS 17P115.00D21 | Buy the April 115.00 puts at 11.10 | 118.00 |
| Name | Option | Action |
|---|---|---|
|
|
||
| Name | Option Sym. | Call to Sell | Call Price | Investment for 500 Shares | Annual Called Rtn. | Annual Static Rtn. | Downside Protection |
|---|---|---|---|---|---|---|---|
| Carmax Group $64.16 | O:KMX 17D65.00D21 | Apr. 65.00 | 4.20 | $29,670.35 | 23.27% | 16.32% | 5.61% |
| Name | Action |
|---|---|
| General Cable Corp (BGC) - 19.75 | Sell the February 20.00 Calls. |
| United Rentals, Inc. (URI) - 108.30 | Sell the March 110.00 Calls. |
| Zillow Group Inc. Class C (Z) - 36.97 | Sell the May 40.00 Calls. |
| Dish Network Corporation (DISH) - 59.93 | Sell the March 62.50 Calls. |
| Name | Covered Write |
|---|---|
|
|
|
Daily Equity & Market Analysis
Loading, Please Wait...
