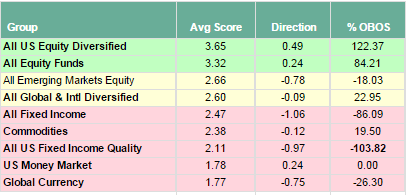
Considering the biggest asset blocks available to your allocation, US Equity is not only above the score of the average equity fund of any kind, but more importantly it is tracking a full score point above the next available asset class.
Considering the biggest asset blocks available to your allocation, US Equity is not only above the score of the average equity fund of any kind, but more importantly it is tracking a full score point above the next available asset class. In some sense, this score spread is massive enough to give you solid confidence that your US equity allocation is the most important piece of the puzzle that you need to not only pay attention to, but also get right as to what you're specifically doing.
If the EAFE is your benchmark, then you are already beating it handsomely - but the client has never nor will ever will look at the EAFE as a benchmark. Rather, they will use the Dow Jones and the S&P 500 as their benchmarks. The task here is for you to set the allocation so that it has a chance to beat those benchmarks. In doing so, you will need to take your tools and skills to isolate which configuration of your inventory can achieve this goal.
Keep open to any new nuance that could lead to something important, or that could help you navigate the end of this year and the beginning of the next. Although many say that Technology is not participating in an outperformance mode in this Trump rally and you should look elsewhere, keep in mind that this group actually is the third strongest asset group on the system. So, which sentiment is true - what they say or “what is”?
Consumer Cycs have crossed above the 4 score line and in some sense is about to print the highest score we have seen all year. This upswing will bring more new options onto the score radar in your inventory, so get ahead of this event.
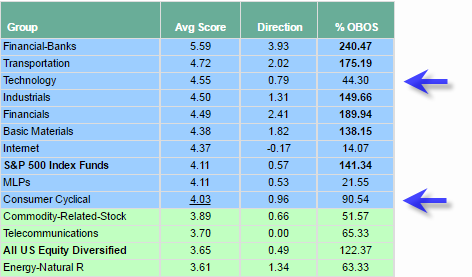
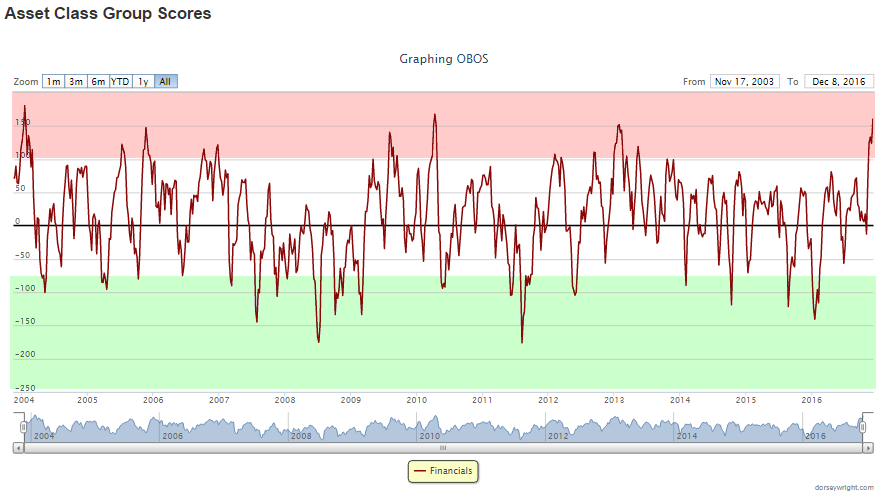
Financials, which include the subset of Financial Banks, have stretched up the OBOS reading to this printing near 190%. It is in the neighborhood of 199% which is the high watermark we have seen in the past rolling decade. Remember that a OBOS reading on the high side tends to suggest the need for the asset class to cool off on its acceleration and possibly indicates a need for a pullback in price. High side OBOS readings tend to be indicative that you should be more careful on creating new positions at these tops. Wait for the OBOS level to cool down, which as you know may or may not be accompanied by a pullback in price.
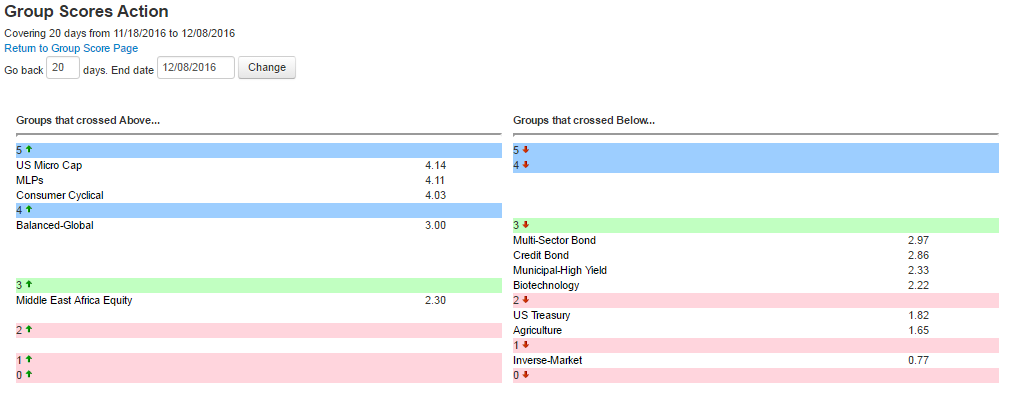
It will be a working 2016 and 2017 to stay on the curve. One reason for the “working” statement is that the market is showing rotation after rotation. What was true at the start of the year was not true at the beginning of the second quarter. More change came in the summer and then again at the election and still more motion is detected now. Below is just the activity of which groups passed through a score “Integer” over the last few weeks. The way to read this report is that those groups on the left are climbing up in score and getting to a new score integer, i.e. passing from the 3’s to the 4’s. Those groups on the right are moving down through a score integer, i.e. moving from the 3’s down to the 2’s. When you detect that “rotation” itself actually becomes a theme, you’ll have to stay on your toes, ready to adjust and then re-adjust your allocation to stay harmonious with what the market is doing. All of this activity means that you’re doing more work.