Most Requested Symbols


State Street Sector Model (SSTREET): One Change
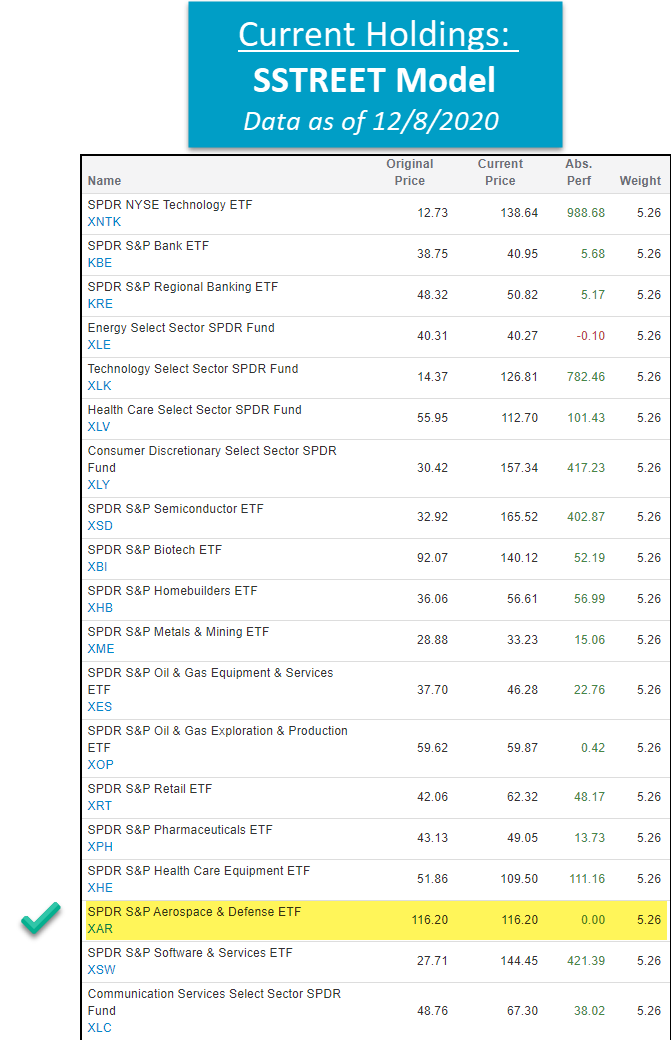
Buy Aerospace & Defense (XAR)
As a refresher, the State Street Sector Model SSTREET monitors the Relative Strength (RS) relationships between each of the sector and industry ETFs in the model universe versus the S&P 500 Index (SPX) on a 6.5% scale. ETFs that are showing positive RS versus SPX (measured by a column of Xs) are included in the model and are removed only when that relationship reverses into Os. Over the past week of trading, the RS chart comparing the SPDR S&P Aerospace & Defense ETF XAR versus the S&P 500 Index reversed up into Xs, warranting its addition to the SSTREET model. This model remains fully invested through sector-based ETFs within the broader State Street family of ETFs and is evaluated on a weekly basis. The number of holdings can vary based on sector leadership within changing markets, and with the addition of XAR, the model is equally weighted across 19 positions at 5.26% each. Year-to-date, the SSTREET model is up 26.05%, outperforming the S&P 500's return of 14.59% (through 12/8).

Like a radar screen, the Weekly Activity Summary gives you a snap shot view of any technical changes to the State Street universe of ETFs. Included in the summary below are both long term technical changes and intermediate term technical changes.
| Symbol | Name | Price | Score | 30 Day Rtn | 90 Day Rtn | YTD Rtn |
|---|---|---|---|---|---|---|
| BIL | SPDR Bloomberg Barclays 1-3 Month T-Bill ETF | 91.510 | 0.3683 | -0.011 | -0.022 | 0.087 |
| SPBO | SPDR Portfolio Corporate Bond ETF | 35.970 | 3.2052 | 0.728 | 1.124 | 6.341 |
| SPLB | SPDR Portfolio Long Term Corporate Bond ETF | 32.770 | 3.2215 | 1.392 | 2.502 | 8.834 |
| XLK | Technology Select Sector SPDR Fund | 126.810 | 4.3630 | 4.302 | 8.887 | 38.333 |
| Symbol | Name | Price | Score | 30 Day Rtn | 90 Day Rtn | YTD Rtn |
|---|---|---|---|---|---|---|
| SPMB | SPDR Portfolio Mortgage Backed Bond ETF | 26.460 | 1.6820 | -0.226 | -0.787 | 1.340 |
| ULST | SPDR SSgA Ultra Short Term Bond ETF | 40.470 | 1.0981 | 0.122 | 0.099 | 0.172 |
| Symbol | Name | Price | Score | 30 Day Rtn | 90 Day Rtn | YTD Rtn |
|---|---|---|---|---|---|---|
| GXC | SPDR S&P China ETF | 129.400 | 3.6577 | -1.828 | 9.847 | 26.059 |
| BIL | SPDR Bloomberg Barclays 1-3 Month T-Bill ETF | 91.510 | 0.3683 | -0.011 | -0.022 | 0.087 |
| XHB | SPDR S&P Homebuilders ETF | 56.610 | 5.3572 | -0.176 | 8.262 | 24.390 |
| SPSB | SPDR Portfolio Short Term Corporate Bond ETF | 31.360 | 2.4014 | -0.032 | 0.000 | 1.686 |
The distribution curve places each ETF on a bell curve according to their respective degrees of overbought or oversold status using a 10-week distribution. ETFs that are statistically oversold will appear on the left-hand side of the bell curve, while those that have become statistically overbought will appear on the right-hand side of the bell curve. Perhaps the most useful attribute of this feature is that it displays the entire universe on the curve at one time with an "average level" to give us a general picture of whether the State Street ETF universe is generally overbought on a near-term basis, or generally oversold. Our best opportunities are to buy strong market ETFs that have regressed back toward mean conditions based on market weakness, or have become oversold based upon extreme market weakness.
Weekly Distribution is a short-term gauge that is most helpful in timing entry and exit points, while the longer-term information of trend and relative strength is a more controlling factor in the decision of whether to buy or sell. The Distribution Curve below displays those ETFs with positive RS in uppercase letters and those ETFs with poor RS versus the market in lowercase letters. As well, those ETFs that are on a Point & Figure Buy signal appear in Green letters, while those on Sell signals can appear in Red letters. Box Color indicates the Sector Status Rating. Green = Favored, Yellow = Average, and Red = Unfavored.
Average Level 80.99
<--100
-100--80
-80--60
-60--40
-40--20
-20-0
0-20
20-40
40-60
60-80
80-100
100->


The DWA Matrix uses a Point & Figure relative strength comparison of each index to one another to identify the strongest and the weakest among the universe used. The ETFs with the most relative strength buy signals (suggesting outperformance) versus the others in the group are listed at the top. These ETFs should be overweighted in the portfolio. Those ETFs with the least amount of relative strength buy signals versus the others in the group are listed at the bottom. These ETFs should be underweighted in the portfolio.
| Ticker | Name | Buys | Xs | Tech Attribute/ Score |
|---|---|---|---|---|
| MDYG | SPDR S&P 400 Mid Cap Growth ETF | 14 | 14 | 5.36 |
| SPYG | SPDR S&P 500 Growth ETF | 14 | 7 | 4.50 |
| SPLG | SPDR Portfolio S&P 500 ETF | 11 | 8 | 4.20 |
| SPTM | SPDR Portfolio S&P 1500 Composite Stock Market ETF | 11 | 6 | 4.23 |
| SLYG | SPDR S&P 600 Small Cap Growth ETF | 10 | 15 | 4.24 |
| SPY | SPDR S&P 500 ETF Trust | 10 | 7 | 4.11 |
| DIA | SPDR Dow Jones Industrial Average ETF Trust | 10 | 5 | 3.85 |
| MDY | SPDR S&P MIDCAP 400 ETF Trust | 8 | 14 | 3.48 |
| SLYV | SPDR S&P 600 Small Cap Value ETF | 8 | 11 | 3.95 |
| SDY | SPDR S&P Dividend ETF | 8 | 2 | 2.91 |
| SPYV | SPDR S&P 500 Value ETF | 7 | 2 | 2.94 |
| SLY | SPDR S&P 600 Small Cap ETF | 5 | 12 | 3.38 |
| MDYV | SPDR S&P 400 Mid Cap Value ETF | 5 | 10 | 3.20 |
| DGT | SPDR DJ Global Titans ETF | 5 | 6 | 3.41 |
| CWI | SPDR MSCI ACWI ex-US ETF | 4 | 3 | 3.25 |
| SPMD | SPDR Portfolio S&P 400 Mid Cap ETF | 3 | 13 | 3.38 |
| GLD | SPDR Gold Trust | 0 | 0 | 2.87 |
Ticker
Name
Buys
Xs
Tech
Attribute/
Score
GXC
SPDR S&P China ETF
15
5
3.66
GMF
SPDR S&P Emerging Asia Pacific ETF
14
12
5.54
SPY
SPDR S&P 500 ETF Trust
13
11
4.11
DIA
SPDR Dow Jones Industrial Average ETF Trust
12
9
3.85
SPEM
SPDR Portfolio Emerging Markets ETF
10
12
4.24
DGT
SPDR DJ Global Titans ETF
10
9
3.41
CWI
SPDR MSCI ACWI ex-US ETF
9
7
3.25
SPDW
SPDR Portfolio Developed World ex-US ETF
7
8
3.23
EWX
SPDR S&P Emerging SmallCap
6
13
4.46
SPEU
SPDR Portfolio Europe ETF
5
7
3.03
FEZ
SPDR EURO STOXX 50 ETF
5
5
2.91
GWX
SPDR S&P International Small Cap ETF
4
12
4.05
GII
The SPDR FTSE/Macquarie Global Infrastructure 100
4
4
2.74
RWO
SPDR DJ Wilshire Global Real Estate
2
3
2.68
RWX
SPDR DJ Wilshire International Real Estate ETF
1
1
1.44
DWX
SPDR S&P International Dividend
0
2
2.22
| Ticker | Name | Buys | Xs | Tech Attribute/ Score |
|---|---|---|---|---|
| XSD | SPDR S&P Semiconductor ETF | 29 | 25 | 5.89 |
| XHB | SPDR S&P Homebuilders ETF | 27 | 6 | 5.36 |
| KRE | SPDR S&P Regional Banking ETF | 26 | 24 | 4.00 |
| XSW | SPDR S&P Software & Services ETF | 25 | 19 | 5.64 |
| XHS | SPDR S&P Health Care Services ETF | 24 | 24 | 5.58 |
| XNTK | SPDR NYSE Technology ETF | 24 | 16 | 5.02 |
| XME | SPDR S&P Metals & Mining ETF | 23 | 29 | 4.50 |
| KBE | SPDR S&P Bank ETF | 21 | 25 | 3.94 |
| XRT | SPDR S&P Retail ETF | 21 | 23 | 4.75 |
| XLY | Consumer Discretionary Select Sector SPDR Fund | 20 | 11 | 4.27 |
| XLK | Technology Select Sector SPDR Fund | 20 | 7 | 4.36 |
| XTN | SPDR S&P Transportation ETF | 19 | 22 | 5.35 |
| XLI | Industrial Select Sector SPDR Fund | 19 | 18 | 4.07 |
| XBI | SPDR S&P Biotech ETF | 18 | 22 | 5.86 |
| KCE | SPDR S&P Capital Markets ETF | 18 | 18 | 4.74 |
| XHE | SPDR S&P Health Care Equipment ETF | 18 | 11 | 5.43 |
| XES | SPDR S&P Oil & Gas Equipment & Services ETF | 16 | 31 | 3.83 |
| XLB | Materials Select Sector SPDR Fund | 16 | 15 | 4.26 |
| XAR | SPDR S&P Aerospace & Defense ETF | 14 | 25 | 5.21 |
| XOP | SPDR S&P Oil & Gas Exploration & Production ETF | 13 | 21 | 2.48 |
| XLC | Communication Services Select Sector SPDR Fund | 13 | 8 | 4.32 |
| KIE | SPDR S&P Insurance ETF | 12 | 14 | 2.94 |
| XLV | Health Care Select Sector SPDR Fund | 11 | 6 | 3.86 |
| XTL | SPDR S&P Telecom ETF | 9 | 11 | 3.39 |
| XLF | Financial Select Sector SPDR Fund | 8 | 16 | 2.94 |
| XPH | SPDR S&P Pharmaceuticals ETF | 8 | 9 | 3.30 |
| XLP | Consumer Staples Select Sector SPDR Fund | 6 | 3 | 2.85 |
| RWR | SPDR Dow Jones REIT ETF | 4 | 5 | 2.63 |
| RWO | SPDR DJ Wilshire Global Real Estate | 4 | 4 | 2.68 |
| GLD | SPDR Gold Trust | 4 | 0 | 2.87 |
| XLU | Utilities Select Sector SPDR Fund | 3 | 2 | 2.55 |
| XLE | Energy Select Sector SPDR Fund | 0 | 26 | 2.38 |
| Ticker | Name | Buys | Xs | Tech Attribute/ Score |
|---|---|---|---|---|
| CWB | SPDR Bloomberg Barclays Convertible Bond ETF | 20 | 20 | 4.84 |
| IBND | SPDR Bloomberg Barclays International Corporate Bond ETF | 18 | 19 | 3.81 |
| SPLB | SPDR Portfolio Long Term Corporate Bond ETF | 16 | 16 | 3.22 |
| JNK | SPDR Bloomberg Barclays High Yield Bond ETF | 16 | 14 | 2.68 |
| PSK | SPDR Wells Fargo Preferred Stock ETF | 16 | 11 | 2.46 |
| EBND | SPDR Bloomberg Barclays Emerging Markets Local Bond ETF | 15 | 14 | 2.92 |
| WIP | SPDR FTSE International Government Inflation-Protected Bond ETF | 14 | 18 | 3.33 |
| SRLN | SPDR Blackstone GSO Senior Loan ETF | 11 | 13 | 2.72 |
| SPTI | SPDR Portfolio Intermediate Term Treasury | 11 | 2 | 2.67 |
| BWX | SPDR Bloomberg Barclays International Treasury Bond ETF | 9 | 15 | 3.52 |
| SPIP | SPDR Portfolio TIPS ETF | 9 | 9 | 2.72 |
| TFI | SPDR Nuveen Bloomberg Barclays Municipal Bond ETF | 9 | 8 | 2.90 |
| SPAB | SPDR Portfolio Aggregate Bond ETF | 9 | 4 | 2.51 |
| SPIB | SPDR Portfolio Intermediate Term Corporate Bond ETF | 8 | 9 | 2.84 |
| SPMB | SPDR Portfolio Mortgage Backed Bond ETF | 8 | 3 | 1.68 |
| FLRN | SPDR Bloomberg Barclays Investment Grade Floating Rate ETF | 6 | 7 | 1.48 |
| SHM | SPDR Nuveen Bloomberg Barclays Short Term Municipal Bond ETF | 6 | 6 | 2.46 |
| BWZ | SPDR Bloomberg Barclays Short Term International Treasury Bond ETF | 5 | 14 | 3.33 |
| SPSB | SPDR Portfolio Short Term Corporate Bond ETF | 4 | 5 | 2.40 |
| BIL | SPDR Bloomberg Barclays 1-3 Month T-Bill ETF | 2 | 1 | 0.37 |
| SPTL | SPDR Portfolio Long Term Treasury ETF | 2 | 0 | 2.10 |
The State Street ETF Model Portfolios are designed to identify major leadership themes within a market, doing so through the use of Point and Figure relative strength tools. Each of the State Street Models are evaluated weekly and guided by a rules-based investment methodology. The construction of the State Street Sector ETF Portfolio is done through an analysis of the each State Street Sector ETF relative strength chart versus the S&P 500, while the Global Sector Rotation model employs a relative strength matrix ranking of the model's inventory. In either case, those with strong relative strength make the cut and are eligible to be included in the portfolio, while those that aren't, will sit upon the sideline. For more information on the portfolio construction and back testing please see the information files on the Models Page. To enter a portfolio amount and see shares to be purchased as well as modify the portfolio to your specifications, click here. (Note: All State Street ETF Models are updated Wednesday mornings by 9:30 am EST)
| ETF Name | Symbol | DWA Suggested Weighting | Yield | Date Added |
|---|---|---|---|---|
| SPDR NYSE Technology ETF | XNTK | 5.263% | 0.3435 | 03/11/2009 |
| SPDR S&P Bank ETF | KBE | 5.263% | 2.7317 | 11/10/2020 |
| SPDR S&P Regional Banking ETF | KRE | 5.263% | 2.9670 | 11/10/2020 |
| Energy Select Sector SPDR Fund | XLE | 5.263% | 10.8627 | 11/24/2020 |
| Technology Select Sector SPDR Fund | XLK | 5.263% | 0.9667 | 02/25/2009 |
| Health Care Select Sector SPDR Fund | XLV | 5.263% | 2.1079 | 01/28/2014 |
| Consumer Discretionary Select Sector SPDR Fund | XLY | 5.263% | 0.9127 | 02/24/2010 |
| SPDR S&P Semiconductor ETF | XSD | 5.263% | 0.3137 | 02/25/2014 |
| SPDR S&P Biotech ETF | XBI | 5.263% | 0.0801 | 04/21/2020 |
| SPDR S&P Homebuilders ETF | XHB | 5.263% | 0.7073 | 05/12/2020 |
| SPDR S&P Metals & Mining ETF | XME | 5.263% | 1.2726 | 11/17/2020 |
| SPDR S&P Oil & Gas Equipment & Services ETF | XES | 5.263% | 2.5777 | 11/17/2020 |
| SPDR S&P Oil & Gas Exploration & Production ETF | XOP | 5.263% | 2.7177 | 11/24/2020 |
| SPDR S&P Retail ETF | XRT | 5.263% | 1.0164 | 06/02/2020 |
| SPDR S&P Pharmaceuticals ETF | XPH | 5.263% | 0.5473 | 05/12/2020 |
| SPDR S&P Health Care Equipment ETF | XHE | 5.263% | 0.0030 | 09/20/2016 |
| SPDR S&P Aerospace & Defense ETF | XAR | 5.263% | 0.6942 | 12/08/2020 |
| SPDR S&P Software & Services ETF | XSW | 5.263% | 0.2804 | 10/25/2011 |
| Communication Services Select Sector SPDR Fund | XLC | 5.263% | 0.7124 | 10/02/2018 |
* - Model Inception:1/17/2007
| ETF Name | Symbol | DWA Suggested Weighting | Yield | Date Added |
|---|---|---|---|---|
| SPDR S&P China ETF | GXC | 33.333% | 1.0920 | 07/18/2017 |
| SPDR S&P 500 ETF Trust | SPY | 33.333% | 1.5350 | 09/27/2011 |
| SPDR MSCI EAFE StrategicFactors ETF | QEFA | 33.333% | 2.3599 | 06/28/2016 |
* - Model Inception:10/28/2008
State Street Targeted Sector Rotation Model SSTARGETSECTOR
ETF Name
Symbol
DWA Suggested Weighting
Yield
Date Added
SPDR NYSE Technology ETF
XNTK
20.000%
0.3435
10/25/2016
SPDR S&P Regional Banking ETF
KRE
20.000%
2.9670
12/01/2020
SPDR S&P Semiconductor ETF
XSD
20.000%
0.3137
09/15/2020
SPDR S&P Homebuilders ETF
XHB
20.000%
0.7073
07/07/2020
SPDR S&P Software & Services ETF
XSW
20.000%
0.2804
07/31/2018
* - Model Inception: 07/28/2010
State Street Fixed Income Model SSFIXED
ETF Name
Symbol
DWA Suggested Weighting
Yield
Date Added
SPDR Bloomberg Barclays Convertible Bond ETF
CWB
25.000%
2.1525
05/19/2020
SPDR Portfolio Long Term Corporate Bond ETF
SPLB
25.000%
3.0999
04/14/2020
SPDR Wells Fargo Preferred Stock ETF
PSK
25.000%
5.0970
04/14/2020
SPDR Bloomberg Barclays International Corporate Bond ETF
IBND
25.000%
0.4868
09/01/2020
* - Model Inception: 04/27/2011
State Street (Wed.)
Loading, Please Wait...
