Most Requested Symbols


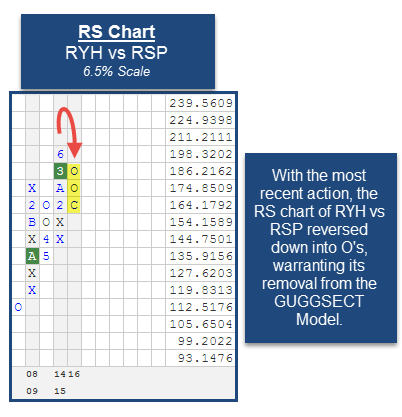
This week, we have a change in the Guggenheim Equal Weight Sector Model GUGGSECT. The Guggenheim S&P Equal Weight Health Care ETF RYH has been removed from the Model. This Model is designed to target exposure to the Guggenheim Equal Weight Sector ETFs that are demonstrating positive Relative Strength versus the Model benchmark, the Guggenheim S&P 500 Equal Weight ETF RSP. Each week we monitor 10 Relative Strength charts for each ETF in the Model's universe versus the RSP. As a result of the most recent market action, RYH reversed into O's versus the RSP, warranting its removal from the Model.
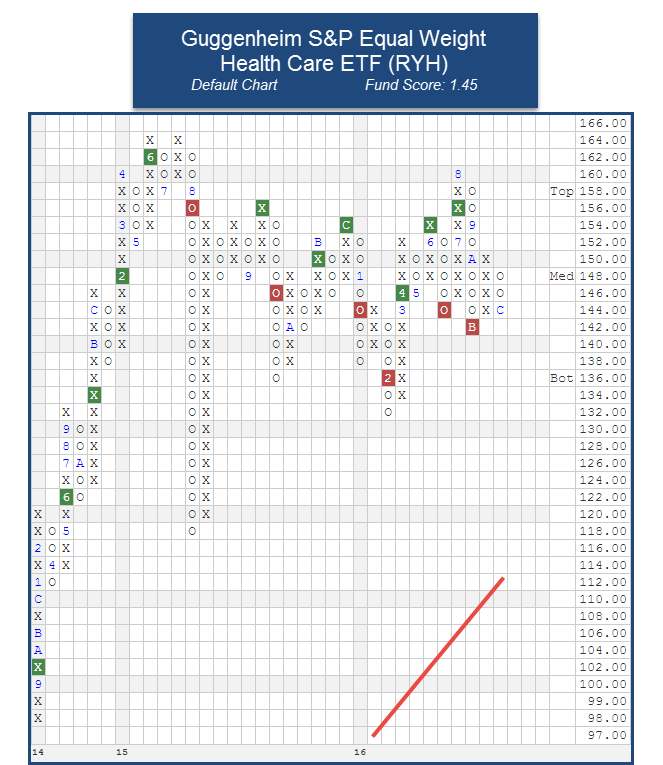
RYH had been a holding in the GUGGSECT Model since 2/19/2014. Over that timeframe, RYH posted a gain of 24.99% while the S&P 500 Index SPX was up 23.42% (through 12/12/2016). Looking at the trend chart of the RYH below, we find that after coming within just 2.5% of its all-time high in August, the chart pulled back significantly, breaking a double bottom at $142 in November. Additionally, it has seen considerable deterioration in its fund score which is now 1.45, down from 5.65 on 2/19/2014. As a result of this change, the GUGGSECT Model has five holdings equally weighted at 20% each. The Model maintains exposure to the following sectors: Consumer Discretionary, Energy, Technology, Utilities, and Real Estate.
The performance numbers above a price return is not inclusive of dividends or all transaction costs. Past performance is not indicative of future results. Potential for profits is accompanied by possibility of loss.

The distribution curve places each ETF on a bell curve according to their respective degrees of overbought or oversold status using a 10-week distribution. ETFs that are statistically oversold will appear on the left-hand side of the bell curve, while those that have become statistically overbought will appear on the right-hand side of the bell curve. Perhaps the most useful attribute of this feature is that it displays the entire universe on the curve at one time to give us a general picture of whether the Guggenheim ETF universe is generally overbought on a near-term basis, or generally oversold. Our best opportunities are to buy strong relative strength ETFs that have regressed back toward mean conditions based on market weakness, or have become oversold based upon extreme market weakness. Weekly Distribution is a short-term gauge that is most helpful in timing entry and exit points, while the longer-term information of trend and relative strength is a more controlling factor in the decision of whether to buy or sell.
The average Bullish Percent reading this week is 60.3% up 3.25% from the previous week
-100--80
-80--60
-60--40
-40--20
-20-0
0-20
20-40
40-60
60-80
80-100
100->

Legend:
This section of the report categorizes all of the Guggenheim ETFs by their respective broad group. Along with each group, you can view the Average Group Score, which is an average of the scores of all funds represented in that particular group. Those Guggenheim ETFs that meet or exceed the Average Group Score will be highlighted in green in order to easily view those Guggenheim ETFs that have superior strength within their respective group. You want to focus on those ETFs that exhibit superior strength when looking to add new exposure to a particular group.
| Small Cap Funds | Symbol | Name | Score |
|---|---|---|---|
| Average Group Score: 4.2 | EWSC | Guggenheim S&P SmallCap 600 Equal Weight ETF | 5.76 |
| RYJ | Guggenheim Raymond James SB-1 Equity ETF | 5.70 | |
| RZG | Guggenheim S&P Smallcap 600 Pure Growth ETF | 5.52 | |
| RZV | Guggenheim S&P Smallcap 600 Pure Value ETF | 4.95 | |
| RFV | Guggenheim S&P Midcap 400 Pure Value ETF | 4.87 | |
| EWMC | Guggenheim S&P MidCap 400 Equal Weight ETF | 4.84 | |
| WMCR | Wilshire Micro-Cap ETF | 4.29 |
| High Yield | Symbol | Name | Score |
|---|---|---|---|
| Average Group Score: 3.4 | BSJM | Guggenheim BulletShares 2022 High Yield Corporate Bond ETF | 3.34 |
| BSJL | Guggenheim BulletShares 2021 High Yield Corporate Bond ETF | 3.06 | |
| BSJN | Guggenheim BulletShares 2023 High Yield Corporate Bond ETF | 3.00 | |
| BSJK | Guggenheim BulletShares 2020 High Yield Corporate Bond ETF | 2.19 | |
| BSJJ | Guggenheim BulletShares 2019 High Yield Corporate Bond ET | 2.09 | |
| BSJI | Guggenheim BulletShares 2018 High Yield Corporate Bond ETF | 1.83 | |
| BSJH | Guggenheim BulletShares 2017 High Yield Corporate Bond ETF | 1.31 | |
| BSJG | Guggenheim BulletShares 2016 High Yield Corporate Bond ETF | 0.73 |
| Sector Funds | Symbol | Name | Score |
|---|---|---|---|
| Average Group Score: 3.3 | RYT | Guggenheim S&P Equal Weight Technology ETF | 5.67 |
| RCD | Guggenheim S&P Equal Weight Consumer Discretionary ETF | 5.28 | |
| RYE | Guggenheim S&P Equal Weight Energy ETF | 4.90 | |
| RYF | Guggenheim S&P Equal Weight Financials ETF | 4.80 | |
| RGI | Guggenheim S&P Equal Weight Industrials ETF | 4.73 | |
| RTM | Guggenheim S&P Equal Weight Materials ETF | 4.49 | |
| ENY | Guggenheim Canadian Energy Income ETF | 3.69 | |
| RYU | Guggenheim S&P Equal Weight Utilities ETF | 3.17 | |
| RHS | Guggenheim S&P Equal Weight Consumer Staples ETF | 3.00 | |
| CUT | Guggenheim MSCI Global Timber ETF | 2.83 | |
| WREI | Wilshire US REIT ETF | 2.38 | |
| TAO | Guggenheim China Real Estate ETF | 2.34 | |
| EWRE | Guggenheim S&P 500 Equal Weight Real Estate ETF | 2.20 | |
| CGW | Guggenheim S&P Global Water Index Fund | 1.99 | |
| RYH | Guggenheim S&P Equal Weight Health Care ETF | 1.45 | |
| SEA | Guggenheim Shipping ETF | 0.72 | |
| TAN | Guggenheim Solar ETF | 0.05 |
| Mid Cap Funds | Symbol | Name | Score |
|---|---|---|---|
| Average Group Score: 3.3 | CZA | Guggenheim Mid-Cap Core ETF | 5.38 |
| RPV | Guggenheim S&P 500 Pure Value ETF | 4.95 | |
| CSD | Guggenheim S&P Spin-Off ETF | 4.61 | |
| GHII | Guggenheim S&P High Income Infrastructure ETF | 4.40 | |
| CVY | Guggenheim Multi-Asset Income ETF | 3.37 | |
| NFO | Guggenheim Insider Sentiment ETF | 3.09 | |
| RFG | Guggenheim S&P Midcap 400 Pure Growth ETF | 3.04 |
| Corporate Bonds | Symbol | Name | Score |
|---|---|---|---|
| Average Group Score: 3.2 | BSCG | Guggenheim BulletShares 2016 Corporate Bond ETF | 2.91 |
| BSCM | Guggenheim BulletShares 2022 Corporate Bond ETF | 2.32 | |
| BSCJ | Guggenheim BulletShares 2019 Corporate Bond ETF | 2.26 | |
| BSCO | Guggenheim BulletShares 2024 Corporate Bond ETF | 2.18 | |
| BSCH | Guggenheim BulletShares 2017 Corporate Bond ETF | 2.11 | |
| BSCN | Guggenheim BulletShares 2023 Corporate Bond ETF | 2.10 | |
| BSCL | Guggenheim BulletShares 2021 Corporate Bond ETF | 2.06 | |
| BSCK | Guggenheim BulletShares 2020 Corporate Bond ETF | 2.01 | |
| BSCI | Guggenheim BulletShares 2018 Corporate Bond ETF | 1.92 | |
| GTO | Guggenheim Total Return Bond ETF | 1.89 | |
| BSCP | Guggenheim BulletShares 2025 Corporate Bond ETF | 1.54 |
| Large Cap Funds | Symbol | Name | Score |
|---|---|---|---|
| Average Group Score: 3.2 | RSP | Guggenheim S&P 500 Equal Weight ETF | 5.66 |
| DJD | Guggenheim Dow Jones Industrial Average Dividend ETF | 4.54 | |
| RPG | Guggenheim S&P 500 Pure Growth ETF | 3.95 | |
| DEF | Guggenheim Defensive Equity ETF | 3.41 | |
| XLG | Guggenheim S&P 500 Top 50 ETF | 3.36 |
| Global Funds | Symbol | Name | Score |
|---|---|---|---|
| Average Group Score: 2.8 | EEB | Guggenheim BRIC ETF | 3.63 |
| LVL | Guggenheim S&P Global Dividend Opportunities Index ETF | 3.52 | |
| CQQQ | Guggenheim China Technology ETF | 3.31 | |
| EWEM | Guggenheim MSCI Emerging Markets Equal Country Weight ETF | 2.10 | |
| FRN | Guggenheim Frontier Markets ETF | 2.10 | |
| HGI | Guggenheim International Multi-Asset Income ETF | 2.00 | |
| YAO | Guggenheim China All-Cap ETF | 1.30 | |
| HAO | Guggenheim China Small Cap ETF | 1.03 |
| Broad Fixed Income | Symbol | Name | Score |
|---|---|---|---|
| Average Group Score: 2.4 | GCE | Claymore CEF GS Connect ETN | 1.46 |
| GSY | Guggenheim Enhanced Short Duration ETF | 1.33 |

The DWA Matrix uses a Point & Figure relative strength comparison of each index to one another to identify the strongest and the weakest among the universe used. The ETFs with the most relative strength buy signals (suggesting outperformance) versus the others in the group are listed at the top. These ETFs should be overweighted in the portfolio. Those ETFs with the least amount of relative strength buy signals versus the others in the group are listed at the bottom. These ETFs should be underweighted in the portfolio. The DWA Matrix uses a Point & Figure relative strength comparison of each index to one another to identify the strongest and the weakest among the universe used. The ETFs with the most relative strength buy signals (suggesting outperformance) versus the others in the group are listed at the top. These ETFs should be overweighted in the portfolio. Those ETFs with the least amount of relative strength buy signals versus the others in the group are listed at the bottom. These ETFs should be underweighted in the portfolio.
| Ticker | Name | Buys | Xs | Tech Attribute/ Score |
|---|---|---|---|---|
| RGI | Guggenheim S&P Equal Weight Industrials ETF | 13 | 12 | 4.73 |
| RYF | Guggenheim S&P Equal Weight Financials ETF | 12 | 14 | 4.80 |
| RYT | Guggenheim S&P Equal Weight Technology ETF | 12 | 12 | 5.67 |
| RYE | Guggenheim S&P Equal Weight Energy ETF | 11 | 14 | 4.90 |
| CQQQ | Guggenheim China Technology ETF | 11 | 3 | 3.31 |
| ENY | Guggenheim Canadian Energy Income ETF | 9 | 9 | 3.69 |
| RCD | Guggenheim S&P Equal Weight Consumer Discretionary ETF | 9 | 9 | 5.28 |
| RTM | Guggenheim S&P Equal Weight Materials ETF | 8 | 11 | 4.49 |
| CGW | Guggenheim S&P Global Water Index Fund | 8 | 6 | 1.99 |
| TAO | Guggenheim China Real Estate ETF | 7 | 3 | 2.34 |
| RHS | Guggenheim S&P Equal Weight Consumer Staples ETF | 5 | 2 | 3.00 |
| CUT | Guggenheim MSCI Global Timber ETF | 4 | 10 | 2.83 |
| RYH | Guggenheim S&P Equal Weight Health Care ETF | 4 | 4 | 1.45 |
| WREI | Wilshire US REIT ETF | 3 | 5 | 2.38 |
| RYU | Guggenheim S&P Equal Weight Utilities ETF | 3 | 4 | 3.17 |
| TAN | Guggenheim Solar ETF | 0 | 0 | 0.05 |
| Ticker | Name | Buys | Xs | Tech Attribute/ Score |
|---|---|---|---|---|
| RPV | Guggenheim S&P 500 Pure Value ETF | 21 | 17 | 4.95 |
| RPG | Guggenheim S&P 500 Pure Growth ETF | 21 | 4 | 3.95 |
| RZV | Guggenheim S&P Smallcap 600 Pure Value ETF | 20 | 23 | 4.95 |
| CZA | Guggenheim Mid-Cap Core ETF | 18 | 17 | 5.38 |
| CSD | Guggenheim S&P Spin-Off ETF | 18 | 12 | 4.61 |
| EWMC | Guggenheim S&P MidCap 400 Equal Weight ETF | 17 | 18 | 4.84 |
| RSP | Guggenheim S&P 500 Equal Weight ETF | 17 | 18 | 5.66 |
| RFV | Guggenheim S&P Midcap 400 Pure Value ETF | 16 | 24 | 4.87 |
| RZG | Guggenheim S&P Smallcap 600 Pure Growth ETF | 16 | 21 | 5.52 |
| RYJ | Guggenheim Raymond James SB-1 Equity ETF | 16 | 18 | 5.70 |
| XLG | Guggenheim S&P 500 Top 50 ETF | 15 | 10 | 3.36 |
| DEF | Guggenheim Defensive Equity ETF | 14 | 11 | 3.41 |
| NFO | Guggenheim Insider Sentiment ETF | 13 | 8 | 3.09 |
| EWSC | Guggenheim S&P SmallCap 600 Equal Weight ETF | 12 | 18 | 5.76 |
| EEB | Guggenheim BRIC ETF | 12 | 11 | 3.63 |
| WMCR | Wilshire Micro-Cap ETF | 11 | 19 | 4.29 |
| RFG | Guggenheim S&P Midcap 400 Pure Growth ETF | 9 | 6 | 3.04 |
| EWEM | Guggenheim MSCI Emerging Markets Equal Country Weight ETF | 8 | 5 | 2.10 |
| GSY | Guggenheim Enhanced Short Duration ETF | 7 | 0 | 1.33 |
| LVL | Guggenheim S&P Global Dividend Opportunities Index ETF | 5 | 10 | 3.52 |
| YAO | Guggenheim China All-Cap ETF | 4 | 7 | 1.30 |
| CVY | Guggenheim Multi-Asset Income ETF | 3 | 6 | 3.37 |
| HGI | Guggenheim International Multi-Asset Income ETF | 3 | 4 | 2.00 |
| HAO | Guggenheim China Small Cap ETF | 3 | 4 | 1.03 |
| FRN | Guggenheim Frontier Markets ETF | 2 | 7 | 2.10 |
Weekly Update:
RYH has been removed from the GUGGSECT Model.
| ETF Name | Symbol | DWA Suggested Weighting | Date Added |
|---|---|---|---|
| Guggenheim S&P Spin-Off ETF | CSD | 20.000% | 09/26/2011 |
| Guggenheim China Technology ETF | CQQQ | 20.000% | 02/08/2016 |
| Guggenheim S&P MidCap 400 Equal Weight ETF | EWMC | 20.000% | 12/09/2013 |
| Guggenheim Insider Sentiment ETF | NFO | 20.000% | 09/09/2008 |
| Guggenheim S&P 500 Top 50 ETF | XLG | 20.000% | 08/15/2016 |
* - Dates prior to 10/14/08, which is when the Guggenheim Special Opportunities Model ETF Portfolio became available in the Guggenheim Weekly ETF Report, are representative of when the position was added to the backtested model.
| ETF Name | Symbol | DWA Suggested Weighting | Date Added |
|---|---|---|---|
| Guggenheim S&P Equal Weight Consumer Discretionary ETF | RCD | 20.000% | 04/22/2009 |
| Guggenheim S&P Equal Weight Energy ETF | RYE | 20.000% | 04/25/2016 |
| Guggenheim S&P Equal Weight Technology ETF | RYT | 20.000% | 11/23/2015 |
| Guggenheim S&P Equal Weight Utilities ETF | RYU | 20.000% | 02/08/2016 |
| Guggenheim S&P 500 Equal Weight Real Estate ETF | EWRE | 20.000% | 08/31/2015 |
* - Dates prior to 7/8/2014, which is when the Guggenheim Equal Weight Sector Model became available in the Guggenheim Weekly ETF Report, are representative of when the position was added to the backtested model.
Guggenheim Funds (Tues.)
Loading, Please Wait...
