Most Requested Symbols


There are no changes to be made within either of the Dorsey Wright Invesco Models this week, as each of the current holdings continues to maintain positive relative strength within the respective universes.
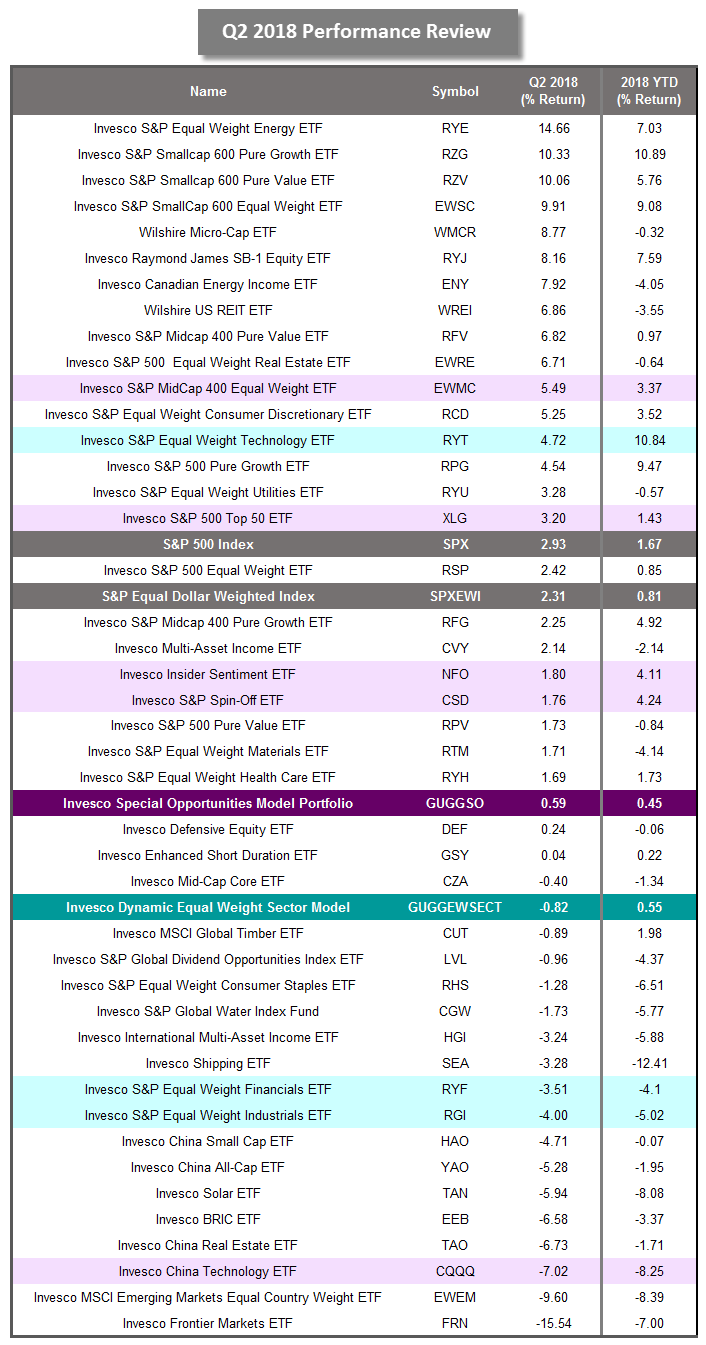
The second quarter of 2018 has come to an end and as is customary, we wanted to review how the Invesco line-up of funds performed, as well as recap how the Invesco Special Opportunities Model GUGGSO and the Invesco Dynamic Equal Weight Sector Model GUGGEWSECT fared over the second quarter of the year. In the image below, we have provided a snapshot of the Q2 2018 performance for the Invesco ETF lineup (excluding the BulletShares products). We have highlighted the Invesco Dynamic Equal Weight Sector Model GUGGEWSECT and its current holdings in teal, the Invesco Special Opportunities Model GUGGSO and its current holdings in purple, and the S&P 500 Index SPX benchmarks in gray.
Although there were a lot of negative headlines paired with market choppiness over the past three months, the second quarter proved to be an overall strong one for US equities. When all was said and done, the S&P 500 Index SPX posted a gain of 2.93% while the S&P Equal Dollar Weighted Index SPXEWI finished up 2.31%. The Invesco Special Opportunities Model GUGGSO finished the quarter flat with a gain of 0.59%. This model did not see any changes over the second quarter as each of the model holdings continued to maintain positive relative strength. The biggest contributor over the second quarter was the Invesco S&P MidCap 400 Equal Weight EWMC which posted a gain of 5.49%. The Invesco China Technology CQQQ lagged the portfolio over Q2, posting a loss of -7.02%.
The Invesco Dynamic Equal Weight Sector Model GUGGEWSECT was down slightly with a loss of -0.82%. This model did not see any changes over the second quarter as each of the model holdings continued to maintain positive relative strength. The best performing of the current holdings for Q2 was once again the Invesco S&P Equal Weight Technology ETF RYT which was up 4.72%. The Invesco S&P Equal Weight Industrials ETF RGI dragged the portfolio, posting a loss of -4.00% over Q2.

The distribution curve places each ETF on a bell curve according to their respective degrees of overbought or oversold status using a 10-week distribution. ETFs that are statistically oversold will appear on the left-hand side of the bell curve, while those that have become statistically overbought will appear on the right-hand side of the bell curve. Perhaps the most useful attribute of this feature is that it displays the entire universe on the curve at one time to give us a general picture of whether the Invesco ETF universe is generally overbought on a near-term basis, or generally oversold. Our best opportunities are to buy strong relative strength ETFs that have regressed back toward mean conditions based on market weakness, or have become oversold based upon extreme market weakness. Weekly Distribution is a short-term gauge that is most helpful in timing entry and exit points, while the longer-term information of trend and relative strength is a more controlling factor in the decision of whether to buy or sell.
The average Bullish Percent reading this week is 48.35% down 2.58% from the previous week
-100--80
-80--60
-60--40
-40--20
-20-0
0-20
20-40
40-60
60-80
80-100
100->

Legend:
This section of the report categorizes all of the Invesco ETFs by their respective broad group. Along with each group, you can view the Average Group Score, which is an average of the scores of all funds represented in that particular group. Those Invesco ETFs that meet or exceed the Average Group Score will be highlighted in green in order to easily view those Invesco ETFs that have superior strength within their respective group. You want to focus on those ETFs that exhibit superior strength when looking to add new exposure to a particular group.
| Small Cap Funds | Symbol | Name | Score |
|---|---|---|---|
| Average Group Score: 4.4 | EWSC | Invesco S&P SmallCap 600 Equal Weight ETF | 5.76 |
| RZG | Invesco S&P Smallcap 600 Pure Growth ETF | 5.75 | |
| RZV | InvescoS&P Smallcap 600 Pure Value ETF | 4.70 | |
| WMCR | Invesco Wilshire Micro-Cap ETF | 4.59 | |
| EWMC | Invesco S&P MidCap 400 Equal Weight ETF | 4.40 | |
| RFV | Invesco S&P Midcap 400 Pure Value ETF | 3.45 |
| Sector Funds | Symbol | Name | Score |
|---|---|---|---|
| Average Group Score: 3.3 | RYE | Invesco S&P Equal Weight Energy ETF | 5.62 |
| RYT | Invesco S&P Equal Weight Technology ETF | 5.55 | |
| RCD | Invesco S&P Equal Weight Consumer Discretionary ETF | 4.41 | |
| RYF | Invesco S&P Equal Weight Financials ETF | 4.23 | |
| TAO | Invesco China Real Estate ETF | 3.75 | |
| CUT | Invesco MSCI Global Timber ETF | 3.68 | |
| RYH | Invesco S&P Equal Weight Health Care ETF | 3.56 | |
| RGI | Invesco S&P Equal Weight Industrials ETF | 3.46 | |
| RTM | Invesco S&P Equal Weight Materials ETF | 3.35 | |
| TAN | Invesco Solar ETF | 2.64 | |
| RYU | Invesco S&P Equal Weight Utilities ETF | 2.63 | |
| EWRE | Invesco S&P 500 Equal Weight Real Estate ETF | 2.60 | |
| WREI | Wilshire US REIT ETF | 2.23 | |
| CGW | Invesco S&P Global Water Index Fund | 2.00 | |
| RHS | Invesco S&P Equal Weight Consumer Staples ETF | 1.92 | |
| ENY | Invesco Canadian Energy Income ETF | 1.78 | |
| SEA | Invesco Shipping ETF | 0.17 |
| Mid Cap Funds | Symbol | Name | Score |
|---|---|---|---|
| Average Group Score: 3.3 | RYJ | Invesco Raymond James SB-1 Equity ETF | 5.69 |
| CSD | Invesco S&P Spin-Off ETF | 5.13 | |
| CZA | Invesco Zacks Mid-Cap Core ETF | 4.44 | |
| RFG | Invesco S&P Midcap 400 Pure Growth ETF | 4.23 | |
| NFO | Invesco Insider Sentiment ETF | 4.09 | |
| CVY | Invesco Zacks Multi-Asset Income ETF | 2.61 | |
| GHII | Invesco S&P High Income Infrastructure ETF | 2.13 |
| Large Cap Funds | Symbol | Name | Score |
|---|---|---|---|
| Average Group Score: 3.3 | RPG | Invesco S&P 500 Pure Growth ETF | 5.63 |
| RSP | Invesco S&P 500 Equal Weight ETF | 4.96 | |
| DJD | Invesco Dow Jones Industrial Average Dividend ETF | 4.52 | |
| RPV | Invesco S&P 500 Pure Value ETF | 3.55 | |
| XLG | Invesco S&P 500 Top 50 ETF | 3.38 | |
| DEF | Invesco Defensive Equity ETF | 2.69 |
| Global Funds | Symbol | Name | Score |
|---|---|---|---|
| Average Group Score: 2.9 | HAO | Invesco China Small Cap ETF | 3.69 |
| YAO | Invesco China All-Cap ETF | 3.45 | |
| EEB | Invesco BRIC ETF | 3.32 | |
| CQQQ | Invesco China Technology ETF | 3.06 | |
| EWEM | Invesco MSCI Emerging Markets Equal Country Weight ETF | 2.54 | |
| HGI | Invesco Zacks International Multi-Asset Income ETF | 1.63 | |
| LVL | Invesco S&P Global Dividend Opportunities Index ETF | 1.57 | |
| FRN | Invesco Frontier Markets ETF | 1.34 |
| Broad Fixed Income | Symbol | Name | Score |
|---|---|---|---|
| Average Group Score: 2.4 | GSY | Invesco Enhanced Short Duration ETF | 2.78 |
| GCE | Claymore CEF GS Connect ETN | 0.94 |

The DWA Matrix uses a Point & Figure relative strength comparison of each index to one another to identify the strongest and the weakest among the universe used. The ETFs with the most relative strength buy signals (suggesting outperformance) versus the others in the group are listed at the top. These ETFs should be overweighted in the portfolio. Those ETFs with the least amount of relative strength buy signals versus the others in the group are listed at the bottom. These ETFs should be underweighted in the portfolio. The DWA Matrix uses a Point & Figure relative strength comparison of each index to one another to identify the strongest and the weakest among the universe used. The ETFs with the most relative strength buy signals (suggesting outperformance) versus the others in the group are listed at the top. These ETFs should be overweighted in the portfolio. Those ETFs with the least amount of relative strength buy signals versus the others in the group are listed at the bottom. These ETFs should be underweighted in the portfolio.
| Ticker | Name | Buys | Xs | Tech Attribute/ Score |
|---|---|---|---|---|
| RYT | Invesco S&P Equal Weight Technology ETF | 14 | 14 | 5.55 |
| RTM | Invesco S&P Equal Weight Materials ETF | 12 | 7 | 3.35 |
| TAO | Invesco China Real Estate ETF | 12 | 4 | 3.75 |
| RYE | Invesco S&P Equal Weight Energy ETF | 10 | 12 | 5.62 |
| RGI | Invesco S&P Equal Weight Industrials ETF | 10 | 4 | 3.46 |
| RYF | Invesco S&P Equal Weight Financials ETF | 9 | 7 | 4.23 |
| RCD | Invesco S&P Equal Weight Consumer Discretionary ETF | 8 | 14 | 4.41 |
| CUT | Invesco MSCI Global Timber ETF | 8 | 8 | 3.68 |
| CQQQ | Invesco China Technology ETF | 8 | 0 | 3.06 |
| RYH | Invesco S&P Equal Weight Health Care ETF | 6 | 7 | 3.56 |
| RHS | Invesco S&P Equal Weight Consumer Staples ETF | 6 | 6 | 1.92 |
| CGW | Invesco S&P Global Water Index Fund | 6 | 4 | 2.00 |
| RYU | Invesco S&P Equal Weight Utilities ETF | 3 | 10 | 2.63 |
| TAN | Invesco Solar ETF | 3 | 2 | 2.64 |
| WREI | Wilshire US REIT ETF | 2 | 11 | 2.23 |
| ENY | Invesco Canadian Energy Income ETF | 2 | 9 | 1.78 |
| Ticker | Name | Buys | Xs | Tech Attribute/ Score |
|---|---|---|---|---|
| RZG | Invesco S&P Smallcap 600 Pure Growth ETF | 21 | 23 | 5.75 |
| RPG | Invesco S&P 500 Pure Growth ETF | 21 | 22 | 5.63 |
| YAO | Invesco China All-Cap ETF | 21 | 7 | 3.45 |
| CSD | Invesco S&P Spin-Off ETF | 18 | 18 | 5.13 |
| RFV | Invesco S&P Midcap 400 Pure Value ETF | 17 | 11 | 3.45 |
| EEB | Invesco BRIC ETF | 17 | 5 | 3.32 |
| CZA | Invesco Zacks Mid-Cap Core ETF | 16 | 14 | 4.44 |
| RPV | Invesco S&P 500 Pure Value ETF | 16 | 10 | 3.55 |
| WMCR | Invesco Wilshire Micro-Cap ETF | 15 | 20 | 4.59 |
| EWMC | Invesco S&P MidCap 400 Equal Weight ETF | 15 | 12 | 4.40 |
| RYJ | Invesco Raymond James SB-1 Equity ETF | 14 | 20 | 5.69 |
| RZV | InvescoS&P Smallcap 600 Pure Value ETF | 14 | 18 | 4.70 |
| NFO | Invesco Insider Sentiment ETF | 13 | 18 | 4.09 |
| RSP | Invesco S&P 500 Equal Weight ETF | 13 | 15 | 4.96 |
| HAO | Invesco China Small Cap ETF | 12 | 5 | 3.69 |
| EWSC | Invesco S&P SmallCap 600 Equal Weight ETF | 11 | 21 | 5.76 |
| XLG | Invesco S&P 500 Top 50 ETF | 11 | 15 | 3.38 |
| DEF | Invesco Defensive Equity ETF | 11 | 9 | 2.69 |
| RFG | Invesco S&P Midcap 400 Pure Growth ETF | 9 | 15 | 4.23 |
| GSY | Invesco Enhanced Short Duration ETF | 3 | 6 | 2.78 |
| HGI | Invesco Zacks International Multi-Asset Income ETF | 3 | 4 | 1.63 |
| FRN | Invesco Frontier Markets ETF | 3 | 1 | 1.34 |
| EWEM | Invesco MSCI Emerging Markets Equal Country Weight ETF | 3 | 0 | 2.54 |
| CVY | Invesco Zacks Multi-Asset Income ETF | 2 | 5 | 2.61 |
| LVL | Invesco S&P Global Dividend Opportunities Index ETF | 2 | 5 | 1.57 |
Weekly Update:
| ETF Name | Symbol | DWA Suggested Weighting | Yield | Date Added |
|---|---|---|---|---|
| Invesco S&P Spin-Off ETF | CSD | 20.000% | 0.5840 | 09/26/2011 |
| Invesco China Technology ETF | CQQQ | 20.000% | 1.5520 | 02/08/2016 |
| Invesco S&P MidCap 400 Equal Weight ETF | EWMC | 20.000% | 1.1910 | 12/09/2013 |
| Invesco Insider Sentiment ETF | NFO | 20.000% | 1.4290 | 09/09/2008 |
| Invesco S&P 500 Top 50 ETF | XLG | 20.000% | 1.7880 | 08/15/2016 |
* - Dates prior to 10/14/08, which is when the Invesco Special Opportunities Model ETF Portfolio became available in the Invesco Weekly ETF Report, are representative of when the position was added to the backtested model.
* - Dates prior to 8/15/2017, which is when the Invesco Dynamic Equal Weight Sector Model became available in the Invesco Weekly ETF Report, are representative of when the position was added to the backtested model.
Guggenheim Funds (Tues.)
Loading, Please Wait...
