Most Requested Symbols


There are no changes to any of the Invesco models this week. The Fed’s increase of the federal funds rate earlier this month was consistent with the telegraphed message on shorter-term rates. What about the longer end of the curve? Can we expect the dynamics that drive the Fed’s short-term rate decisions to effect durations that drive returns in long-term client portfolios? One of the most famous models that drives short-term fed rate decisions is the Taylor Rule Model. This model shows how short-term rates should respond to changes in inflation and GDP. Below we show a chart of the difference between the Fed Funds Rate and the Taylor Rule Model output, side-by-side with the forward 2 year change in the 10 year Treasury Yield. As you can clearly see, as the actual fed funds rate trades markedly above the Taylor Rule Model output, we subsequently see intermediate-term treasury yields decrease. Inversely, and the current situation we find ourselves in, as the fed funds rate trades markedly below the Taylor Rule Model output, we subsequently see intermediate-term treasury yields increase. Specifically, this model currently calls for a 100bps rise in the 10-year yield over the next two years, consistent with our broad view of rising intermediate-term rates over the next few years.
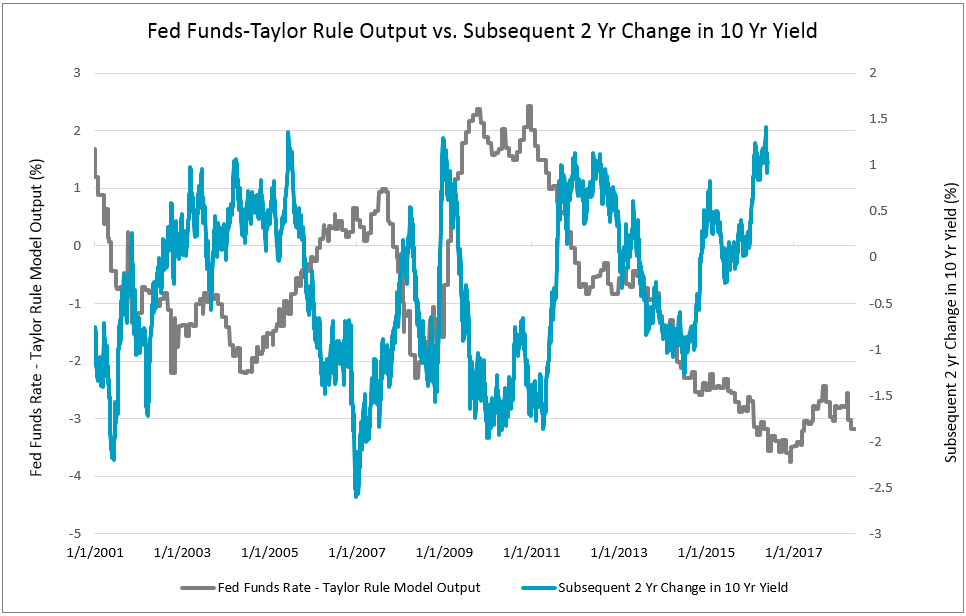
If future changes in 10-year US Treasury yields are in-line with the model predictions, then over the next two years, we would expect to see fixed income securities with low and/or positive correlations to intermediate-term yields outperform more rate sensitive (and negatively correlated) instruments, e.g. Treasuries and investment grade corporates. The model output suggests an environment in which investors are likely to be rewarded for reducing interest rate risk (i.e. duration) and potentially for increasing credit risk, as rising intermediate- and long-term Treasury yields are usually a byproduct of an expansionary domestic economy.
One method by which you can protect your clients’ fixed income portfolios is by utilizing target maturity ETFs, like the suite of Invesco BulletShares products,. The BulletShares products offer a simple to solution for constructing a portfolio which can be held-to-maturity and therefore minimize interest rate risk. Unlike traditional fixed income ETFs, target maturity ETFs hold individual bonds that each mature or are expected to be called in the same year. As the underlying bonds mature, the cash or cash equivalent holdings of the fund increases and upon the fund reaching maturity the proceeds are distributed to shareholders. Because these funds have a target maturity, they can be used to create a held-to-maturity portfolio to protect against capital losses due to rising interest rates.
BulletShares ETFs can also be used to create laddered portfolios. A laddered portfolio is one with allocations spread across several different maturities, e.g. 20% each to 1 to 5 year maturity bonds. A laddered portfolio provides liquidity and can help minimize interest rate risk. Invesco currently offers 10 investment grade corporate BulletShares ETFs with target maturities ranging from 2018 to 2027 and eight high yield corporate BulletShares ETFs with target maturities ranging from 2018 to 2025. According to the bond ladder tool at Invesco.com, a five-year, equally-weighted portfolio constructed of investment grade and high yield BulletShares ETFs with target maturities from 2019 to 2023 currently has a 4.5% yield-to-maturity and 2,482 individual underlying bond holdings.
Even though the underlying bonds in the BulletShares ETFs are expected to be held until maturity, they are exchange traded and therefore the market value and NAV of the fund will still be affected by interest rate movement. Therefore it is important to understand that ultimately, as the bonds near maturity, the NAV of the fund should move toward the par value of its holdings and the fund will receive par value for its bonds (excepting any potential defaults), which will in turn be distributed to the funds’ investors. All of the current BulletShares offerings can be seen below.


The distribution curve places each ETF on a bell curve according to their respective degrees of overbought or oversold status using a 10-week distribution. ETFs that are statistically oversold will appear on the left-hand side of the bell curve, while those that have become statistically overbought will appear on the right-hand side of the bell curve. Perhaps the most useful attribute of this feature is that it displays the entire universe on the curve at one time to give us a general picture of whether the Invesco ETF universe is generally overbought on a near-term basis, or generally oversold. Our best opportunities are to buy strong relative strength ETFs that have regressed back toward mean conditions based on market weakness, or have become oversold based upon extreme market weakness. Weekly Distribution is a short-term gauge that is most helpful in timing entry and exit points, while the longer-term information of trend and relative strength is a more controlling factor in the decision of whether to buy or sell.
The average Bullish Percent reading this week is 50.92% down 2.62% from the previous week
| <--100 | -100--80 | -80--60 | -60--40 | -40--20 | -20-0 | 0-20 | 20-40 | 40-60 | 60-80 | 80-100 | 100-> | |||
 |
||||||||||||||
Legend:
This section of the report categorizes all of the Invesco ETFs by their respective broad group. Along with each group, you can view the Average Group Score, which is an average of the scores of all funds represented in that particular group. Those Invesco ETFs that meet or exceed the Average Group Score will be highlighted in green in order to easily view those Invesco ETFs that have superior strength within their respective group. You want to focus on those ETFs that exhibit superior strength when looking to add new exposure to a particular group.
| Small Cap Funds | Symbol | Name | Score |
|---|---|---|---|
| Average Group Score: 4.4 | EWSC | Invesco S&P SmallCap 600 Equal Weight ETF | 5.78 |
| RZG | Invesco S&P Smallcap 600 Pure Growth ETF | 5.60 | |
| RZV | InvescoS&P Smallcap 600 Pure Value ETF | 4.85 | |
| WMCR | Invesco Wilshire Micro-Cap ETF | 4.47 | |
| EWMC | Invesco S&P MidCap 400 Equal Weight ETF | 4.44 | |
| RFV | Invesco S&P Midcap 400 Pure Value ETF | 3.60 |
| Mid Cap Funds | Symbol | Name | Score |
|---|---|---|---|
| Average Group Score: 3.4 | RYJ | Invesco Raymond James SB-1 Equity ETF | 5.72 |
| CSD | Invesco S&P Spin-Off ETF | 5.18 | |
| CZA | Invesco Zacks Mid-Cap Core ETF | 4.48 | |
| RFG | Invesco S&P Midcap 400 Pure Growth ETF | 4.25 | |
| NFO | Invesco Insider Sentiment ETF | 4.05 | |
| CVY | Invesco Zacks Multi-Asset Income ETF | 3.23 | |
| GHII | Invesco S&P High Income Infrastructure ETF | 2.16 |
| Sector Funds | Symbol | Name | Score |
|---|---|---|---|
| Average Group Score: 3.3 | RYE | Invesco S&P Equal Weight Energy ETF | 5.63 |
| RYT | Invesco S&P Equal Weight Technology ETF | 5.52 | |
| TAO | Invesco China Real Estate ETF | 4.72 | |
| RYF | Invesco S&P Equal Weight Financials ETF | 4.66 | |
| RCD | Invesco S&P Equal Weight Consumer Discretionary ETF | 4.49 | |
| CUT | Invesco MSCI Global Timber ETF | 3.92 | |
| RGI | Invesco S&P Equal Weight Industrials ETF | 3.91 | |
| RYH | Invesco S&P Equal Weight Health Care ETF | 3.63 | |
| RTM | Invesco S&P Equal Weight Materials ETF | 3.19 | |
| TAN | Invesco Solar ETF | 2.62 | |
| EWRE | Invesco S&P 500 Equal Weight Real Estate ETF | 2.46 | |
| RHS | Invesco S&P Equal Weight Consumer Staples ETF | 2.05 | |
| RYU | Invesco S&P Equal Weight Utilities ETF | 2.05 | |
| CGW | Invesco S&P Global Water Index Fund | 2.00 | |
| WREI | Wilshire US REIT ETF | 1.95 | |
| ENY | Invesco Canadian Energy Income ETF | 1.63 | |
| SEA | Invesco Shipping ETF | 0.33 |
| Large Cap Funds | Symbol | Name | Score |
|---|---|---|---|
| Average Group Score: 3.3 | RPG | Invesco S&P 500 Pure Growth ETF | 5.59 |
| RSP | Invesco S&P 500 Equal Weight ETF | 5.07 | |
| DJD | Invesco Dow Jones Industrial Average Dividend ETF | 4.36 | |
| RPV | Invesco S&P 500 Pure Value ETF | 4.00 | |
| XLG | Invesco S&P 500 Top 50 ETF | 3.05 | |
| DEF | Invesco Defensive Equity ETF | 2.85 |
| Global Funds | Symbol | Name | Score |
|---|---|---|---|
| Average Group Score: 3.0 | HAO | Invesco China Small Cap ETF | 4.92 |
| YAO | Invesco China All-Cap ETF | 4.62 | |
| EEB | Invesco BRIC ETF | 3.32 | |
| CQQQ | Invesco China Technology ETF | 3.26 | |
| EWEM | Invesco MSCI Emerging Markets Equal Country Weight ETF | 2.55 | |
| HGI | Invesco Zacks International Multi-Asset Income ETF | 2.11 | |
| LVL | Invesco S&P Global Dividend Opportunities Index ETF | 1.84 | |
| FRN | Invesco Frontier Markets ETF | 1.35 |
| Broad Fixed Income | Symbol | Name | Score |
|---|---|---|---|
| Average Group Score: 2.4 | GSY | Invesco Enhanced Short Duration ETF | 2.55 |
| GCE | Claymore CEF GS Connect ETN | 0.97 |

The DWA Matrix uses a Point & Figure relative strength comparison of each index to one another to identify the strongest and the weakest among the universe used. The ETFs with the most relative strength buy signals (suggesting outperformance) versus the others in the group are listed at the top. These ETFs should be overweighted in the portfolio. Those ETFs with the least amount of relative strength buy signals versus the others in the group are listed at the bottom. These ETFs should be underweighted in the portfolio. The DWA Matrix uses a Point & Figure relative strength comparison of each index to one another to identify the strongest and the weakest among the universe used. The ETFs with the most relative strength buy signals (suggesting outperformance) versus the others in the group are listed at the top. These ETFs should be overweighted in the portfolio. Those ETFs with the least amount of relative strength buy signals versus the others in the group are listed at the bottom. These ETFs should be underweighted in the portfolio.
| Ticker | Name | Buys | Xs | Tech Attribute/ Score |
|---|---|---|---|---|
| RYT | Invesco S&P Equal Weight Technology ETF | 14 | 14 | 5.52 |
| TAO | Invesco China Real Estate ETF | 14 | 7 | 4.72 |
| RTM | Invesco S&P Equal Weight Materials ETF | 12 | 6 | 3.19 |
| RGI | Invesco S&P Equal Weight Industrials ETF | 10 | 4 | 3.91 |
| CQQQ | Invesco China Technology ETF | 10 | 2 | 3.26 |
| RYE | Invesco S&P Equal Weight Energy ETF | 9 | 12 | 5.63 |
| RYF | Invesco S&P Equal Weight Financials ETF | 9 | 7 | 4.66 |
| CUT | Invesco MSCI Global Timber ETF | 8 | 8 | 3.92 |
| RCD | Invesco S&P Equal Weight Consumer Discretionary ETF | 7 | 14 | 4.49 |
| RHS | Invesco S&P Equal Weight Consumer Staples ETF | 6 | 6 | 2.05 |
| RYH | Invesco S&P Equal Weight Health Care ETF | 6 | 6 | 3.63 |
| CGW | Invesco S&P Global Water Index Fund | 6 | 5 | 2.00 |
| TAN | Invesco Solar ETF | 3 | 0 | 2.62 |
| RYU | Invesco S&P Equal Weight Utilities ETF | 2 | 9 | 2.05 |
| ENY | Invesco Canadian Energy Income ETF | 2 | 8 | 1.63 |
| WREI | Wilshire US REIT ETF | 1 | 11 | 1.95 |
| Ticker | Name | Buys | Xs | Tech Attribute/ Score |
|---|---|---|---|---|
| YAO | Invesco China All-Cap ETF | 22 | 11 | 4.62 |
| RPG | Invesco S&P 500 Pure Growth ETF | 21 | 23 | 5.59 |
| RZG | Invesco S&P Smallcap 600 Pure Growth ETF | 21 | 23 | 5.60 |
| CSD | Invesco S&P Spin-Off ETF | 18 | 16 | 5.18 |
| EEB | Invesco BRIC ETF | 17 | 6 | 3.32 |
| CZA | Invesco Zacks Mid-Cap Core ETF | 16 | 13 | 4.48 |
| RPV | Invesco S&P 500 Pure Value ETF | 16 | 9 | 4.00 |
| HAO | Invesco China Small Cap ETF | 15 | 15 | 4.92 |
| EWMC | Invesco S&P MidCap 400 Equal Weight ETF | 15 | 11 | 4.44 |
| RFV | Invesco S&P Midcap 400 Pure Value ETF | 15 | 10 | 3.60 |
| RYJ | Invesco Raymond James SB-1 Equity ETF | 14 | 20 | 5.72 |
| WMCR | Invesco Wilshire Micro-Cap ETF | 14 | 20 | 4.47 |
| RZV | InvescoS&P Smallcap 600 Pure Value ETF | 14 | 18 | 4.85 |
| NFO | Invesco Insider Sentiment ETF | 13 | 19 | 4.05 |
| RSP | Invesco S&P 500 Equal Weight ETF | 13 | 13 | 5.07 |
| EWSC | Invesco S&P SmallCap 600 Equal Weight ETF | 11 | 18 | 5.78 |
| XLG | Invesco S&P 500 Top 50 ETF | 11 | 13 | 3.05 |
| DEF | Invesco Defensive Equity ETF | 11 | 7 | 2.85 |
| RFG | Invesco S&P Midcap 400 Pure Growth ETF | 9 | 16 | 4.25 |
| HGI | Invesco Zacks International Multi-Asset Income ETF | 3 | 5 | 2.11 |
| GSY | Invesco Enhanced Short Duration ETF | 3 | 4 | 2.55 |
| FRN | Invesco Frontier Markets ETF | 3 | 1 | 1.35 |
| EWEM | Invesco MSCI Emerging Markets Equal Country Weight ETF | 3 | 0 | 2.55 |
| CVY | Invesco Zacks Multi-Asset Income ETF | 2 | 4 | 3.23 |
| LVL | Invesco S&P Global Dividend Opportunities Index ETF | 2 | 4 | 1.84 |
Weekly Update: There are no changes to any of the Invesco models this week.
| ETF Name | Symbol | DWA Suggested Weighting | Yield | Date Added |
|---|---|---|---|---|
| Invesco S&P Spin-Off ETF | CSD | 20.000% | 0.5820 | 09/26/2011 |
| Invesco China Technology ETF | CQQQ | 20.000% | 1.5160 | 02/08/2016 |
| Invesco S&P MidCap 400 Equal Weight ETF | EWMC | 20.000% | 1.1800 | 12/09/2013 |
| Invesco Insider Sentiment ETF | NFO | 20.000% | 1.4280 | 09/09/2008 |
| Invesco S&P 500 Top 50 ETF | XLG | 20.000% | 1.8020 | 08/15/2016 |
* - Dates prior to 10/14/08, which is when the Invesco Special Opportunities Model ETF Portfolio became available in the Invesco Weekly ETF Report, are representative of when the position was added to the backtested model.
* - Dates prior to 8/15/2017, which is when the Invesco Dynamic Equal Weight Sector Model became available in the Invesco Weekly ETF Report, are representative of when the position was added to the backtested model.
Guggenheim Funds (Tues.)
Loading, Please Wait...
