Most Requested Symbols


On April 6, 2018, Guggenheim Investments closed the sale of its ETF business to Invesco, Ltd. The Guggenheim ETFs have been transitioned, or are in the process of being transitioned to become part of the Invesco fund family. Please visit invesco.com for information concerning the ETFs.
There are no changes to be made within either of the Dorsey Wright Invesco Models this week, as each of the current holdings continues to maintain positive relative strength within the respective universes.
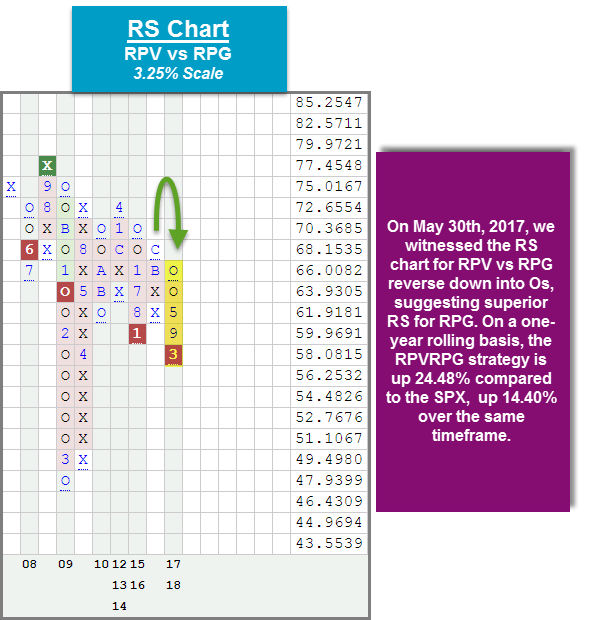
We continue to see growth dominate the asset class group scores page, as each growth style box has an average group score above 4.34 and resides in the strong “blue zone.” In addition, we’ve seen small, mid, and large cap growth size and style boxes make their way up into the top four positions in the DALI US Size & Style rankings. It is clear that growth continues to maintain leadership over value, no matter what the market capitalization category. One of the ETF strategies offered within our ETF Models page examines the relative strength relationship between pure value, pure growth, and cash. Specifically, the Value/Growth Portfolio RPVRPG uses the Invesco S&P 500 Pure Value ETF RPV as a proxy for value and the Invesco S&P 500 Pure Growth ETF RPG as a proxy for growth. When the relative strength chart comparing the two is in a column of Xs, it tells us that value is in favor and RPV is owned within the strategy. On the other hand, if the RS chart reverses down into a column of Os, RPG is held. The only exception would be if RPV or RPG (whichever is in favor) is showing weak RS when compared to cash MNYMKT. In such a case, the model moves 100% to cash. A little over a year ago on May 30th, 2017, we witnessed the relative strength chart (pictured below) reverse down into a column of Os, suggesting superior RS for RPG. As a result, the RPG has been held within this strategy ever since. In March of this year, the RS calculation continued to decrease, resulting in the completion of an RS sell signal, confirming growth’s strength versus value on a long-term basis. So far this year, RPG has outperformed RPV by more than 9% and on a one-year rolling basis, the RPVRPG strategy is up 24.48% compared to the S&P 500 Index SPX, up 14.40% over the same time frame (through 6/11). You can follow this Value/Growth Portfolio under the Models page using the tracking symbol RPVRPG and set email alerts for future shifts in relative strength.
The performance numbers above are price returns and do not include dividends or all transaction costs. Past performance is not indicative of future results. Potential for profits is accompanied by possibility of loss. The relative strength strategy is not a guarantee. There may be times when all investments within the investable universe are out of favor or depreciate in value.

The distribution curve places each ETF on a bell curve according to their respective degrees of overbought or oversold status using a 10-week distribution. ETFs that are statistically oversold will appear on the left-hand side of the bell curve, while those that have become statistically overbought will appear on the right-hand side of the bell curve. Perhaps the most useful attribute of this feature is that it displays the entire universe on the curve at one time to give us a general picture of whether the Invesco ETF universe is generally overbought on a near-term basis, or generally oversold. Our best opportunities are to buy strong relative strength ETFs that have regressed back toward mean conditions based on market weakness, or have become oversold based upon extreme market weakness. Weekly Distribution is a short-term gauge that is most helpful in timing entry and exit points, while the longer-term information of trend and relative strength is a more controlling factor in the decision of whether to buy or sell.
The average Bullish Percent reading this week is 53.74% up 2.45% from the previous week
-100--80
-80--60
-60--40
-40--20
-20-0
0-20
20-40
40-60
60-80
80-100
100->

Legend:
This section of the report categorizes all of the Invesco ETFs by their respective broad group. Along with each group, you can view the Average Group Score, which is an average of the scores of all funds represented in that particular group. Those Invesco ETFs that meet or exceed the Average Group Score will be highlighted in green in order to easily view those Invesco ETFs that have superior strength within their respective group. You want to focus on those ETFs that exhibit superior strength when looking to add new exposure to a particular group.
| Small Cap Funds | Symbol | Name | Score |
|---|---|---|---|
| Average Group Score: 4.4 | EWSC | Invesco S&P SmallCap 600 Equal Weight ETF | 5.75 |
| RZG | Invesco S&P Smallcap 600 Pure Growth ETF | 5.72 | |
| RZV | InvescoS&P Smallcap 600 Pure Value ETF | 4.78 | |
| WMCR | Invesco Wilshire Micro-Cap ETF | 4.36 | |
| EWMC | Invesco S&P MidCap 400 Equal Weight ETF | 4.31 | |
| RFV | Invesco S&P Midcap 400 Pure Value ETF | 3.62 |
| Large Cap Funds | Symbol | Name | Score |
|---|---|---|---|
| Average Group Score: 3.5 | RPG | Invesco S&P 500 Pure Growth ETF | 5.63 |
| DJD | Invesco Dow Jones Industrial Average Dividend ETF | 5.03 | |
| RSP | Invesco S&P 500 Equal Weight ETF | 5.00 | |
| RPV | Invesco S&P 500 Pure Value ETF | 3.84 | |
| XLG | Invesco S&P 500 Top 50 ETF | 3.08 | |
| DEF | Invesco Defensive Equity ETF | 2.92 |
| Mid Cap Funds | Symbol | Name | Score |
|---|---|---|---|
| Average Group Score: 3.5 | RYJ | Invesco Raymond James SB-1 Equity ETF | 5.64 |
| CSD | Invesco S&P Spin-Off ETF | 5.33 | |
| CZA | Invesco Zacks Mid-Cap Core ETF | 4.85 | |
| RFG | Invesco S&P Midcap 400 Pure Growth ETF | 4.43 | |
| NFO | Invesco Insider Sentiment ETF | 4.01 | |
| CVY | Invesco Zacks Multi-Asset Income ETF | 2.79 | |
| GHII | Invesco S&P High Income Infrastructure ETF | 2.04 |
| Sector Funds | Symbol | Name | Score |
|---|---|---|---|
| Average Group Score: 3.5 | TAO | Invesco China Real Estate ETF | 5.72 |
| RYE | Invesco S&P Equal Weight Energy ETF | 5.67 | |
| RYT | Invesco S&P Equal Weight Technology ETF | 5.52 | |
| RYF | Invesco S&P Equal Weight Financials ETF | 4.95 | |
| CUT | Invesco MSCI Global Timber ETF | 4.57 | |
| RCD | Invesco S&P Equal Weight Consumer Discretionary ETF | 4.52 | |
| RGI | Invesco S&P Equal Weight Industrials ETF | 4.37 | |
| RTM | Invesco S&P Equal Weight Materials ETF | 3.57 | |
| RYH | Invesco S&P Equal Weight Health Care ETF | 3.11 | |
| TAN | Invesco Solar ETF | 2.70 | |
| EWRE | Invesco S&P 500 Equal Weight Real Estate ETF | 2.47 | |
| CGW | Invesco S&P Global Water Index Fund | 2.08 | |
| WREI | Wilshire US REIT ETF | 2.02 | |
| ENY | Invesco Canadian Energy Income ETF | 1.82 | |
| RHS | Invesco S&P Equal Weight Consumer Staples ETF | 1.74 | |
| RYU | Invesco S&P Equal Weight Utilities ETF | 1.38 | |
| SEA | Invesco Shipping ETF | 0.48 |
| Global Funds | Symbol | Name | Score |
|---|---|---|---|
| Average Group Score: 3.2 | HAO | Invesco China Small Cap ETF | 5.78 |
| YAO | Invesco China All-Cap ETF | 5.60 | |
| EEB | Invesco BRIC ETF | 4.27 | |
| CQQQ | Invesco China Technology ETF | 3.70 | |
| EWEM | Invesco MSCI Emerging Markets Equal Country Weight ETF | 3.01 | |
| HGI | Invesco Zacks International Multi-Asset Income ETF | 2.18 | |
| FRN | Invesco Frontier Markets ETF | 1.78 | |
| LVL | Invesco S&P Global Dividend Opportunities Index ETF | 1.56 |
| Broad Fixed Income | Symbol | Name | Score |
|---|---|---|---|
| Average Group Score: 2.4 | GSY | Invesco Enhanced Short Duration ETF | 2.35 |
| GCE | Claymore CEF GS Connect ETN | 1.24 |

The DWA Matrix uses a Point & Figure relative strength comparison of each index to one another to identify the strongest and the weakest among the universe used. The ETFs with the most relative strength buy signals (suggesting outperformance) versus the others in the group are listed at the top. These ETFs should be overweighted in the portfolio. Those ETFs with the least amount of relative strength buy signals versus the others in the group are listed at the bottom. These ETFs should be underweighted in the portfolio. The DWA Matrix uses a Point & Figure relative strength comparison of each index to one another to identify the strongest and the weakest among the universe used. The ETFs with the most relative strength buy signals (suggesting outperformance) versus the others in the group are listed at the top. These ETFs should be overweighted in the portfolio. Those ETFs with the least amount of relative strength buy signals versus the others in the group are listed at the bottom. These ETFs should be underweighted in the portfolio.
| Ticker | Name | Buys | Xs | Tech Attribute/ Score |
|---|---|---|---|---|
| TAO | Invesco China Real Estate ETF | 15 | 11 | 5.72 |
| RYT | Invesco S&P Equal Weight Technology ETF | 13 | 13 | 5.52 |
| RTM | Invesco S&P Equal Weight Materials ETF | 12 | 7 | 3.57 |
| CQQQ | Invesco China Technology ETF | 12 | 3 | 3.70 |
| RGI | Invesco S&P Equal Weight Industrials ETF | 10 | 6 | 4.37 |
| RYE | Invesco S&P Equal Weight Energy ETF | 9 | 15 | 5.67 |
| RYF | Invesco S&P Equal Weight Financials ETF | 9 | 8 | 4.95 |
| CUT | Invesco MSCI Global Timber ETF | 8 | 12 | 4.57 |
| RCD | Invesco S&P Equal Weight Consumer Discretionary ETF | 6 | 9 | 4.52 |
| RYH | Invesco S&P Equal Weight Health Care ETF | 6 | 6 | 3.11 |
| CGW | Invesco S&P Global Water Index Fund | 6 | 5 | 2.08 |
| RHS | Invesco S&P Equal Weight Consumer Staples ETF | 5 | 1 | 1.74 |
| TAN | Invesco Solar ETF | 4 | 0 | 2.70 |
| ENY | Invesco Canadian Energy Income ETF | 2 | 14 | 1.82 |
| RYU | Invesco S&P Equal Weight Utilities ETF | 1 | 5 | 1.38 |
| WREI | Wilshire US REIT ETF | 1 | 4 | 2.02 |
| Ticker | Name | Buys | Xs | Tech Attribute/ Score |
|---|---|---|---|---|
| YAO | Invesco China All-Cap ETF | 24 | 19 | 5.60 |
| RPG | Invesco S&P 500 Pure Growth ETF | 21 | 23 | 5.63 |
| RZG | Invesco S&P Smallcap 600 Pure Growth ETF | 20 | 23 | 5.72 |
| EEB | Invesco BRIC ETF | 19 | 9 | 4.27 |
| CSD | Invesco S&P Spin-Off ETF | 17 | 17 | 5.33 |
| HAO | Invesco China Small Cap ETF | 16 | 18 | 5.78 |
| CZA | Invesco Zacks Mid-Cap Core ETF | 16 | 14 | 4.85 |
| RPV | Invesco S&P 500 Pure Value ETF | 16 | 9 | 3.84 |
| EWMC | Invesco S&P MidCap 400 Equal Weight ETF | 15 | 10 | 4.31 |
| RFV | Invesco S&P Midcap 400 Pure Value ETF | 15 | 10 | 3.62 |
| RYJ | Invesco Raymond James SB-1 Equity ETF | 14 | 18 | 5.64 |
| NFO | Invesco Insider Sentiment ETF | 13 | 18 | 4.01 |
| XLG | Invesco S&P 500 Top 50 ETF | 13 | 13 | 3.08 |
| RSP | Invesco S&P 500 Equal Weight ETF | 13 | 12 | 5.00 |
| WMCR | Invesco Wilshire Micro-Cap ETF | 12 | 19 | 4.36 |
| RZV | InvescoS&P Smallcap 600 Pure Value ETF | 11 | 17 | 4.78 |
| EWSC | Invesco S&P SmallCap 600 Equal Weight ETF | 11 | 15 | 5.75 |
| DEF | Invesco Defensive Equity ETF | 11 | 6 | 2.92 |
| RFG | Invesco S&P Midcap 400 Pure Growth ETF | 8 | 14 | 4.43 |
| FRN | Invesco Frontier Markets ETF | 5 | 1 | 1.78 |
| HGI | Invesco Zacks International Multi-Asset Income ETF | 3 | 4 | 2.18 |
| GSY | Invesco Enhanced Short Duration ETF | 3 | 4 | 2.35 |
| EWEM | Invesco MSCI Emerging Markets Equal Country Weight ETF | 3 | 4 | 3.01 |
| LVL | Invesco S&P Global Dividend Opportunities Index ETF | 2 | 3 | 1.56 |
| CVY | Invesco Zacks Multi-Asset Income ETF | 2 | 1 | 2.79 |
Weekly Update:
| ETF Name | Symbol | DWA Suggested Weighting | Yield | Date Added |
|---|---|---|---|---|
| Invesco S&P Spin-Off ETF | CSD | 20.000% | 0.5650 | 09/26/2011 |
| Invesco China Technology ETF | CQQQ | 20.000% | 1.3960 | 02/08/2016 |
| Invesco S&P MidCap 400 Equal Weight ETF | EWMC | 20.000% | 1.0850 | 12/09/2013 |
| Invesco Insider Sentiment ETF | NFO | 20.000% | 1.3950 | 09/09/2008 |
| Invesco S&P 500 Top 50 ETF | XLG | 20.000% | 1.7660 | 08/15/2016 |
* - Dates prior to 10/14/08, which is when the Invesco Special Opportunities Model ETF Portfolio became available in the Invesco Weekly ETF Report, are representative of when the position was added to the backtested model.
* - Dates prior to 8/15/2017, which is when the Invesco Dynamic Equal Weight Sector Model became available in the Invesco Weekly ETF Report, are representative of when the position was added to the backtested model.
Guggenheim Funds (Tues.)
Loading, Please Wait...
