Most Requested Symbols


| ADDYY Adidas Group (Germany) ADR ($126.41) - Leisure - ADDY reversed into Xs and broke a double top at $126 for a third buy signal since February. This also marks a new 52-week high for the 4 for 5'er. ADDYY maintains positive near-term RS against the market and its peer group while maintaining long-term positive RS against the market. Okay to consider on a pullback to $120. Initial support lies at $118, while additional can be found at $104 and $95, the bullish support line. |
| BAC Bank of America ($38.90) - Banks - BAC shares moved higher today to break a double top at $39 to mark its second consecutive buy signal. This 4 for 5'er has been in a positive trend since March but on an RS sell signal versus the market since March 2023. BAC shares are trading above the middle of their trading band with a weekly overbought/oversold reading of 36%. From here, support is offered at $35. |
| C Citigroup, Inc. ($63.80) - Banks - C shares moved higher today to break a double top at $64 to mark its fourth consecutive buy signal. This 3 for 5'er has been in a positive trend since December but has been on an RS sell signal versus the market since March 2020. C shares are trading above the middle of their trading band with a weekly ovebought/oversold reading of 37%. From here, support is offered at $57. |
| FMC FMC Corporation ($63.92) - Chemicals - FMC fell to a sell signal on Wednesday when it broke a double bottom at $64. Wednesday's move adds weight to an already negative technical picture as FMC is a 2 for 5'er that has been trading in a negative trend for more than year. From here, the next level of support sits at $56. |
| GEV GE Vernova Inc. ($168.08) - Utilities/Electricity - GEV reversed into Xs and broke a double top at $172 to return to a buy signal and match the rally high from earlier this month. GEV is a 3 for 5'er that maintains a positive trend on its default chart and positive near-term RS against the market and its peer group. GVE resides in overbought territory, so those seeking exposure may look for consolidation at current price levels before considering. Initial support lies at $160, while additional can be found at $150. |
| INTU Intuit Inc. ($655.13) - Software - INTU pushed higher Wednesday to break a double top at $648 before moving to $656 intraday. This also led the stock to move back to a positive trend, improving it to a 5 for 5 TA rating. INTU has maintained an RS buy signal against the market since 2008 and sits in the top third of the software sector RS matrix. Weekly momentum also just flipped positive, suggesting the potential for further upside from here. The weight of the technical evidence is favorable and continues to improve. Initial support can be seen at $608 with further support at $600. Note that earnings are expected on 5/23. |
| SMCI Super Micro Computer, Inc. ($952.36) - Computers - SMCI moved higher Wednesday to break a double top at $848 before moving to $944 intraday. This 3 for 5'er is showing further near-term technical improvement while ascending from its April low of $672 to the current position just beneath its 50-day moving average. The stock has continued to maintain favorable relative strength against the market from a longer-term perspective. Initial support can be seen at $768 with further support at $704 and $672. Further overhead resistance is seen around $1008 with the potential for stronger resistance at $1056. |
| TOL Toll Brothers, Inc. ($134.48) - Building - TOL broke a double top at $130 to return to a buy signal as the stock rallied to a new high at $134. The stock is a 5 for 5'er and ranks 8th (out of 66) in the Building sector matrix. Okay to consider here on the breakout or on a pullback into the upper-$120s. Initial support lies at $112, while additional can be found at $99 and $96. |
| VST Vistra Corp ($96.60) - Utilities/Electricity - VST reversed into Xs and broke a double top at $97 for a new all-time chart high. This is the second buy signal since mid-April for this 5 for 5'er. VST ranks 1st (out of 47) in the Electric Utilities sector matrix, and weekly momentum has flipped back positive. Short-term holders may seek to lock in profits. Those seeking long-term exposure to wait for consolidation at current price levels before considering. Initial support lies at $88. |

Each week the analysts at NDW review and comment on all major asset classes in the global markets. Shown below is the summary or snapshot of the primary technical indicators we follow for multiple areas. Should there be changes mid-week we will certainly bring these to your attention via the report.
| Universe | BP Col & Level (actual) | BP Rev Level | PT Col & Level (actual) | PT Rev Level | HiLo Col & Level (actual) | HiLo Rev Level | 10 Week Col & Level (actual) | 10 Week Rev Level | 30 Week Col & Level (actual) | 30 Week Rev Level |
|---|---|---|---|---|---|---|---|---|---|---|
| ALL |
|
44% |
|
34% |
|
64% |
|
46% |
|
48% |
| NYSE |
|
50% |
|
52% |
|
78% |
|
56% |
|
62% |
| OTC |
|
40% |
|
28% |
|
54% |
|
40% |
|
42% |
| World |
|
46% |
|
38% |
|
|
|
46% |
|
56% |

Interested in hearing more? Click here to sign up for a full trial to the Daily Equity Report!

Remember, these are technical comments only. Just as you must be aware of fundamental data for the stocks we recommend based on technical criteria in the report, so too must you be aware of important data regarding delivery, market moving government releases, and other factors that may influence commodity pricing. We try to limit our technical comments to the most actively traded contracts in advance of delivery, but some contracts trade actively right up to delivery while others taper off well in advance. Be sure you check your dates before trading these contracts. For questions regarding this section or additional coverage of commodities email will.gibson@nasdaq.com.
Data represented in the table below is through 5/14/2024:
Broad Market Commodities Report
| Symbol | Name | Price | PnF Trend | RS Signal | RS Col. | 200 Day MA | Weekly Mom |
|---|---|---|---|---|---|---|---|
| CL/ | Crude Oil Continuous | 78.02 | Negative | Buy | X | 79.99 | - 4W |
| DBLCIX | Deutsche Bank Liquid Commodities Index | 486.42 | Positive | Sell | O | 487.42 | - 3W |
| DWACOMMOD | DWA Continuous Commodity Index | 866.12 | Positive | Buy | O | 815.91 | - 3W |
| GC/ | Gold Continuous | 2353.40 | Positive | Sell | X | 2048.92 | - 3W |
| HG/ | Copper Continuous | 4.95 | Positive | Buy | X | 3.89 | + 14W |
| ZG/ | Corn (Electronic Day Session) Continuous | 467.50 | Negative | Sell | O | 459.70 | + 11W |
Copper has been ripping. For instance, the continuous chart (HG/) took out its all-time high from March 2022 and gained over 16% in the past month alone.
We keep a close eye on copper prices due to their economic implications and correlations with other groups, like Small Caps and Emerging Markets. Furthermore, some may remember this piece that showed large cap domestic equity markets performing better when copper prices rise more than other commodities.
In short, advancing copper prices have historically been a good sign for the economy and markets.
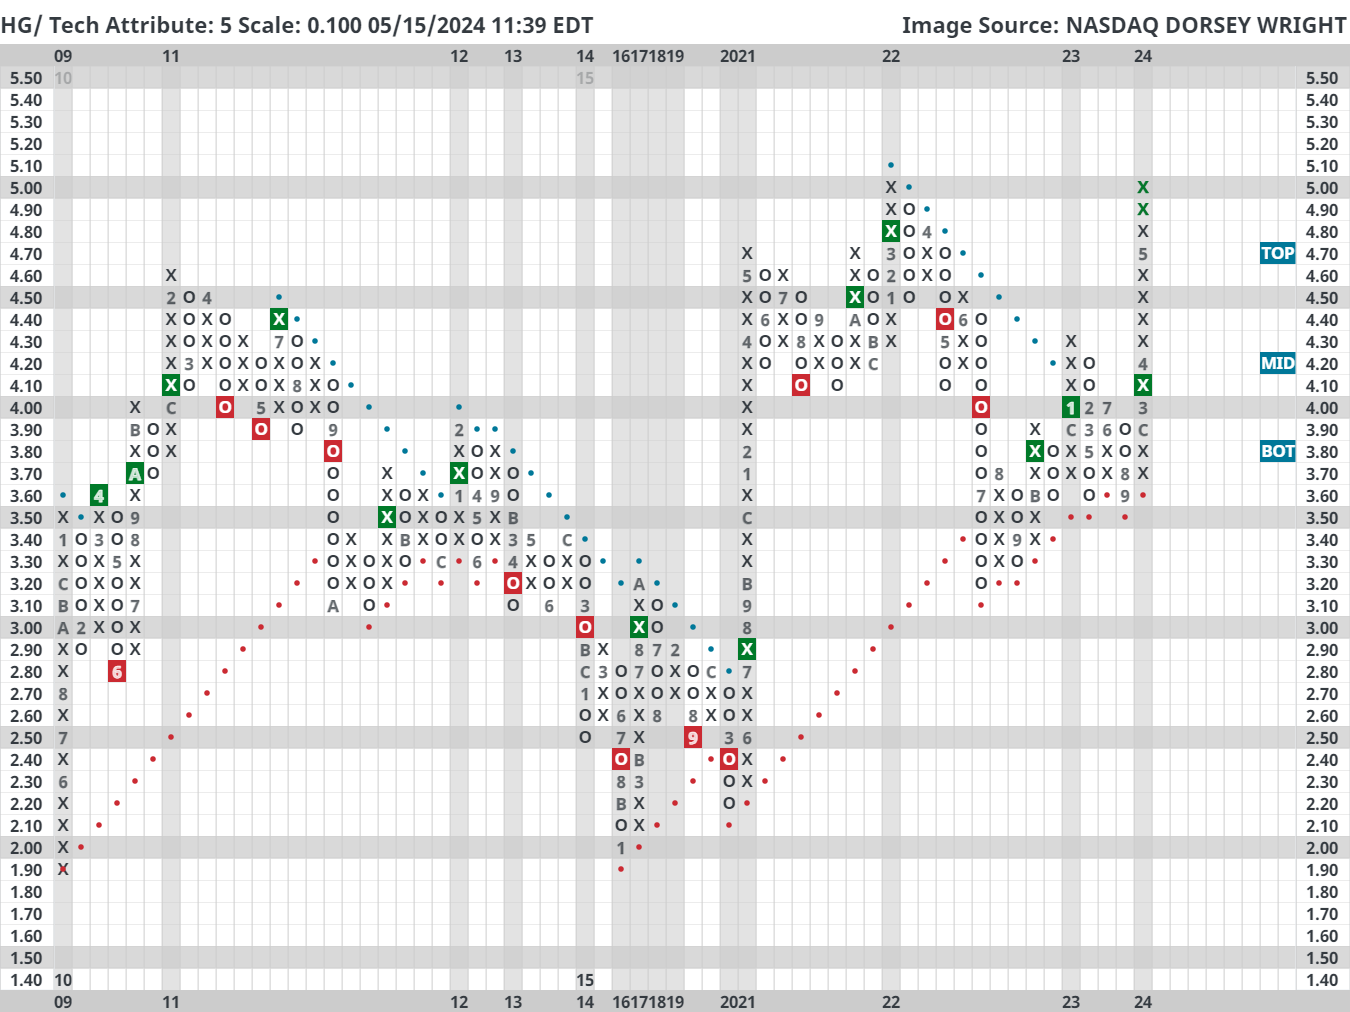
Positive macro implications aside, there are some valid reasons to think the current rally could stall. First, copper is currently sitting at an OBOS (overbought) reading of 155% on our platform which is the highest since April 2006. In other words, the current price is extremely stretched compared to its 50-day moving average.
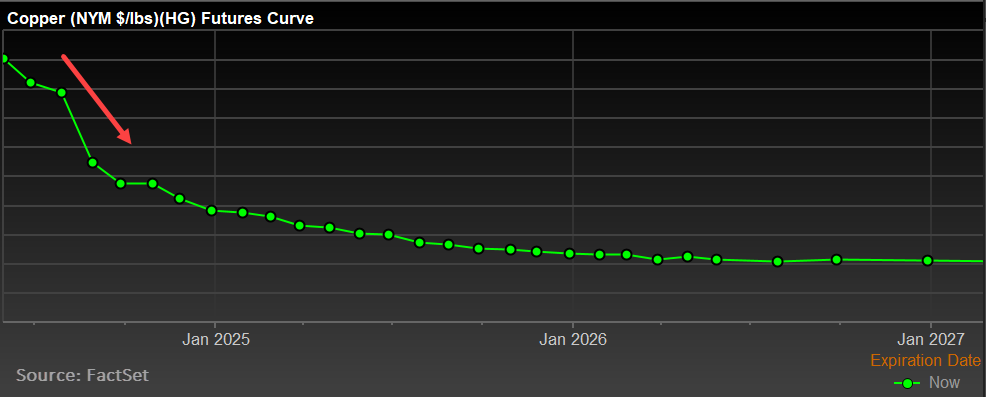
Second, the futures curve is in steep backwardation. In fact, “the spike also pushed the Comex market into its biggest-ever backwardation — indicating tight nearby supply — with July trading nearly 30 cents a pound above the September contract on Wednesday” (Source: Bloomberg).
This degree of backwardation is bearish for prices, at least in the short term, suggesting that demand for copper is lower in the future. That is not a rosy economic implication given the premise and introduction today. That said, things can change rather quickly - so for trend followers, the current direction is clearly up and to the right.
Average Level
18.69
| < - -100 | -100 - -80 | -80 - -60 | -60 - -40 | -40 - -20 | -20 - 0 | 0 - 20 | 20 - 40 | 40 - 60 | 60 - 80 | 80 - 100 | 100 - > |
|---|---|---|---|---|---|---|---|---|---|---|---|
|
Buy signalrsp
|
|||||||||||
|
Buy signalgcc
|
|||||||||||
|
Buy signalQQQ
|
|||||||||||
|
Buy signalVOOV
|
|||||||||||
|
Buy signalvoog
|
|||||||||||
|
Buy signaltlt
|
Buy signaloneq
|
||||||||||
|
Buy signalgsg
|
Buy signalhyg
|
Buy signalIJH
|
|||||||||
|
Buy signalief
|
Sell signalicf
|
Buy signalspy
|
|||||||||
|
Sell signallqd
|
Sell signalfxe
|
Buy signaldia
|
Buy signalgld
|
||||||||
|
Buy signalshy
|
Buy signaldx/y
|
Buy signalijr
|
Buy signalefa
|
||||||||
|
Buy signalUSO
|
Buy signalagg
|
Sell signaliwm
|
Buy signalXLG
|
Buy signaldvy
|
Buy signaleem
|
||||||
| < - -100 | -100 - -80 | -80 - -60 | -60 - -40 | -40 - -20 | -20 - 0 | 0 - 20 | 20 - 40 | 40 - 60 | 60 - 80 | 80 - 100 | 100 - > |
| AGG | iShares US Core Bond ETF |
| USO | United States Oil Fund |
| DIA | SPDR Dow Jones Industrial Average ETF |
| DVY | iShares Dow Jones Select Dividend Index ETF |
| DX/Y | NYCE U.S.Dollar Index Spot |
| EFA | iShares MSCI EAFE ETF |
| FXE | Invesco CurrencyShares Euro Trust |
| GLD | SPDR Gold Trust |
| GSG | iShares S&P GSCI Commodity-Indexed Trust |
| HYG | iShares iBoxx $ High Yield Corporate Bond ETF |
| ICF | iShares Cohen & Steers Realty ETF |
| IEF | iShares Barclays 7-10 Yr. Tres. Bond ETF |
| LQD | iShares iBoxx $ Investment Grade Corp. Bond ETF |
| IJH | iShares S&P 400 MidCap Index Fund |
| ONEQ | Fidelity Nasdaq Composite Index Track |
| QQQ | Invesco QQQ Trust |
| RSP | Invesco S&P 500 Equal Weight ETF |
| IWM | iShares Russell 2000 Index ETF |
| SHY | iShares Barclays 1-3 Year Tres. Bond ETF |
| IJR | iShares S&P 600 SmallCap Index Fund |
| SPY | SPDR S&P 500 Index ETF Trust |
| TLT | iShares Barclays 20+ Year Treasury Bond ETF |
| GCC | WisdomTree Continuous Commodity Index Fund |
| VOOG | Vanguard S&P 500 Growth ETF |
| VOOV | Vanguard S&P 500 Value ETF |
| EEM | iShares MSCI Emerging Markets ETF |
| XLG | Invesco S&P 500 Top 50 ETF |
From the Analyst
Loading, Please Wait...
