
Most Requested Symbols


| AMD Advanced Micro Devices, Inc. ($57.54) - Semiconductors - AMD broke a triple top at $57 before moving through multiple levels of resistance to $59. This stock is a 3 for 5’er within the favored semiconductors sector that has maintained a market RS buy signal since May 2018. Demand is in control. From here, a move to $60 would mark a new all-time high while initial support sits at $50. |
| ANAB Anaptysbio ($19.77) - Biomedics/Genetics - Anaptysbio completed a bullish catapult at $22 during today's action to mark a fifth consecutive buy signal. ANAB is a 3 for 5'er that moved to a market RS buy signal in March of 2020 and ranks in the top half of the favored biomedics/genetics sector RS matrix. Additionally, monthly momentum has recently flipped positive, suggesting the potential for further gains. The technical picture is improving and demand is in control here. Okay to add on the breakout, noting that support is offered at $18.50 and $18. ANAB returns to a positive trend at $39. |
| BILL Bill.com Holdings, Inc. ($73.84) - Business Products - Bill.com shares completed a shakeout pattern at $74 today to return to a buy signal. This 3 for 5'er returned to a positive trend and market RS buy signal in April and ranks in the top half of the favored business products sector RS matrix. Demand is in control and long exposure may be added here on an individual basis or via the DWA Business Products Sector Portfolio, of which BILL is a holding. Note that support is offered at $67 and $62 for this high rRisk name. |
| CDNS Cadence Design Systems, Inc. ($92.67) - Software - Cadence Design Systems broke a double top at $94 during today's action, marking a fourth consecutive buy signal and a new all-time high. This strong 5 for 5'er returned to a positive trend in April but has maintained a market RS buy signal since February of 2009. Additionally, CDNS ranks in the top half of the favored software sector RS matrix. The weight of the evidence is positive and demand is in control. However, CDNS is heavily overbought at current levels. Those considering long exposure may be well served to wait for a pullback to initial support at $90 before adding here. |
| CVNA Carvana Company ($121.46) - Autos and Parts - CVNA broke a double top at $120 before printing a new all-time high at $122. This breakout marks the third consecutive buy signal on the chart, confirming that demand is in control. CVNA ranks in the top quartile of the favored autos and parts sector and is a solid 5 for 5’er. Initial support sits at $112. |
| MELI Mercadolibre, Inc. ($884.26) - Internet - MELI, a perfect 5 for 5’er broke a double top at $880 on Wednesday and is now trading at new all-time highs. This breakout marks the fourth consecutive buy signal, confirming that demand has the upper hand. In addition to being a high attribute name, MELI ranks in the top quartile of the favored internet sector RS matrix and has experienced two months of positive monthly momentum. From here, initial support sits at $784. Note MELI is nearing the top of the 10-week trading band, indicating that it is overbought. |
| NVDA NVIDIA Corporation ($374.35) - Semiconductors - NVDA broke a double top at $368 before rallying to $380 on Wednesday, marking a new all-time high on the chart in addition to the sixth consecutive buy signal. This stock is a perfect 5 for 5’er within the favored semiconductors sector that has maintained a market RS buy signal since May 2016. Demand is in control however NVDA is nearly 100% overbought here so new positions would best be initiated on a pullback or normalization of the 10-week trading band. Support sits at $320. |
| PYPL Paypal Holdings Inc ($159.26) - Business Products - PYPL printed a new all-time high at $160 when it gave a sixth consecutive buy signal. This stock is a solid 4 for 5’er that moved back into a positive trend in early April. In addition, monthly momentum has been positive for three months. PYPL currently ranks in the top quartile of the favored business products sector RS matrix. From here, support sits at $150. Today’s move puts PYPL above the top of its 10-week trading band so those looking to initiate new positions may wish to scale in or enter on a pullback. |
| ROKU Roku, Inc. Class A ($112.91) - Media - ROKU returned to a buy signal with a double top break at $116. This stock is a 3 for 5’er that is showing signs of absolute improvement. From current levels, support is offered at $102. Note ROKU faces overhead resistance at $120 and $134. |
| VEEV Veeva Systems Inc. ($224.90) - Computers - VEEV broke a double top at $224, which successfully completes a bullish catapult pattern and marks a new all-time high. This stock is a solid 5 for 5’er that has maintained a market RS buy signal since May 2016. In addition, monthly momentum has been positive for three months. From here, initial support sits at $200. |

Each week the analysts at DWA review and comment on all major asset classes in the global markets. Shown below is the summary or snapshot of the primary technical indicators we follow for multiple areas. Should there be changes mid-week we will certainly bring these to your attention via the report.
| Universe | BP Col & Level (actual) | BP Rev Level | PT Col & Level (actual) | PT Rev Level | HiLo Col & Level (actual) | HiLo Rev Level | 10 Week Col & Level (actual) | 10 Week Rev Level | 30 Week Col & Level (actual) | 30 Week Rev Level |
|---|---|---|---|---|---|---|---|---|---|---|
| ALL |
|
60% |
|
40% |
|
82% |
|
84% |
|
46% |
| NYSE |
|
74% |
|
50% |
|
84% |
|
90% |
|
44% |
| OTC |
|
54% |
|
38% |
|
84% |
|
82% |
|
46% |
| World |
|
54% |
|
38% |
|
|
|
76% |
|
36% |
| Symbol | Name | Price | Yield | PnF Trend | RS Signal | RS Col. | Fund Score | 200 Day MA | Weekly Mom |
|---|---|---|---|---|---|---|---|---|---|
| DIA | SPDR Dow Jones Industrial Average ETF Trust | 273.38 | 2.15 | Positive | X | 3.78 | 263.30 | +9W | |
| EEM | iShares MSCI Emerging Markets ETF | 40.89 | 2.38 | Positive | Sell | O | 2.30 | 40.56 | +9W |
| EFA | iShares MSCI EAFE ETF | 63.81 | 3.37 | Positive | Sell | O | 1.58 | 63.28 | +9W |
| FM | iShares MSCI Frontier 100 ETF | 24.60 | 3.85 | Negative | Sell | O | 0.31 | 26.93 | +9W |
| IJH | iShares S&P MidCap 400 Index Fund | 190.44 | 1.81 | Positive | Buy | O | 2.90 | 184.97 | +9W |
| IJR | iShares S&P SmallCap 600 Index Fund | 73.71 | 1.63 | Positive | Buy | O | 2.53 | 73.75 | +9W |
| QQQ | Invesco QQQ Trust | 243.30 | 0.68 | Positive | Buy | X | 5.04 | 206.68 | +9W |
| RSP | Invesco S&P 500 Equal Weight ETF | 110.26 | 2.00 | Positive | Buy | X | 3.91 | 105.13 | +9W |
| SPY | SPDR S&P 500 ETF Trust | 320.79 | 1.80 | Positive | O | 3.91 | 300.66 | +9W | |
| XLG | Invesco S&P 500 Top 50 ETF | 241.94 | 1.53 | Positive | O | 4.39 | 221.26 | +9W |
It was another exceptionally strong week for the 10 major market funds covered in this report as each managed to finish in positive territory. The top-performing fund over the last seven days was the iShares S&P SmallCap 600 Index Fund IJR, up a notable 8.99%. Conversely, the iShares MSCI Frontier 100 ETF FM lagged the pack despite finishing in positive territory with a gain of 2.80%. Two of the 10 major market funds currently sit in positive territory on the year, the Invesco QQQ Trust QQQ and the Invesco S&P Top 50 ETF XLG, with respective gains of 14.43% and 3.66% (through 6/9). In fact, with today’s (6/10) market action, the tech-heavy QQQ has rallied to new all-time highs, which we’ll discuss below. We have also updated initial support levels for all 10 major market funds covered in this report using today’s intraday action (note: all technical data is through 6/9).

As previously mentioned, the QQQ has reached a new all-time high at $245 with today’s market action as large-cap growth stocks continue to drive major US indexes higher. Recall that QQQ was the first major market fund to move back into positive territory for the year following the COVID-19 selloff and continues to lead the #2 performer, XLG, by a whopping 10.67%. To read more on the divergence between the QQQ and XLG, click here for the Major Market ETF Update published on May 20th. In early April, the QQQ returned to a buy signal with a spread triple top at $192 and has continued to rally in a single column of Xs without a pullback ever since. As a result, QQQ is nearing the very top of its 10-week trading band with an OBOS% reading of 93% overbought. Additionally, monthly momentum has been positive for two months, suggesting the potential for higher prices for the QQQ. From a fund score perspective, the QQQ has a solid score of 5.04, outscoring the average growth-domestic fund by 1.26 score points, the average all US fund by 1.82 score points, as well as the average US large-cap growth fund by 0.84 score points. The weight of the technical evidence is overwhelmingly positive, and demand is in control. As previously mentioned, QQQ is trading in technically overbought territory so those looking to initiate new long positions may wish to scale in or enter on a pullback and/or normalization of the trading band. An initial support level on the default chart sits at $182, with additional support offered with a test of the bullish support line at $178. For those looking for tighter support levels, we find viable support at $234 and $229 on the QQQ’s more sensitive 1 point per box chart.


SECTOR BULLISH PERCENT CHANGES
| Reversed to X | Reversed to O |
|---|---|
| 0 | 1 (BPBIOM | 52), |
| To Xs | To Os |
|---|
Average Level
68.81
| Sector |
|---|
| None |
| Sector |
|---|
| None |
| Sector |
|---|
| Biomedics/Genetics (52%) - Bull Correction |
SECTOR INDICATOR CHART CHANGES
PT is the percentage of stocks within a sector that are trading above their bullish support lines. RSX is the percentage of stocks within a sector whose relative strength charts are in a column of Xs. RSP is the percentage of stocks within a sector whose relative strength charts are on a buy signal. The strongest sectors, i.e. market leaders, will have most of these indicators positive and moving higher in a column of Xs.
|
There were only rising sector PT charts this week, with 37 rising and none moving lower. The following sector charts rose: Aerospace Airline [^PTAERO], Autos and Parts [^PTAUTO], Banks [^PTBANK], Building [^PTBUIL], Business Products [^PTBUSI], Chemicals [^PTCHEM], Computers [^PTCOMP], Electronics [^PTELEC], Utilities/Electricity [^PTEUTI], Finance [^PTFINA], Food Beverages/Soap [^PTFOOD], Forest Prods/Paper [^PTFORE], Gaming [^PTGAME], Gas Utilities [^PTGUTI], Healthcare [^PTHEAL], Household Goods [^PTHOUS], Internet [^PTINET], Insurance [^PTINSU], Leisure [^PTLEIS], Machinery and Tools [^PTMACH], Media [^PTMEDI], Metals Non Ferrous [^PTMETA], Oil [^PTOIL], Oil Service [^PTOILS], Protection Safety Equipment [^PTPROT], Real Estate [^PTREAL], Restaurants [^PTREST], Retailing [^PTRETA], Savings & Loans [^PTSAVI], Semiconductors [^PTSEMI], Software [^PTSOFT], Steel/Iron [^PTSTEE], Telephone [^PTTELE], Textiles/Apparel [^PTTEXT], Transports/Non Air [^PTTRAN], Wall Street [^PTWALL], Waste Management [^PTWAST]-Rev. . There were 1 that reversed to X. |
|
| ^PT Charts Reversing Up - | ^PT Charts Reversing Down - |
|
|
| ^PT Charts Moving Higher - | ^PT Charts Moving Lower - |
|
|
|
There were mostly RSX charts rising this week, with 21 rising and 13 moving lower. The following sector charts rose: Aerospace Airline [^RSXAERO], Autos and Parts [^RSXAUTO], Banks [^RSXBANK], Building [^RSXBUIL], Business Products [^RSXBUSI]-Rev. , Chemicals [^RSXCHEM], Finance [^RSXFINA], Household Goods [^RSXHOUS], Leisure [^RSXLEIS], Machinery and Tools [^RSXMACH]-Rev. , Media [^RSXMEDI], Metals Non Ferrous [^RSXMETA], Oil [^RSXOIL]-Rev. , Oil Service [^RSXOILS]-Rev. , Real Estate [^RSXREAL], Restaurants [^RSXREST], Retailing [^RSXRETA], Savings & Loans [^RSXSAVI], Steel/Iron [^RSXSTEE], Textiles/Apparel [^RSXTEXT], Transports/Non Air [^RSXTRAN]-Rev. . The following sector charts fell: Biomedics/Genetics [^RSXBIOM], Computers [^RSXCOMP], Drugs [^RSXDRUG], Utilities/Electricity [^RSXEUTI], Food Beverages/Soap [^RSXFOOD], Healthcare [^RSXHEAL], Internet [^RSXINET], Precious Metals [^RSXPREC], Protection Safety Equipment [^RSXPROT]-Rev. , Semiconductors [^RSXSEMI], Software [^RSXSOFT]-Rev. , Wall Street [^RSXWALL], Waste Management [^RSXWAST]-Rev. . There were 2 that moved to buy signals and 5 that moved to sell signals. The following were buy signals: Media [^RSXMEDI],Textiles/Apparel [^RSXTEXT]. The following were sell signals: Computers [^RSXCOMP],Food Beverages/Soap [^RSXFOOD],Healthcare [^RSXHEAL],Precious Metals [^RSXPREC],Software [^RSXSOFT]. |
|
| ^RSX Charts Reversing Up - | ^RSX Charts Reversing Down - |
| ^RSX Charts Moving Higher - | ^RSX Charts Moving Lower - |
|
|
|
There were mostly RSP charts rising this week, with 18 rising and 1 moving lower. The following sector charts rose: Aerospace Airline [^RSPAERO]-Rev. , Autos and Parts [^RSPAUTO], Building [^RSPBUIL], Electronics [^RSPELEC], Finance [^RSPFINA], Gas Utilities [^RSPGUTI], Household Goods [^RSPHOUS], Leisure [^RSPLEIS], Machinery and Tools [^RSPMACH]-Rev. , Media [^RSPMEDI], Metals Non Ferrous [^RSPMETA], Oil [^RSPOIL], Oil Service [^RSPOILS], Real Estate [^RSPREAL], Restaurants [^RSPREST], Retailing [^RSPRETA], Steel/Iron [^RSPSTEE]-Rev. , Textiles/Apparel [^RSPTEXT]. The following sector chart fell: Insurance [^RSPINSU]. There were 3 that reversed to X. |
|
| ^RSP Charts Reversing Up - | ^RSP Charts Reversing Down - |
|
|
|
| ^RSP Charts Moving Higher - | ^RSP Charts Moving Lower - |
|
|
FAVORED SECTOR STATUS CHANGES
A sector is considered to be Favored if it has 3 or 4 of the sector indicators (Relative Strength, RSX, RSP, & PT) positive, Average if it has 2 of the 4 indicators positive, & Unfavored if it has 0 or 1 of the indicators positive. The table below contains those sectors that have experienced a Favored Sector Status change over the past week. It is best to focus on sectors that are about 50% or lower on their Bullish Percent charts & are in Xs. Note: If a sector moves from Favored to Average, it doesn't necessarily mean that the sector in question has to be sold - it just means you need to evaluate your individual positions with exposure to that sector.
| Changes since 06/03/2020 | Full Report |
|
|
|
|
|||||||||||||
|
|
|
|
|
|
|||||||||||
|
|
|
|
|
|||||||||||
|
|
|
|
|
|
|||||||||||
Remember, these are technical comments only. Just as you must be aware of fundamental data for the stocks we recommend based on technical criteria in the report, so too must you be aware of important data regarding delivery, market moving government releases, and other factors that may influence commodity pricing. We try to limit our technical comments to the most actively traded contracts in advance of delivery, but some contracts trade actively right up to delivery while others taper off well in advance. Be sure you check your dates before trading these contracts. For questions regarding this section or additional coverage of commodities email james.west@dorseywright.com.
Data represented in the table below is through 06/09/2020:
Broad Market Commodities Report
| Symbol | Name | Price | PnF Trend | RS Signal | RS Col. | 200 Day MA | Weekly Mom |
|---|---|---|---|---|---|---|---|
| CL/ | Crude Oil Continuous | 38.72 | Negative | Buy | X | 46.04 | +7W |
| DBLCIX | Deutsche Bank Liquid Commodities Index | 256.84 | Negative | Sell | O | 290.29 | +9W |
| DWACOMMOD | DWA Continuous Commodity Index | 452.25 | Negative | Buy | O | 460.41 | +8W |
| GC/ | Gold Continuous | 1720.80 | Positive | Buy | X | 1577.40 | -5W |
| HG/ | Copper Continuous | 2.60 | Negative | Buy | O | 2.56 | +8W |
| ZG/ | Corn (Electronic Day Session) Continuous | 327.25 | Negative | Buy | O | 361.85 | +6W |
Since March, both the Federal Reserve Bank and Congress have taken “unprecedented” policy measures to provide liquidity, inflate asset prices, and ultimately stimulate the economy. While it is still very much up for debate whether or not quantitative easing leads to inflation in the long-term, having a game plan for potential inflation is important in guiding long-term investment decisions.The first step is finding evidence of inflation, which is defined as “a general increase in prices and fall in the purchasing value of money.” Given this definition, evidence of inflation would be a rise in prices and or a decrease in the value of the dollar. The first piece of the equation can be measured using the Consumer Price Index (CPI). The index provides a measure of the average change over time in prices paid by urban consumers for a market basket of consumer goods and services. According to the Bureau of Labor Statistics, the CPI has fallen for the last three consecutive months of March, April, and most recently, May (source: BLS). For now, the CPI has painted a picture of deflation rather than inflation.
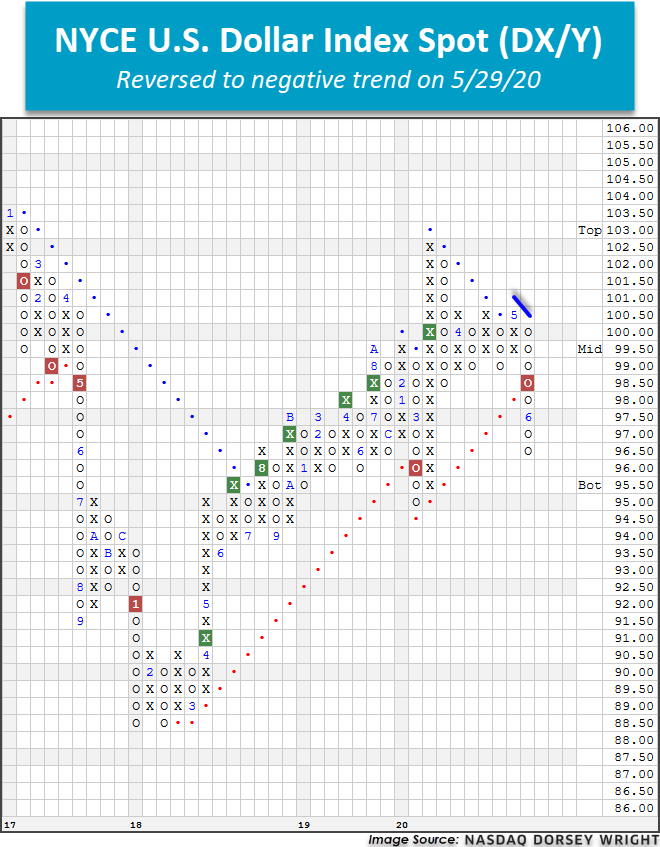
For the second part of the equation, we turn to the dollar. If there is evidence of inflation, then the value of the dollar should be decreasing. When we look at the NYCE U.S. Dollar Index Spot DX/Y there are signs of weakness. After two months of consolidation near the $100 level on its Point & Figure Chart, DX/Y broke through a triple bottom at $98.50 to return to a sell signal and has since fallen into a negative trend at the end of May.
What do we make of these conflicting pieces of evidence? Although there hasn’t been a general increase in prices, we have also seen signs of a decrease in the purchasing power of the dollar. One fact worth remembering is that the Consumer Price Index is reported monthly and posthumously, whereas DX/Y is constantly changing and potentially can be seen as more of a leading view of potential inflation. Although the evidence is not overwhelming at this point, if you’re concerned about inflation and are looking for an alternative to using Treasury inflation-protected securities (TIPS), there is another option. The Index IQ Real Return ETF CPI tracks an index that seeks to provide a “real return” or a return above the rate of inflation thus providing a hedge to a rise in the Consumer Price Index. The fund holds a variety of fixed income, equities, and real asset funds in an “ETF of ETFs” wrapper. This provides a unique alternative to traditional inflation-protected fixed income investments and is dynamic to reflect inflation expectations. Despite a suboptimal fund score of 1.62, CPI has rallied off its March low of $25.10 to complete three consecutive buy signals on its way to $27.30 on the more-sensitive 0.10 pt chart. From here, support is offered at $27. Note that CPI carries a yield of 2.17% and an expense ratio of 0.44%.

For more information on liquid alternative strategies including CPI, please register for next Tuesday's (6/16) webinar at 2 pm ET.

Average Level
52.08
| AGG | iShares US Core Bond ETF |
| USO | United States Oil Fund |
| DIA | SPDR Dow Jones Industrial Average ETF |
| DVY | iShares Dow Jones Select Dividend Index ETF |
| DX/Y | NYCE U.S.Dollar Index Spot |
| EFA | iShares MSCI EAFE ETF |
| FXE | Invesco CurrencyShares Euro Trust |
| GLD | SPDR Gold Trust |
| GSG | iShares S&P GSCI Commodity-Indexed Trust |
| HYG | iShares iBoxx $ High Yield Corporate Bond ETF |
| ICF | iShares Cohen & Steers Realty ETF |
| IEF | iShares Barclays 7-10 Yr. Tres. Bond ETF |
| LQD | iShares iBoxx $ Investment Grade Corp. Bond ETF |
| IJH | iShares S&P 400 MidCap Index Fund |
| ONEQ | Fidelity Nasdaq Composite Index Track |
| QQQ | Invesco QQQ Trust |
| RSP | Invesco S&P 500 Equal Weight ETF |
| IWM | iShares Russell 2000 Index ETF |
| SHY | iShares Barclays 1-3 Year Tres. Bond ETF |
| IJR | iShares S&P 600 SmallCap Index Fund |
| SPY | SPDR S&P 500 Index ETF Trust |
| TLT | iShares Barclays 20+ Year Treasury Bond ETF |
| GCC | WisdomTree Continuous Commodity Index Fund |
| VOOG | Vanguard S&P 500 Growth ETF |
| VOOV | Vanguard S&P 500 Value ETF |
| EEM | iShares MSCI Emerging Markets ETF |
| XLG | Invesco S&P 500 Top 50 ETF |
From the Analyst
Loading, Please Wait...
