So far into 2020, the top-performing major market fund covered in this report is the Invesco QQQ Trust [QQQ], which is outperforming the second-best performing fund, the Invesco S&P 500 Top 50 ETF (XLG), over 10.50%! Today, we take a closer look into what is causing this performance dispersion in the two US large-cap funds.
Portfolio View - Major Market ETFs
| Symbol | Name | Price | Yield | PnF Trend | RS Signal | RS Col. | Fund Score | 200 Day MA | Weekly Mom |
|---|---|---|---|---|---|---|---|---|---|
| DIA | SPDR Dow Jones Industrial Average ETF Trust | 242.22 | 2.42 | Negative | X | 3.18 | 263.46 | +6W | |
| EEM | iShares MSCI Emerging Markets ETF | 37.14 | 2.62 | Negative | Sell | O | 1.05 | 40.63 | +6W |
| EFA | iShares MSCI EAFE ETF | 56.60 | 3.80 | Negative | Sell | O | 1.94 | 63.41 | +6W |
| FM | iShares MSCI Frontier 100 ETF | 22.79 | 4.16 | Negative | Sell | O | 0.48 | 27.30 | +6W |
| IJH | iShares S&P MidCap 400 Index Fund | 165.04 | 2.09 | Positive | Buy | O | 0.97 | 185.53 | +6W |
| IJR | iShares S&P SmallCap 600 Index Fund | 61.52 | 1.95 | Negative | Buy | O | 0.58 | 74.27 | +6W |
| QQQ | Invesco QQQ Trust | 226.86 | 0.72 | Positive | Buy | X | 5.40 | 203.28 | +6W |
| RSP | Invesco S&P 500 Equal Weight ETF | 94.92 | 2.33 | Positive | Buy | X | 1.78 | 105.24 | +6W |
| SPY | SPDR S&P 500 ETF Trust | 291.97 | 1.98 | Positive | O | 3.48 | 299.42 | +6W | |
| XLG | Invesco S&P 500 Top 50 ETF | 224.47 | 1.65 | Positive | O | 5.17 | 219.50 | +6W |
Additional Comments:
It was a strong week across the board for the 10 major market funds covered in this report as all finished in positive territory. The leader of the week was the iShares S&P MidCap 400 Index Fund IJH, up 2.98% while the iShares MSCI EAFE ETF EFA lagged the group despite returning 0.95%. So far into 2020, the Invesco QQQ Trust QQQ is up 6.70%, making it the top-performing major market ETF in addition to the only fund in positive territory for the year. In fact, the second-best performing fund in our major market lineup is the Invesco S&P 500 Top 50 ETF XLG which is down -3.82% for the year, trailing the top-performing QQQ by over 10.50%!

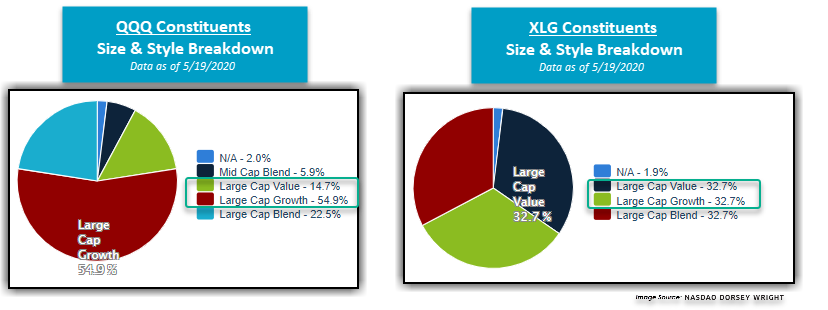
So, what is causing this sizeable dispersion between these top two performing US large-cap funds? As we discussed in yesterday’s ETF Spotlight, so far in 2020 and throughout the COVID-19-induced sell-off and partial recovery, there has been a pronounced size and style bias within the US equity market in favor of large-cap stocks, particularly favoring large-cap growth over large-cap value. This can be seen through the Invesco S&P 500 Pure Growth ETF RPG’s year-to-date return of -4.68%, which is outperforming the Invesco S&P 500 Pure Value ETF RPV’s loss of -36.44% by 31.76% and the S&P 500 ETF Trust SPY’s return of -9.29% by 4.61%. When we take a closer look into the QQQ’s size and style breakdown, we find that it has a 54.9% large-cap growth overweight while 14.7% of the fund is allocated to large-cap value. On the other hand, XLG has a relatively lower large-cap growth weighting of 32.7% and a relatively higher large-cap value weighting of 32.7%, contributing to the fund’s underperformance relative to the tech-heavy QQQ despite holding 16 of the same stocks. QQQ’s superior strength is also reflected in its solid fund score of 5.40, which is outscoring the XLG’s current score of 5.17. Growth-oriented names, especially those focused in larger-capitalization companies, have continued to push the broader domestic equity market higher over the past few weeks, and their technical resilience reinforces their current positioning as market leaders heading towards the end of the first half of 2020. Now more than ever it is important to know what you own and how you own it.