
Most Requested Symbols


| ABC AmerisourceBergen Corporation ($94.03) - Drugs - ABC broke a spread triple top at $93 before moving higher to $95, returning the chart to a buy signal and a positive trend. As a result, this stock is now a 4 for 5’er within the favored drugs sector. From here, initial support is offered at $82. Note ABC offers a yield of 1.79%. |
| BRKS Brooks Automation Inc ($40.15) - Semiconductors - BRKS completed a bullish triangle pattern with a double top break at $41. This stock is a solid 4 for 5’er that ranks in the top quartile of the favored semiconductors sector RS matrix. Today’s break marks the second consecutive buy signal on the chart, confirming that demand is in control. From here, initial support is offered at $37. |
| DXCM Dexcom Inc. ($399.58) - Healthcare - After forming a double top at $424, shares of DXCM fell to give a sell signal with today’s market action, setting the chart up for a potential shakeout pattern. From here, the action point of the shakeout would be triggered with a reversal up into Xs and the shakeout would officially complete with a triple top break at $432. Overall, this stock is a perfect 5 for 5’er that ranks in the top decile of the favored healthcare sector RS matrix. Okay to play the pattern on the reversal or upon completion. |
| EPAY Bottomline Technologies Inc. ($50.88) - Software - EPAY gave a fourth consecutive buy signal on Wednesday with a double top break at $48, and later continued higher to $50. The 4 for 5’er ranks in the top half of the favored software stock sector matrix and demonstrates positive long-term relative strength versus the market, remaining on an RS buy signal since August of 2017. Furthermore, EPAY recently returned to a positive trend on May 7th. The weight of the evidence is positive; however, those looking to initiate new long exposure may best wait for a pullback as the stock is nearing overbought territory. The next level of resistance can be found at $54 while initial support is offered at $40. |
| HOLX Hologic Incorporated ($54.17) - Healthcare - Shares of HOLX broke a triple top at $54 on Wednesday to give a second consecutive buy signal. The 4 for 5’er ranks in the top decile of the favored healthcare stock sector matrix and demonstrates positive long-term relative strength versus the market, remaining on an RS buy signal since January of 2015. In addition, the stock reentered a positive trend on April 30th. The weight of the evidence is positive; however, those looking to initiate new long exposure may consider HOLX on a pullback as the stock is approaching overbought territory at the top of its trading band. The next level of resistance resides at $55, HOLX’s all-time high, while initial support can be found at $50. |
| ISRG Intuitive Surgical, Inc. ($551.02) - Healthcare - ISRG broke a double top at $552 on Wednesday, marking the fourth consecutive buy signal on the chart. This stock is a strong 5 for 5’er within the favored healthcare sector. ISRG has maintained a market RS buy signal since January 2016 and moved into a positive trend back in mid-April. From here, initial support is offered at $504. |
| MGP MGM Growth Properties Limited Liability ($26.43) - Real Estate - MGP broke a triple top at $26 on Wednesday, a move that flipped the trend back to positive for the first time since late February. As a result, this stock is now a 4 for 5’er that ranks in the top quartile of the favored real estate sector. From here, initial support now sits at $21. Note MGP offers a yield of 7.19%. |
| NOW Servicenow Inc ($387.10) - Software - NOW broke a double top at $392 and is now trading at new all-time highs. This recent breakout also marked the fourth consecutive buy signal on the chart, confirming that demand is in control. NOW is a 4 for 5 ‘er that has maintained a market RS buy signal since September 2013. Demand is in control. Note that NOW is nearing overbought territory. From here, initial support sits at $352. |
| ODFL Old Dominion Freight Line, Inc. ($154.92) - Transports/Non Air - ODFL broke a double top at $158 and is now trading at new all-time highs. This stock is a perfect 5 for 5’er that ranks in the top quartile of the transports/non air sector RS matrix. In addition, today’s break marks the third consecutive buy signal, confirming that demand is in control. Monthly momentum just flipped positive, suggesting the potential for higher prices. From here, initial support sits at $146. |
| SPSC SPS Commerce Inc ($61.63) - Software - Shares of SPSC completed a bullish catapult on Wednesday with a double top break at $61, resulting in a fourth consecutive buy signal. The 5 for 5’er ranks in the top third of the favored software stock sector matrix and demonstrates positive long-term relative strength versus the market, remaining on an RS buy signal since August of 2018. Furthermore, SPSC recently reentered a positive trend on April 27th and is actionable from an Overbought/Oversold (OBOS) perspective. The weight of the evidence is positive and those looking to initiate new long exposure may consider SPSC at current levels. The next level of resistance resides at $62, the stock’s all-time high, while initial support is offered at $55. |

Each week the analysts at DWA review and comment on all major asset classes in the global markets. Shown below is the summary or snapshot of the primary technical indicators we follow for multiple areas. Should there be changes mid-week we will certainly bring these to your attention via the report.
| Universe | BP Col & Level (actual) | BP Rev Level | PT Col & Level (actual) | PT Rev Level | HiLo Col & Level (actual) | HiLo Rev Level | 10 Week Col & Level (actual) | 10 Week Rev Level | 30 Week Col & Level (actual) | 30 Week Rev Level |
|---|---|---|---|---|---|---|---|---|---|---|
| ALL |
|
46% |
|
24% |
|
66% |
|
64% |
|
20% |
| NYSE |
|
40% |
|
24% |
|
60% |
|
66% |
|
12% |
| OTC |
|
48% |
|
24% |
|
70% |
|
64% |
|
24% |
| World |
|
50% |
|
24% |
|
|
|
56% |
|
18% |
| Symbol | Name | Price | Yield | PnF Trend | RS Signal | RS Col. | Fund Score | 200 Day MA | Weekly Mom |
|---|---|---|---|---|---|---|---|---|---|
| DIA | SPDR Dow Jones Industrial Average ETF Trust | 242.22 | 2.42 | Negative | X | 3.18 | 263.46 | +6W | |
| EEM | iShares MSCI Emerging Markets ETF | 37.14 | 2.62 | Negative | Sell | O | 1.05 | 40.63 | +6W |
| EFA | iShares MSCI EAFE ETF | 56.60 | 3.80 | Negative | Sell | O | 1.94 | 63.41 | +6W |
| FM | iShares MSCI Frontier 100 ETF | 22.79 | 4.16 | Negative | Sell | O | 0.48 | 27.30 | +6W |
| IJH | iShares S&P MidCap 400 Index Fund | 165.04 | 2.09 | Positive | Buy | O | 0.97 | 185.53 | +6W |
| IJR | iShares S&P SmallCap 600 Index Fund | 61.52 | 1.95 | Negative | Buy | O | 0.58 | 74.27 | +6W |
| QQQ | Invesco QQQ Trust | 226.86 | 0.72 | Positive | Buy | X | 5.40 | 203.28 | +6W |
| RSP | Invesco S&P 500 Equal Weight ETF | 94.92 | 2.33 | Positive | Buy | X | 1.78 | 105.24 | +6W |
| SPY | SPDR S&P 500 ETF Trust | 291.97 | 1.98 | Positive | O | 3.48 | 299.42 | +6W | |
| XLG | Invesco S&P 500 Top 50 ETF | 224.47 | 1.65 | Positive | O | 5.17 | 219.50 | +6W |
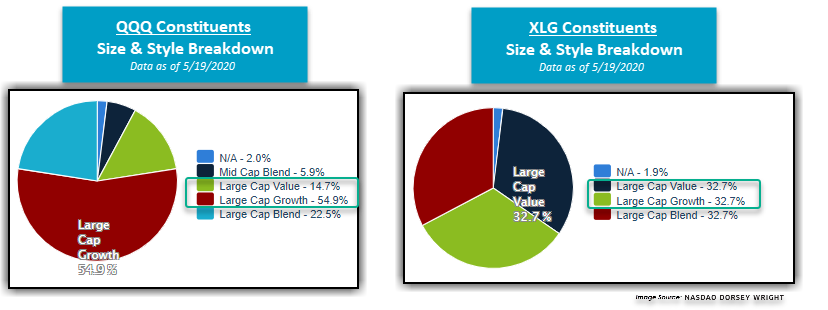
It was a strong week across the board for the 10 major market funds covered in this report as all finished in positive territory. The leader of the week was the iShares S&P MidCap 400 Index Fund IJH, up 2.98% while the iShares MSCI EAFE ETF EFA lagged the group despite returning 0.95%. So far into 2020, the Invesco QQQ Trust QQQ is up 6.70%, making it the top-performing major market ETF in addition to the only fund in positive territory for the year. In fact, the second-best performing fund in our major market lineup is the Invesco S&P 500 Top 50 ETF XLG which is down -3.82% for the year, trailing the top-performing QQQ by over 10.50%!

So, what is causing this sizeable dispersion between these top two performing US large-cap funds? As we discussed in yesterday’s ETF Spotlight, so far in 2020 and throughout the COVID-19-induced sell-off and partial recovery, there has been a pronounced size and style bias within the US equity market in favor of large-cap stocks, particularly favoring large-cap growth over large-cap value. This can be seen through the Invesco S&P 500 Pure Growth ETF RPG’s year-to-date return of -4.68%, which is outperforming the Invesco S&P 500 Pure Value ETF RPV’s loss of -36.44% by 31.76% and the S&P 500 ETF Trust SPY’s return of -9.29% by 4.61%. When we take a closer look into the QQQ’s size and style breakdown, we find that it has a 54.9% large-cap growth overweight while 14.7% of the fund is allocated to large-cap value. On the other hand, XLG has a relatively lower large-cap growth weighting of 32.7% and a relatively higher large-cap value weighting of 32.7%, contributing to the fund’s underperformance relative to the tech-heavy QQQ despite holding 16 of the same stocks. QQQ’s superior strength is also reflected in its solid fund score of 5.40, which is outscoring the XLG’s current score of 5.17. Growth-oriented names, especially those focused in larger-capitalization companies, have continued to push the broader domestic equity market higher over the past few weeks, and their technical resilience reinforces their current positioning as market leaders heading towards the end of the first half of 2020. Now more than ever it is important to know what you own and how you own it.

SECTOR BULLISH PERCENT CHANGES
| Reversed to X | Reversed to O |
|---|---|
| 10 (BPAERO | 32), (BPBUIL | 48), (BPFORE | 36), (BPHEAL | 48), (BPINSU | 30), (BPLEIS | 56), (BPMACH | 42), (BPREST | 42), (BPTEXT | 38), (BPWAST | 34), |
9 (BPCOMP | 38), (BPELEC | 42), (BPFINA | 36), (BPINET | 54), (BPMETA | 42), (BPOIL | 34), (BPOILS | 36), (BPPROT | 36), (BPSOFT | 58), |
| To Xs | To Os |
|---|---|
| Electronics ( 0.78 to 48 ) | None |
| Utilities / Gas ( 0.47 to 40 ) | None |
| Transports / Non Air ( 0.69 to 44 ) | None |
Average Level
44.17
| Sector |
|---|
| Savings & Loans (20%) - Bear Confirmed |
| Sector |
|---|
| Aerospace Airline (32%) - Bull Alert |
| Building (48%) - Bull Confirmed |
| Chemicals (46%) - Bear Correction |
| Drugs (50%) - Bull Alert |
| Forest Prods/Paper (36%) - Bull Alert |
| Healthcare (48%) - Bull Confirmed |
| Insurance (30%) - Bull Alert |
| Machinery and Tools (42%) - Bear Correction |
| Media (44%) - Bull Confirmed |
| Restaurants (42%) - Bear Correction |
| Retailing (46%) - Bull Confirmed |
| Steel/Iron (32%) - Bull Alert |
| Textiles / Apparel (38%) - Bull Alert |
| Waste Management (34%) - Bull Alert |
| Sector |
|---|
| Internet (54%) - Bull Correction |
| Semiconductors (58%) - Bear Alert |
| Software (58%) - Bull Correction |
| Wall Street (50%) - Bull Correction |
SECTOR INDICATOR CHART CHANGES
PT is the percentage of stocks within a sector that are trading above their bullish support lines. RSX is the percentage of stocks within a sector whose relative strength charts are in a column of Xs. RSP is the percentage of stocks within a sector whose relative strength charts are on a buy signal. The strongest sectors, i.e. market leaders, will have most of these indicators positive and moving higher in a column of Xs.
|
There were mostly falling sector PT charts this week, with 9 falling and 7 rising. The following sector charts rose: Building [^PTBUIL], Finance [^PTFINA], Gaming [^PTGAME], Leisure [^PTLEIS], Media [^PTMEDI], Precious Metals [^PTPREC], Textiles/Apparel [^PTTEXT]. The following sector charts fell: Banks [^PTBANK]-Rev. , Forest Prods/Paper [^PTFORE]-Rev. , Insurance [^PTINSU]-Rev. , Machinery and Tools [^PTMACH]-Rev. , Protection Safety Equipment [^PTPROT]-Rev. , Savings & Loans [^PTSAVI]-Rev. , Steel/Iron [^PTSTEE]-Rev. , Transports/Non Air [^PTTRAN]-Rev. , Waste Management [^PTWAST]-Rev. . There were 9 that reversed to O. |
|
| ^PT Charts Reversing Up - | ^PT Charts Reversing Down - |
|
|
|
| ^PT Charts Moving Higher - | ^PT Charts Moving Lower - |
|
|
|
|
There were mostly falling sector RSX charts this week, with 22 falling and 3 rising. The following sector charts rose: Biomedics/Genetics [^RSXBIOM], Precious Metals [^RSXPREC], Waste Management [^RSXWAST]-Rev. . The following sector charts fell: Aerospace Airline [^RSXAERO], Autos and Parts [^RSXAUTO]-Rev. , Business Products [^RSXBUSI], Computers [^RSXCOMP]-Rev. , Utilities/Electricity [^RSXEUTI], Forest Prods/Paper [^RSXFORE]-Rev. , Gaming [^RSXGAME], Gas Utilities [^RSXGUTI], Healthcare [^RSXHEAL]-Rev. , Insurance [^RSXINSU], Leisure [^RSXLEIS], Machinery and Tools [^RSXMACH], Metals Non Ferrous [^RSXMETA]-Rev. , Oil [^RSXOIL]-Rev. , Oil Service [^RSXOILS], Protection Safety Equipment [^RSXPROT], Real Estate [^RSXREAL], Restaurants [^RSXREST], Retailing [^RSXRETA], Telephone [^RSXTELE], Textiles/Apparel [^RSXTEXT]-Rev. , Transports/Non Air [^RSXTRAN]. Transports/Non Air [^RSXTRAN] was the only sector RSX chart that moved to a sell signal, while none moved to a buy signal. |
|
| ^RSX Charts Reversing Up - | ^RSX Charts Reversing Down - |
|
|
| ^RSX Charts Moving Higher - | ^RSX Charts Moving Lower - |
|
|
|
There were mostly RSP charts rising this week, with 18 rising and 2 moving lower. The following sector charts rose: Biomedics/Genetics [^RSPBIOM], Building [^RSPBUIL], Chemicals [^RSPCHEM], Computers [^RSPCOMP], Drugs [^RSPDRUG], Electronics [^RSPELEC], Utilities/Electricity [^RSPEUTI], Finance [^RSPFINA]-Rev. , Gaming [^RSPGAME], Healthcare [^RSPHEAL], Internet [^RSPINET], Leisure [^RSPLEIS], Metals Non Ferrous [^RSPMETA], Oil [^RSPOIL], Oil Service [^RSPOILS], Precious Metals [^RSPPREC], Software [^RSPSOFT], Telephone [^RSPTELE]. The following sector charts fell: Banks [^RSPBANK], Savings & Loans [^RSPSAVI]. There were 1 that reversed to X. |
|
| ^RSP Charts Reversing Up - | ^RSP Charts Reversing Down - |
|
|
| ^RSP Charts Moving Higher - | ^RSP Charts Moving Lower - |
|
|
FAVORED SECTOR STATUS CHANGES
A sector is considered to be Favored if it has 3 or 4 of the sector indicators (Relative Strength, RSX, RSP, & PT) positive, Average if it has 2 of the 4 indicators positive, & Unfavored if it has 0 or 1 of the indicators positive. The table below contains those sectors that have experienced a Favored Sector Status change over the past week. It is best to focus on sectors that are about 50% or lower on their Bullish Percent charts & are in Xs. Note: If a sector moves from Favored to Average, it doesn't necessarily mean that the sector in question has to be sold - it just means you need to evaluate your individual positions with exposure to that sector.
| Changes since 05/13/2020 | Full Report |
|
|
|
|
||||||||||||
|
|
|
|
|
|
||||||||||
|
|
|
|
|
|
||||||||||
|
|
|
|
|
|
||||||||||
Remember, these are technical comments only. Just as you must be aware of fundamental data for the stocks we recommend based on technical criteria in the report, so too must you be aware of important data regarding delivery, market-moving government releases, and other factors that may influence commodity pricing. We try to limit our technical comments to the most actively traded contracts in advance of delivery, but some contracts trade actively right up to delivery while others taper off well in advance. Be sure you check your dates before trading these contracts. For questions regarding this section or additional coverage of commodities email james.west@dorseywright.com.
Data represented in the table below is through 05/19/2020:
Broad Market Commodities Report
| Symbol | Name | Price | PnF Trend | RS Signal | RS Col. | 200 Day MA | Weekly Mom |
|---|---|---|---|---|---|---|---|
| CL/ | Crude Oil Continuous | 32.50 | Negative | Buy | X | 47.38 | +4W |
| DBLCIX | Deutsche Bank Liquid Commodities Index | 239.98 | Negative | Sell | O | 294.56 | +6W |
| DWACOMMOD | DWA Continuous Commodity Index | 443.43 | Negative | Buy | O | 460.73 | +5W |
| GC/ | Gold Continuous | 1749.00 | Positive | Buy | X | 1562.38 | -2W |
| HG/ | Copper Continuous | 2.42 | Negative | Buy | O | 2.56 | +5W |
| ZG/ | Corn (Electronic Day Session) Continuous | 321.25 | Negative | Buy | O | 365.78 | +3W |
While Gold Continuous GC/ has certainly captured the attention of commodity investors by returning 15.04% on a year-to-date basis and 36.89% over the past year, sister precious metal Silver Continuous SI/ has been making moves of its own over the past few weeks. In fact, silver investors have experienced massive gains of 44.22% in the past 60 days relative to gold’s 17.24% during the same period. Despite this notable rally, SI/ remains in the red on the year (as of 5/19) with a -0.10% loss. The 1-year return for silver is a more-respectable 19.60%, which is widely divergent from the broader commodity group’s return of -12.30% using the proxy of the WidomTree Continuous Commodity Index Fund GCC.
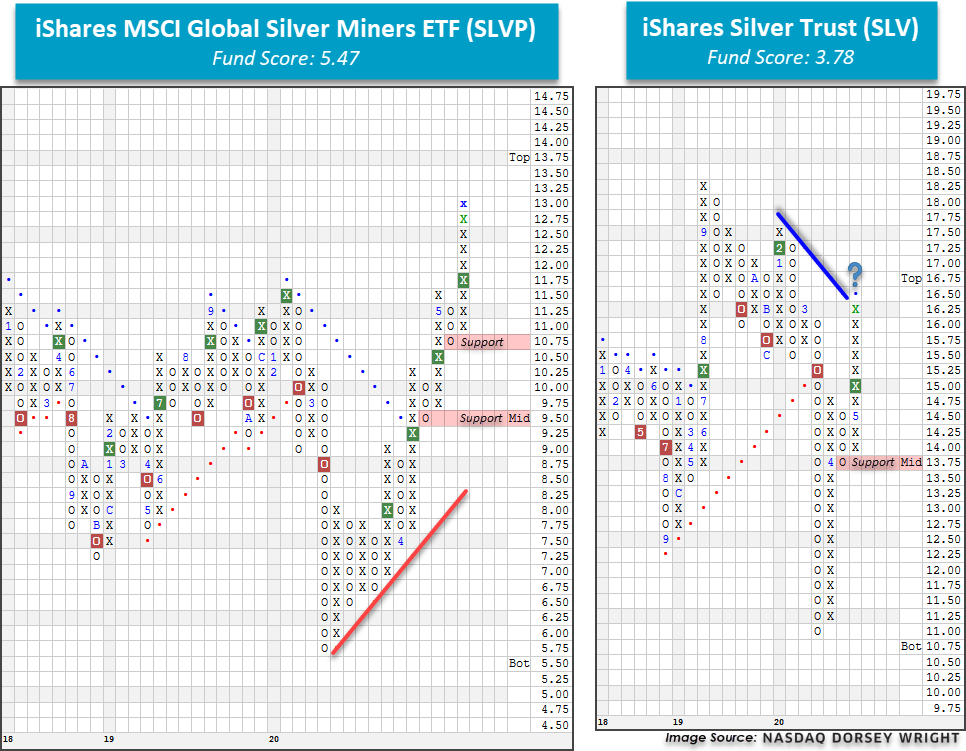
One way to capitalize on silver’s recent shine is by using the iShares Silver Trust SLV. The ETF seeks to track the day-to-day movement of the price of silver bullion and provides a liquid way to access the commodity’s exposure outside of the futures market. After declining significantly to move to a negative trend and multi-year low of $11 during the month of March, SLV has since rallied sharply to return to a buy signal and is currently testing its bearish resistance line at $16.25. This absolute improvement coupled with the relative outperformance of the underlying commodity has also helped propel SLV’s fund score to 3.78 on the back of a strong positive score direction of 1.77. Additionally, SLV’s 1-year performance of 19.60% places it in the top 4th performance percentile of all mutual funds and ETFs tracked on the Nasdaq Dorsey Wright platform. A further advance to $16.50 would reverse the trend for the fund and offer additional bullish confirmation. Note that SLV is heavily overbought at current levels and has the potential for initial support at $13.75.
An alternative way to mine the success of silver is by investing in the companies that extract the commodity from the ground. The iShares MSCI Global Silver Miners ETF SLVP provides such exposure and is trading in a positive trend on a fourth consecutive buy signal at a freshly-minted 52-week high of $13. This positive technical strength has resulted in a gain of 13.89% on the year, which has contributed to SLVP’s stellar fund score of 5.47 with an astonishingly-positive score direction of 5.00. Additionally, SLVP has recently experienced a flip to positive monthly momentum, suggesting the potential for further gains. Similar to SLV, the fund’s recent success has placed it in heavily overbought territory. Those seeking long exposure may be well served to wait for a pause or pullback noting that initial support is offered at $10.75. SLPV comes with a yield of 1.78%.

Average Level
17.85
| AGG | iShares US Core Bond ETF |
| USO | United States Oil Fund |
| DIA | SPDR Dow Jones Industrial Average ETF |
| DVY | iShares Dow Jones Select Dividend Index ETF |
| DX/Y | NYCE U.S.Dollar Index Spot |
| EFA | iShares MSCI EAFE ETF |
| FXE | Invesco CurrencyShares Euro Trust |
| GLD | SPDR Gold Trust |
| GSG | iShares S&P GSCI Commodity-Indexed Trust |
| HYG | iShares iBoxx $ High Yield Corporate Bond ETF |
| ICF | iShares Cohen & Steers Realty ETF |
| IEF | iShares Barclays 7-10 Yr. Tres. Bond ETF |
| LQD | iShares iBoxx $ Investment Grade Corp. Bond ETF |
| IJH | iShares S&P 400 MidCap Index Fund |
| ONEQ | Fidelity Nasdaq Composite Index Track |
| QQQ | Invesco QQQ Trust |
| RSP | Invesco S&P 500 Equal Weight ETF |
| IWM | iShares Russell 2000 Index ETF |
| SHY | iShares Barclays 1-3 Year Tres. Bond ETF |
| IJR | iShares S&P 600 SmallCap Index Fund |
| SPY | SPDR S&P 500 Index ETF Trust |
| TLT | iShares Barclays 20+ Year Treasury Bond ETF |
| GCC | WisdomTree Continuous Commodity Index Fund |
| VOOG | Vanguard S&P 500 Growth ETF |
| VOOV | Vanguard S&P 500 Value ETF |
| EEM | iShares MSCI Emerging Markets ETF |
| XLG | Invesco S&P 500 Top 50 ETF |
From the Analyst
Loading, Please Wait...
