Thus far in 2020 and throughout the COVID-19-induced sell-off and partial recovery, there has been a pronounced size and style bias within the US equity market in favor of growth over value and large-cap over small-cap.
Thus far in 2020 and throughout the COVID-19-induced sell-off and partial recovery, there has been a pronounced size and style bias within the US equity market in favor of growth over value and large-cap over small-cap. Large-cap growth sits atop the DALI size and style rankings, as it has for more than a year, with that relative strength advantage having been clearly demonstrated through the performance dispersion this year.
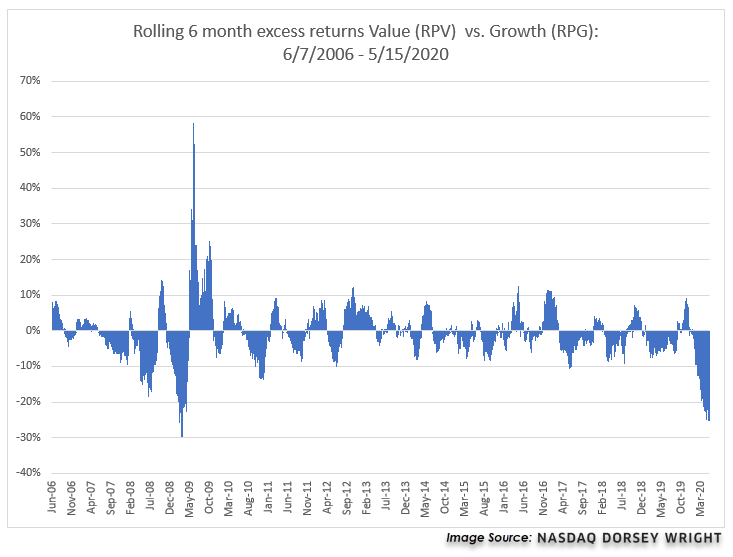
Year-to-date (through 5/18), the Invesco S&P 500 Pure Growth ETF RPG has generated a price return of -4.35%, putting it ahead of the S&P 500 SPX by just over 4.2%, as the index has returned -8.57%. Meanwhile, the S&P 500 Pure Value ETF RPV has produced a return of -35.01% over the same period, a whopping differential of almost 31%. Dispersion at this level is something one might expect to see between the best- and worst-performing individual stocks in the S&P 500, but not between two style funds derived from the same index, each of which contains more than 100 holdings. On average since 2009, RPV and RPG have had a performance differential of 4.39% in any given calendar year. In 2016 RPV returned 17.05% while RPG returned 3.56%, making it the only year during this time that produced a performance difference in the double digits. So needless to say, the disparity we've seen this year is not typical. One way to view this relationship is through a rolling six-month return comparison of RPV against RPG from mid-2006 through last Friday (5/15). This picture represents how the relationship between these two funds typically rotates in favorability, with RPV being favored in certain times and RPG favored in others. When viewing the historical comparison we see that there has not been this level of dispersion favoring RPG since the early-2009 timeframe.

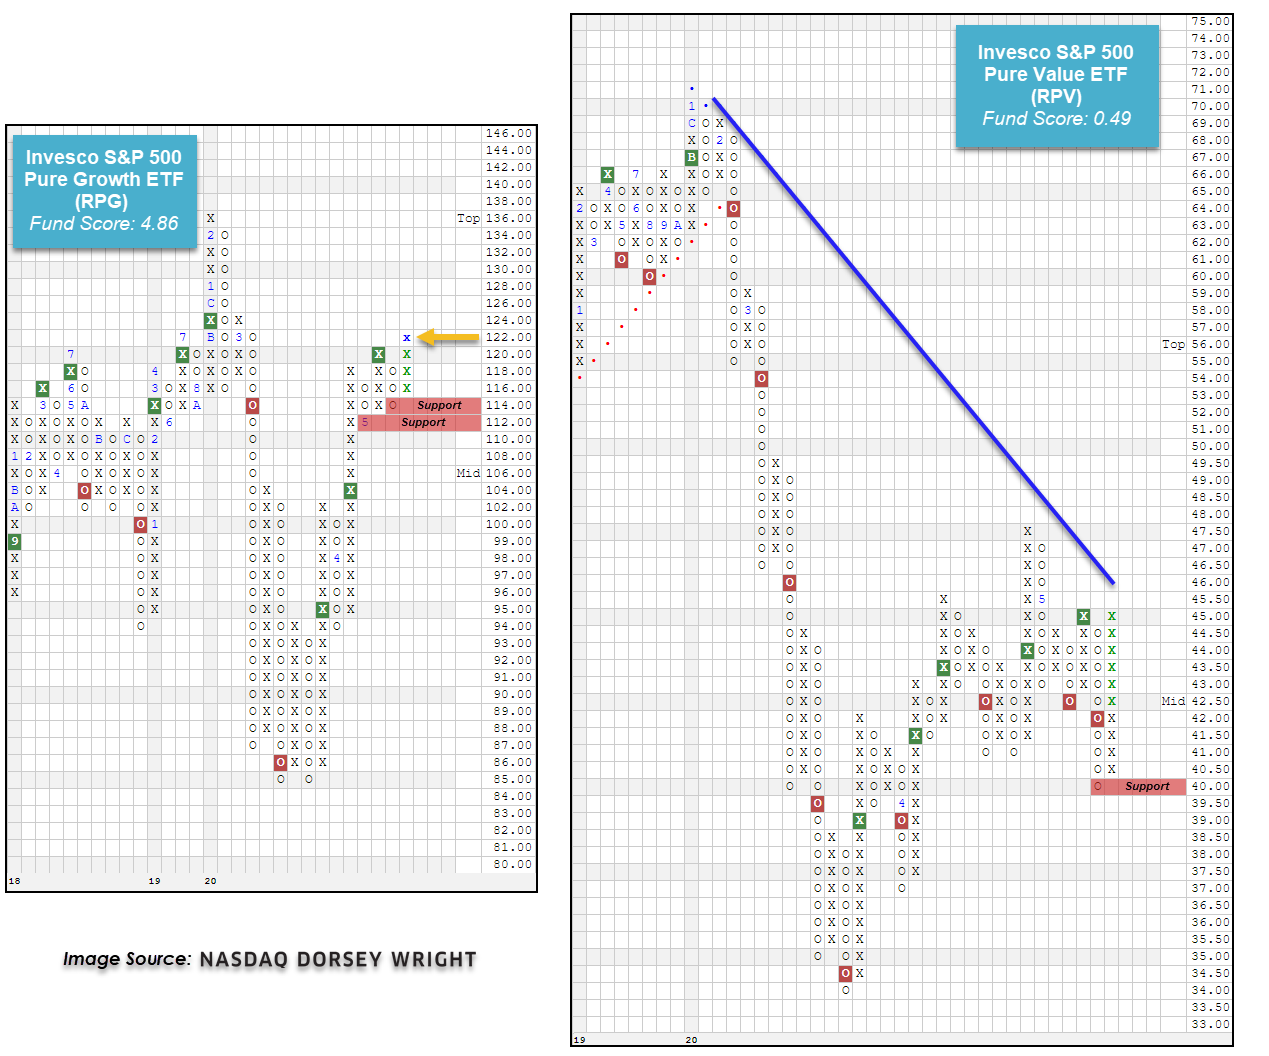
The stark contrast between growth and value is also readily apparent when we look at the technical pictures of RPG and RPV. RPG currently has a robust 4.86 fund score and a positive 1.15 fund score direction. After bottoming at $85 on its default chart in March RPG has rebounded to give three consecutive buy signals, and with movement on Tuesday broke out to give a fourth consecutive buy signal at $121. Throughout the volatility of 2020 RPG has maintained its positive trend, which has been intact since 2015. RPV, by comparison, has a dismal 0.49 fund score and -3.70 score direction. On its default chart, RPV is currently on a sell signal after breaking a triple bottom in last week's trading. While the fund has rebounded from its March low, it has largely traded sideways in April and May and remains in a negative overall trend after violating its bullish support line in February.

The dispersion between growth and value has not been limited to large-cap – the iShares Russell 2000 Growth ETF IWO has posted a year-to-date return of -10.22%, which while weaker than its large-cap counterpart, is significantly better than that of the iShares Russell 2000 Value ETF IWN which is down -25.18%.
As mentioned at the onset, the second major size & style trend in the US equity market has been the dominance of large over small, which is evident in the relative performance of the S&P 500 SPX and the Russell 2000 RUT as RUT's year-to-date return of -20.07% lags the S&P's by 11.5%. What is less-readily apparent is that this size bias exists not only across, but within capitalization categories. While SPX is down -8.57% year-to-date, the S&P Equal Weighted Index SPXEWI is down nearly twice as much at -16.72%. Further illustrating this phenomenon, the Invesco S&P 500 Top 50 ETF XLG, which holds the 50 largest companies in the S&P 500, has returned -3.08%, besting SPX by more than 5%. So, while demand for large-cap stocks has held up better than demand for small caps, it has been mega-cap stocks that investors have favored most.
We can also see this relationship on the Asset Class Group Scores (ACGS) page by viewing the US style breakdown of the relative rankings, which displays large-, mid-, and small-cap split off into growth, blend, and value groupings. Even though the group scores of these areas have certainly changed with the recent market turbulence, the relative ranking of the groups has remained largely the same. Growth continues to best value across each of the three size classifications, with perhaps the most notable dispersion coming from US large cap growth over US large cap value. Using a historical score history graph comparison, we can see that the current 4.29 average score for large-cap growth significantly outpaces the 2.49 average score for large-cap value. This actually marks the largest differential between the two groups throughout the history of the ACGS tool, which dates back to the end of 2003. While such a large dispersion does bring about the contrarian mindset of a potential mean reversion event, we have not seen any action begin to occur within the underlying technical pictures of these two areas. Growth-oriented names, and especially those focused in larger-capitalization companies, have continued to push the broader domestic equity market higher over the past few weeks, and their technical resilience reinforces their current positioning as market leaders heading towards the end of the first half of 2020.

