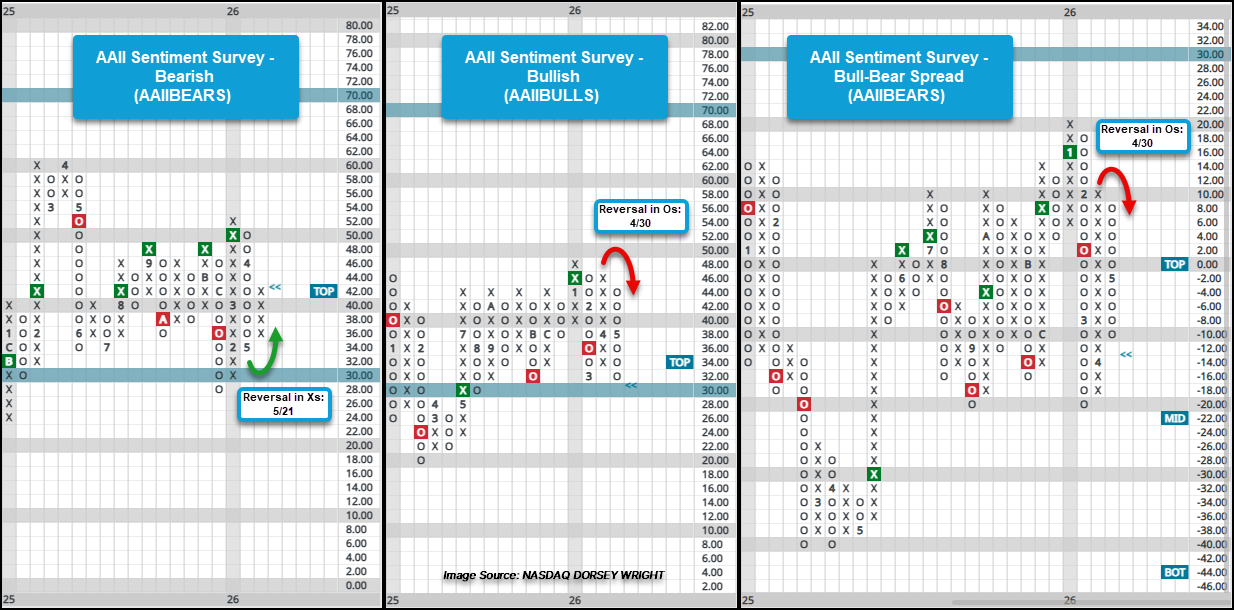
Prior to U.S. equity indices capping off with rallies to new highs, investor sentiment indicators witnessed notable action with bearish sentiment increasing and bullish sentiment dropping.
Last week’s action capped off with U.S. equity indices rallying to or near recent all-time highs. Prior to that, earlier in the week though, investor sentiment indicators witnessed notable action with bearish sentiment increasing and bullish sentiment dropping.
The investment sentiment indicators discussed plot the weekly American Association of Individual Investors (AAII) Sentiment Survey data on a point and figure chart and can be found by going to the Securities tab and selecting Chart Lists. Once on the Chart Lists page, click on Economic Indicator Charts under the Special Reports section on the lower left of the list box located on the left-hand side of the page. For those not familiar with the AAII Sentiment Survey, it offers insight into individual investor sentiment and simply asks whether investors think the market is heading within the next six months. The survey is taken weekly, updated on Thursdays, and these indicator charts – along with the longer-term 4-week averages – can be found near the top of the list of economic indicators.
Following last week’s survey, the bearish sentiment camp increased to 43% from 36% the prior week, leading the AAII Sentiment Survey – Bearish (^AAIIBEARS) chart to reverse back into a column of Xs after having been in a column of Os since early April. The Bullish (^AAIBULL) reversed down into Os in late April, but this week’s action brought bullish sentiment down to 31% and the chart down to its lowest level since March. Consequently, the Bull-Bear Spread (^AAIISPREAD) reached double digits in favor of the bears camp for the first time since early April.
While bearish sentiment hasn’t quite reached the 50% levels seen since late March, bullish sentiment has fallen to its lowest since that time. The neutral camp still remains below the 30% mark on the chart that has been somewhat of a line in the sand since early 2025.
Over the weekend, geopolitical tensions within the middle east have shifted further towards a peace settlement. Given these developments and the tensions being the primary driver of near-term action in the recent months, it will be worth monitoring whether sentiment sees an uptick in bullish sentiment and decrease in bearish sentiment or if last week’s divergence in sentiment continues.