
The dollar has widespread implications for global markets, and when the greenback does move, its trends often last for a while, making its recent move extremely notable.
The dollar (DX/Y]) has widespread implications for global markets, and when the greenback does move, its trends often last for a while, making it worth monitoring for most serious investors. However, recent action has been an exception to the currency’s usual consistency. After completing its fifth consecutive sell signal, the dollar reversed higher, breaking a double top at $100.50 as the market experienced a flight to safety. Since then, tensions in Iran have subsided, leaving the greenback to move lower and return to a sell signal. The dollar has now repeatedly tested resistance in the $100 to $101.50 range, only to reverse lower each time over the last year. Interestingly, the dollar saw extremely consistent support around the $101 to $100 level during 2023 and 2024, which appears to now be serving as resistance as well. If the dollar is truly going to turn a new corner and rebound, it will have to push through significant resistance around those levels. Meanwhile, the currency is without support until $96, leaving the path of least resistance to the downside for the time being. That said, the dollar would also initiate a shakeout pattern if it reversed back into Xs.

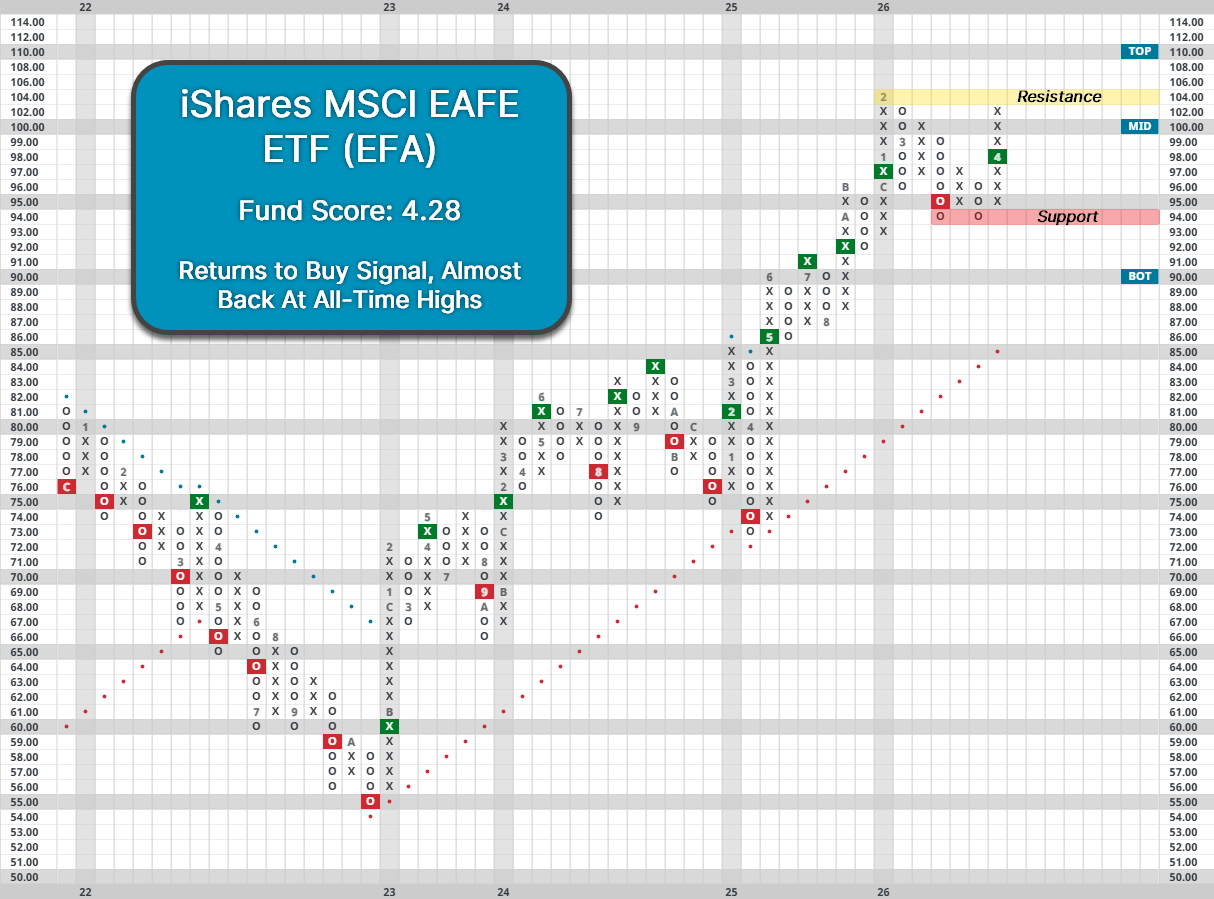
A decline in the dollar makes international equities and commodities worth more when converted into US dollars, so a falling dollar environment is relatively beneficial for the two asset classes. Conversely, a rising dollar serves as a headwind for international stocks and commodities, making domestic equities relatively more attractive in dollar terms. With the dollar back on the decline, international equities could continue to benefit, with the most international indices already reversing higher. The iShares MSCI EAFE ETF (EFA) previously moved to its first sell signal since last April, falling into correction territory. However, recent action has seen EFA move back to a buy signal while it’s one box away from matching previous all-time highs. EFA holds a solid fund score of 4.28, but that still lags 0.19 points behind the average fund score of the US Core Equity (S&P 500 Index funds) group.
Within international equities, emerging markets continue to demonstrate more relative strength than developed regions. The group saw even more downside than developed markets during the peak of the Iran conflict. The iShares MSCI Emerging Markets ETF (EEM) fell as much as 13.5%, entering correction territory as well. However, the group never moved to a sell signal and has since reversed sharply higher into a column of Xs. While developed markets have put on a solid performance over the last year and a half, it’s been emerging markets that have stolen the spotlight. EEM has gained 46% since the start of 2025, compared to 36% for EFA over that same period. Overall, emerging markets are a higher relative strength area, with EEM holding an extremely strong fund score of 5.47, which is a full point higher than the US Core Equity group.

With the global economy holding up while the dollar falls, international equities could put together a strong finish to 2026, especially if global conflict is resolved. The group continues to sit at the top of DALI ahead of domestic equities. Meanwhile, emerging markets should be a point of emphasis within its broader asset class given its relative strength.
