
While the equal-weight has a good year, the cap-weight is roaring back with a vengeance.
This year, despite the volatility, equal-weight market representatives have done well relative to their cap-weight counterparts. Since 2022, the S&P 500 Index (SPX) has been on an unrelenting onslaught over the S&P Equal Weighted Index (SPXEWI). Entering the year, SPX had outperformed SPXEWI by more than 40% over the last three years, a feat that was last done in the late 1990s. This three-year performance spread has fallen to just under 30% in April, which is still historically elevated. However, our data set is confined to the early 90s through today, a small sample size to make any assumptions about the mean reversion tendencies of the rolling three-year performance spread between SPX and SPXEWI. While we did see eventual market leadership from SPXEWI during the aughts after SPX first outperformed SPXEWI over a three-year period ending in early 1999, it still took over a year before cap-weight dominance truly subsided. It is certainly not out of the question that the recent outperformance from SPXEWI over SPX is a brief break in a long-term trend of relative strength for SPX.

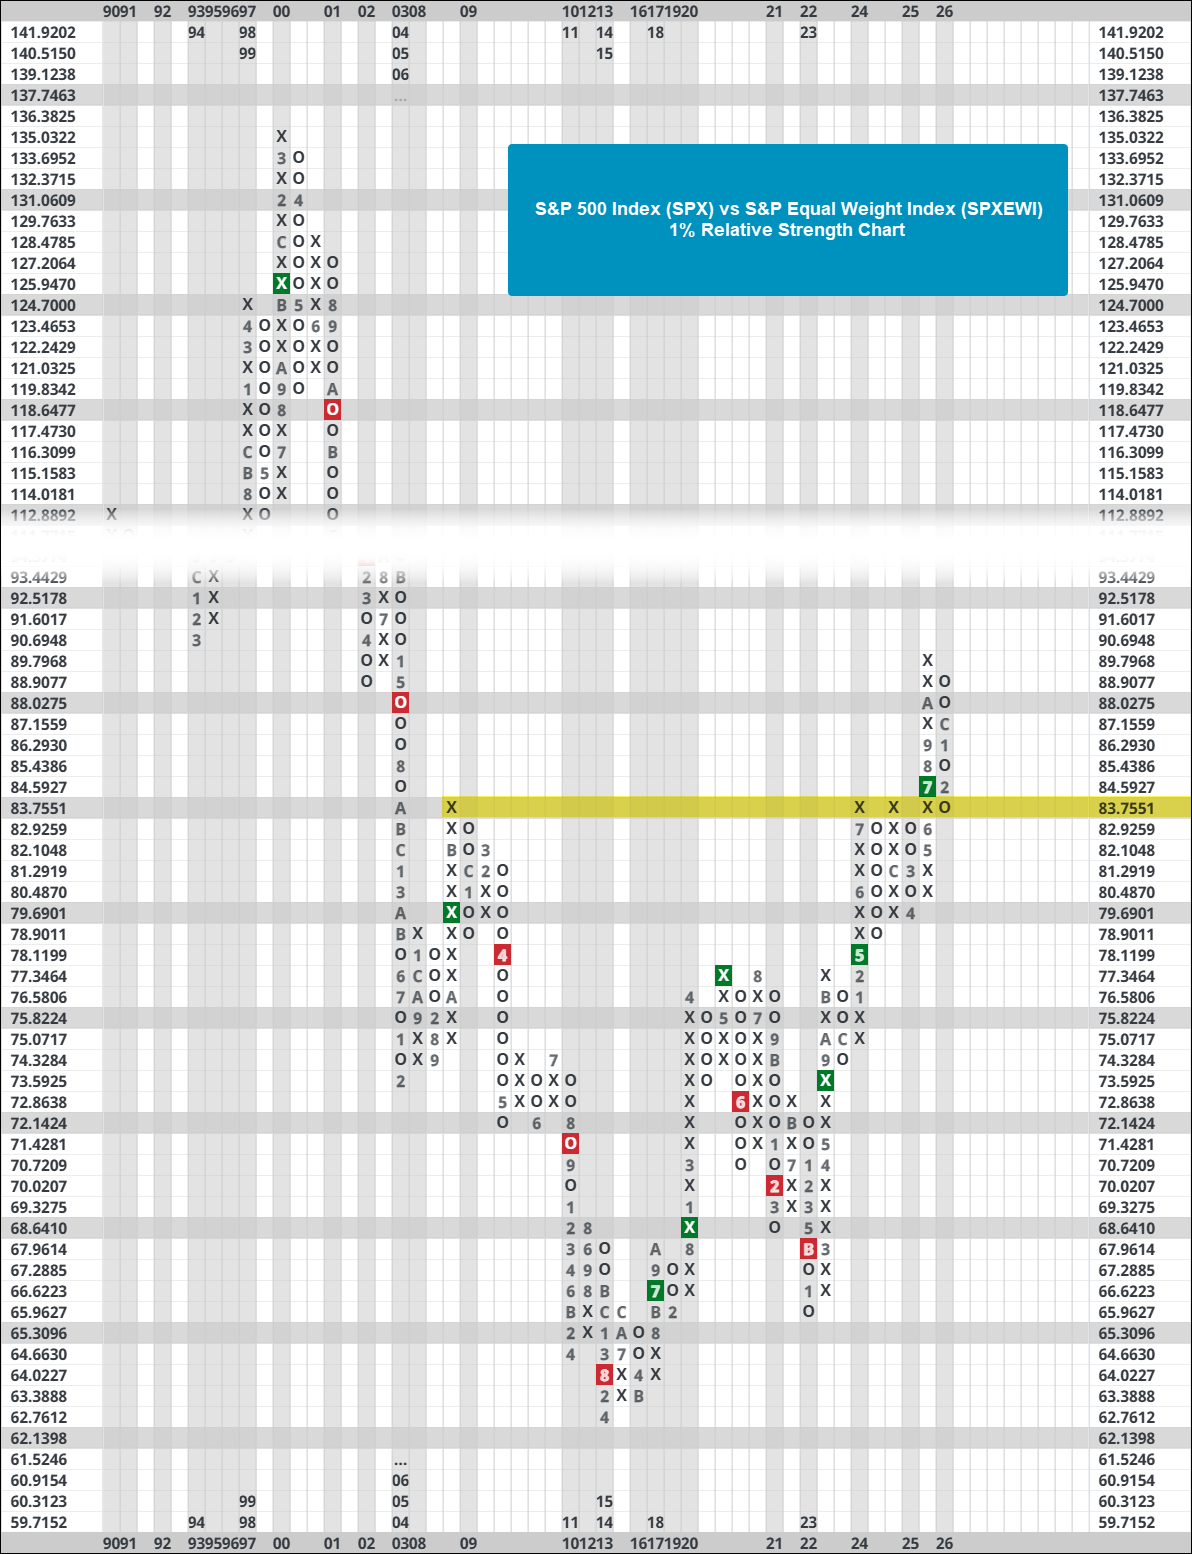
There is plenty of supporting evidence that the recent strength in equal-weight has yet to challenge cap-weight. On the SPX vs SPXEWI 1% relative strength chart, it still trades on a buy signal, which favors SPX on a long-term basis. The relative strength chart is in a column of Os, but the SPX only needs to outperform the SPXEWI by 1% from current levels to reverse back into Xs. If that were to happen, the cap-weight would be back in the driver’s seat on both long-term and short-term time frames. Interestingly, the reversal into Os brought the RS chart back to a prior area of resistance that is seemingly acting as new support. While we don’t necessarily view support and resistance the same way for trend charts compared to relative strength charts, it’s not something to write off completely for RS charts. Another important note on the RS chart is that it is still over 60% off its March 2000 high. As mentioned earlier, we’re looking at a small sample size of total market history. Nonetheless, be aware that the trend of cap-weight strength has and can continue to march on.
Looking at a more focused picture of the largest market-cap stocks, the iShares Top 20 U.S. Stocks ETF (TOPT) initiated a shakeout pattern last week and is just a few boxes away from completing the pattern. For those unfamiliar with the shakeout pattern, it is a chart pattern where a security in a positive trend forms a double top at a high, then reverses to give a sell signal (shaking out the weak holders), and then resumes the uptrend with a fresh buy signal upon a break of the double top. Second, TOPT still has an acceptable fund score of 3.41 after falling from near-perfect status at the end of last year. TOPT is a newer fund that launched near the end of 2024 and could be a good representative to watch for emerging weakness or strength in the largest stocks in the market. Overall, it is still technically sound, as is SPX over SPXEWI on a long-term relative strength basis. While we have seen equal weight representatives pick up in 2026, they still have a long way to go before dismantling cap-weight from the top spot.

