
The near‑term positive action for equities has led to improvements in short‑term indicators after deteriorating to their lowest levels in roughly 12 months.
NDW is pleased to present our “Weight of the Evidence” heading into the second quarter of 2026. The document, approved for financial professionals and non-professionals alike, details key technical changes markets brought our way during the first quarter. Click here to download the report.
Trading from last week’s action into Monday has seen major U.S. equity indices move back into positive territory, ending streaks of negative weekly performance that began in the latter half of February. The Nasdaq‑100 (NDX) and Nasdaq Composite (NASD) have led the charge, each up 4.5% since 3/27, while the S&P 500 Index (SPX) has gained 3.82%.
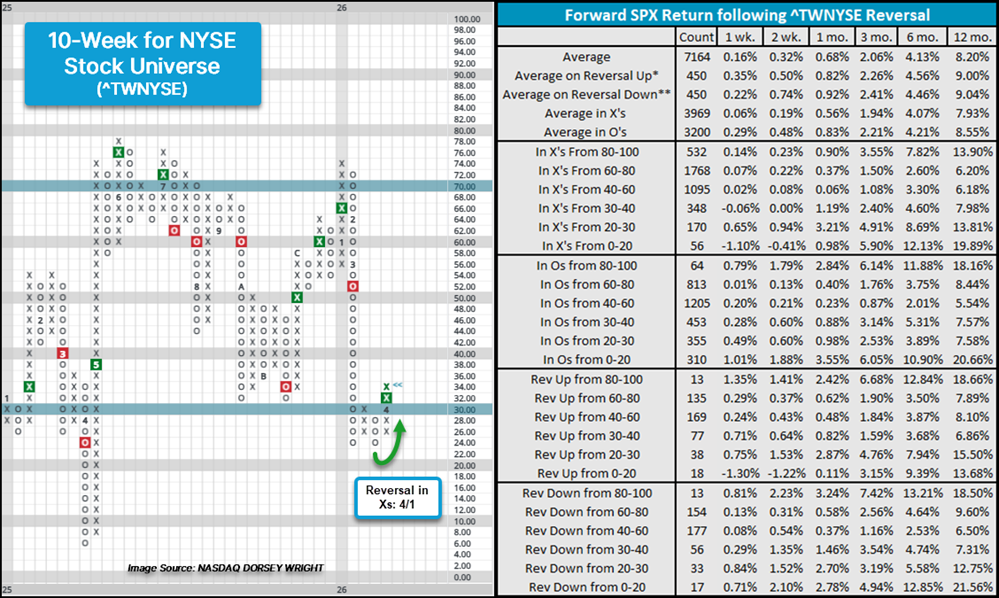
The near‑term positive action for equities has led to improvements in short‑term indicators after deteriorating to their lowest levels in roughly 12 months in most cases. Along with weekly momentum indicators—which measure the percentage of stocks maintaining positive weekly momentum (short‑term 1‑week MA above the 5‑week MA)—10‑week indicators have returned to Xs on their charts or found near‑term consolidation and shifted back to bull alert or bull confirmed status. Perhaps the most notable 10‑week indicator to return to bull confirmed status is the 10‑week for the NYSE universe (^TWNYSE), which consolidated during the final weeks of March and returned to bull confirmed status to kick off April.
The recent reversals for ^TWNYSE occur within one of the better‑performing buckets for forward returns, lagging only when the indicator falls to extreme lows (<20%) before rising to elevated territory (>80%). From here, investors will monitor whether the indicator can continue to improve—climbing to 50% or higher—or if the recent move proves to be a head fake before challenging lower, washed‑out levels (<20%) last visited 12 months ago.
In addition to the NYSE 10‑week indicator’s positive developments, the 10‑week indicators for broader market universes—All Stock (^10ALL), OTC Stocks (^TWOTC), Optionable (^TWOPTI), and World (^TWWORLD)—also reversed higher, moving above 30% after falling into the 20%–30% range.

While not all NDW 40 sectors experienced deterioration to washed‑out levels, a majority saw similar drawdowns into the 20%–30% range before rebounding. A handful—precious metals (^TWPREC), machinery and tools (^TWMACH), real estate (^TWREAL), autos and parts (^TWAUTO), and software (^TWSOFT)—fell below 20% and have since reversed higher.
As with the broader NYSE 10‑week indicator, investors will watch which sectors continue to build on these positive developments and whether the distribution curve begins to normalize from its current slight left skew.

