
Reviewing factor performance for Q1 2026
US Equity Smart Beta
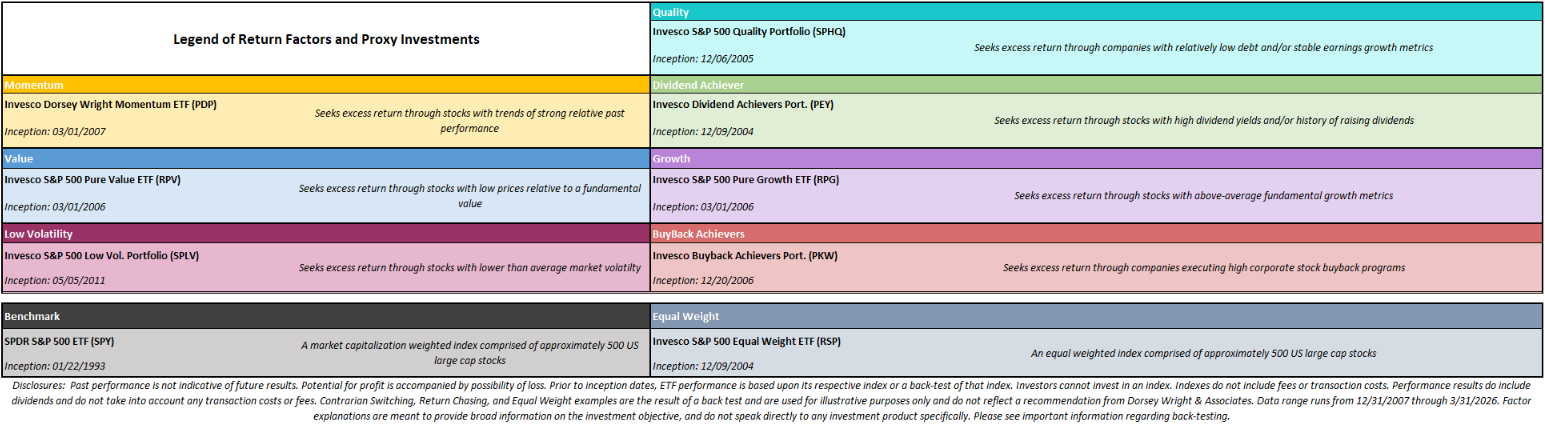
Other factors commonly accessible through ETFs today are momentum, low volatility, quality, dividend achiever, and buyback strategies. All these factors are designed to pinpoint a certain investment theme within the marketplace, and systematically allocate to that theme. For instance, the “low volatility” factor is represented by the Invesco S&P 500 Low Volatility ETF (SPLV), a fund that seeks exposure to the 100 stocks with the lowest volatility in the S&P 500. Most of the factors examined offer better performance than the benchmark, the SPDR S&P 500 ETF (SPY), through certain durations. However, no single factor ETF has been the best performer every year, or even most of the years...nor has any single factor ETF been the worst performing every year or most of the years.
Factor Return Observations (US Equities)
- Many of the factors that struggled in 2025 are leading in 2026 (so far). Dividend names finished in the bottom spot last year but manage to sit atop the rankings through Q1. If this holds through the rest of the year, it would mark the first time since 2020 that a factor went from last to first (value).
- Conversely, areas that excelled in 2025 have struggled in 2026. Buyback & the benchmark sit towards the bottom of the pack as we open up the second quarter.
- If the core of the market remains in last place for the remainder of the year, it would mark the first time in our observed history that the core finishes last. While less than ideal at first glance, a (relatively) weaker core could create space for trend-followers to find alpha in other factors.
- Despite shifts in leadership away from growth focused areas so far in 2026, the momentum factor representative has been able to perk up nicely so far this year. The momentum representative has gained roughly 4% so far this year.

It is About Time in the Factor, Not Trying to Time the Factor
Our goal with the research above is to illustrate the range of available factors and the necessity of discipline in applying these factors over time. We want to promote “good behavior,” as it relates to any investment process or product. This is perhaps the most important observation from the data above; we illustrated the outcomes generated by a few common behaviors using the same investment universe, and the outcomes vary dramatically.
There are the “buy and hold” outcomes, which show buyback and growth as the best performers throughout the entire timeframe, but we also know inherently what comes with a buy and hold commitment to only one group. 2026 has showcased this issue most recently as these factors struggled throughout Q1. Other examples include 2022 or 2000-2002- all tough spans for growth, tougher than many could endure. While buyback has turned it around over the last decade, there was a five year stretch from 2014-2018 where the factor didn’t crack the top half of performance rankings. This can be tough to stomach as other areas continue to excel.
Another approach is to equal weight all seven factors in a portfolio and rebalance that portfolio once a year. This gives you a baseline that notably underperforms the benchmarks over the last 10+ years. We also looked at the hypothetical behavior of buying the best-performing factor from the previous year and holding that factor for the entire next calendar year; we called this “Return Chasing,” and while no portfolio manager markets themselves this way exactly, it is an emotional bias that creeps into many investors’ psyches.
This “Return Chasing” portfolio tracks a hypothetical investor who sees that no strategy could beat the benchmark last year, so they just buy that factor for the next year. As mentioned previously, this has only “worked” in back-to-back full calendar years from 2012-2013… and while growth did well in 2025, return chasing still hasn’t worked quite well over our back test. On a cumulative basis, return chasing has massively underperformed not only the other “strategies,” but also what buying-and-holding almost any other factor would have provided. The factors themselves are not the problem, as many create substantial alpha relative to the market. Bad behavior can create bad returns out of good products, and constantly chasing last year’s best-performing factor often exemplifies that reality.
The opposite of return chasing is the contrarian approach, which buys the worst-performing factor from the previous year and holds it for the subsequent calendar year. The “Contrarian Switching” portfolio illustrates what is missed when an investor dumps a factor for having a bad year. A good stock can become a bad stock and remain such for a long time, so a good factor is less likely to stay perennially out of favor because it should have a process of systematically eliminating bad stocks – this is evidenced by the outperformance of the “Contrarian Switching” strategy, which has beaten the "average" portfolio of equally weighted factors despite a poor stretch the last few years. It is working so far for dividend names.
International Equity Smart Beta
These strategies can also be applied to factor representatives from international equities, which, as we can see below, demonstrate similar tendencies to their domestic counterparts. Note that the representatives below are only for developed market equities, as there has not been enough historical representation of factor exposure in emerging markets to represent a robust examination.
Factor Return Observations (Intl Equities):
- After all the international groups finished in the black in 2025, most of the space continued to advance throughout the first quarter of 2026. Growth options were the lone exception.
- In a similar fashion to 2025, there remains an apparent preference for value focused areas. International quality has also picked up.
- After spending finishing 2023-2025 in the top half of the rankings, momentum has cooled off a bit to open the year. Despite this, the factor is still up in 2026, seeing the representative gain just over 1% in Q1.


