Signs of panic in the volatility complex may give relief to bulls.
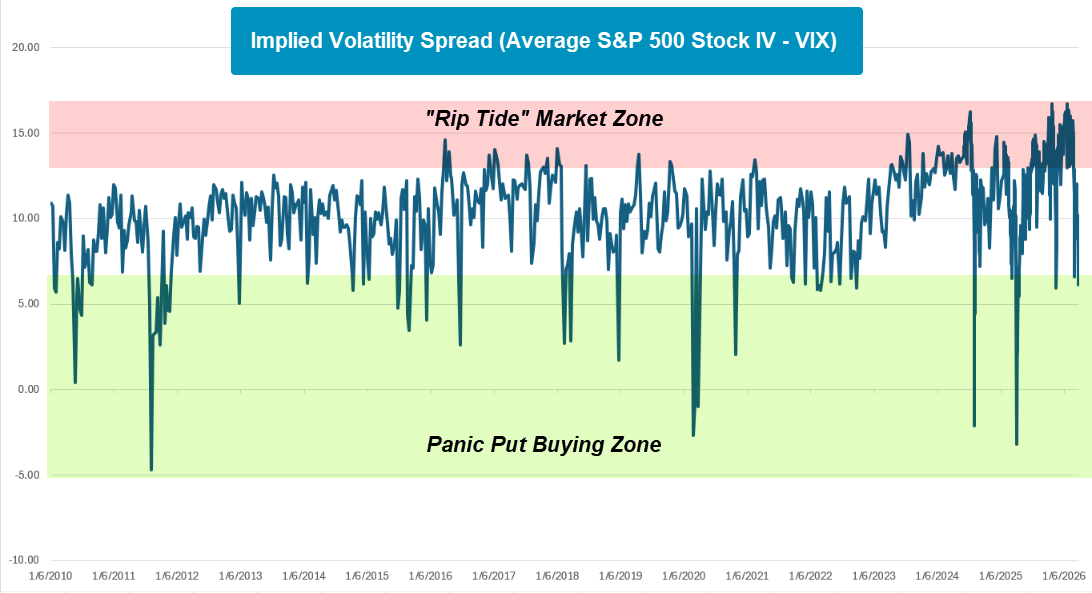
About a month and a half ago, we discussed the wide disparity between S&P 500 Index implied volatility and the average implied volatility of its constituents. In summary, the average stock implied volatility in the S&P was historically elevated relative to the index’s volatility. We called this a “rip tide market” as the market looked calmed from a distance but was much more violent once you got in the water (read more here). With the recent increase in the S&P 500 Volatility Index (VIX), we are now in the opposite situation where the spread between index implied volatility and average constituent volatility has collapsed down to attractive levels for equity investors. While we have seen market panic episodes in the past where the spread between average SPX stock implied volatility and SPX implied volatility headed even lower than it is today, a bounce is usually in order from these levels. Said another way, investors were underpricing insurance a month and a half ago and have now shifted to overpricing insurance.
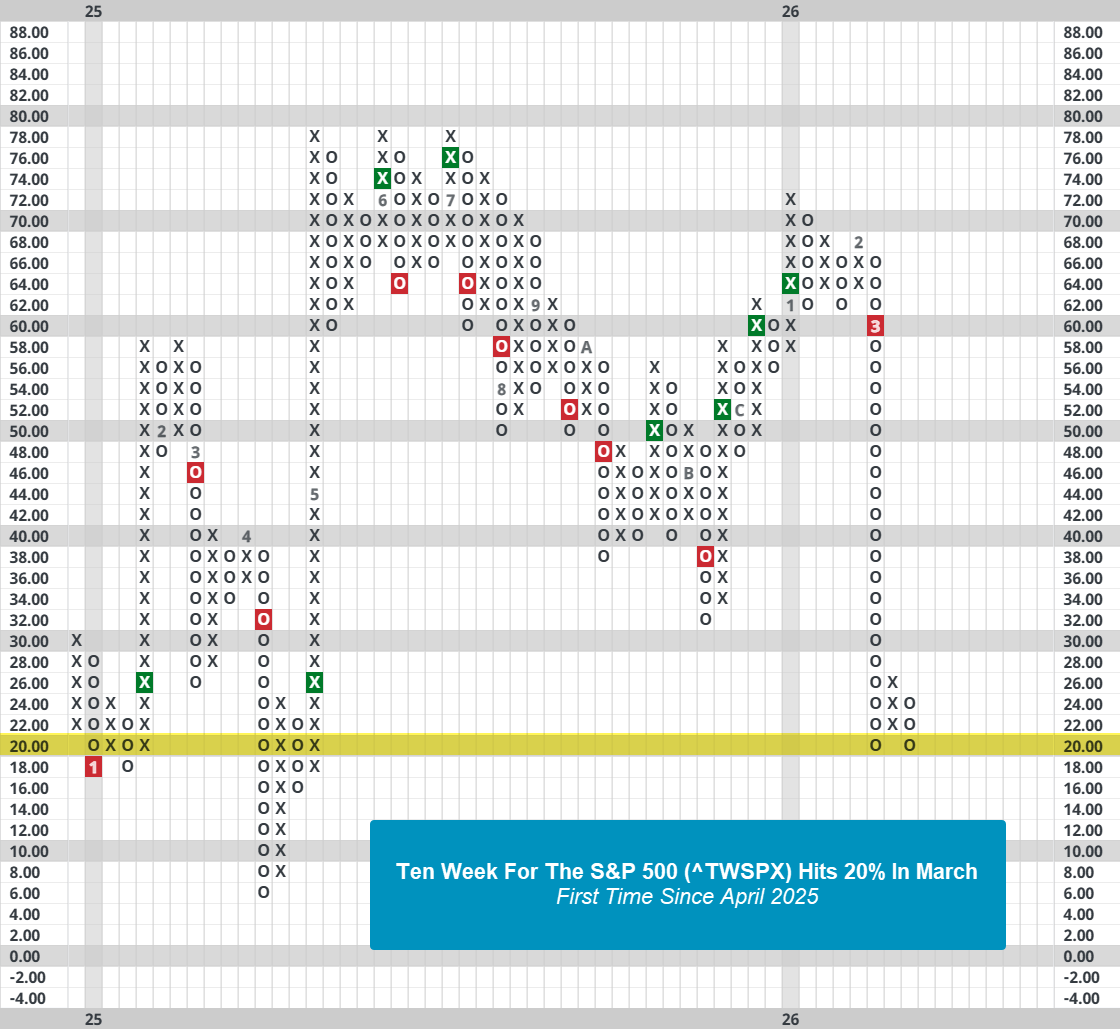
The markets could certainly move down further, but for those looking to protect portfolios with puts now is not the time to do so. Secondly, we have yet to see major technical deterioration of domestic or international equities. Short and intermediate-term indicators are trading in or right at washed out territory. The Ten Week for the S&P 500 (^TWSPX) and the Bullish Percent for the S&P 500 (^BPSPX) sit at 20% and 32%, respectively. Like the volatility spread, both indicators can and have headed lower, but any reversals back into Xs would usually be a good buying opportunity. There is plenty of headline risk moving forward, but the market is in a good position for a bounce.
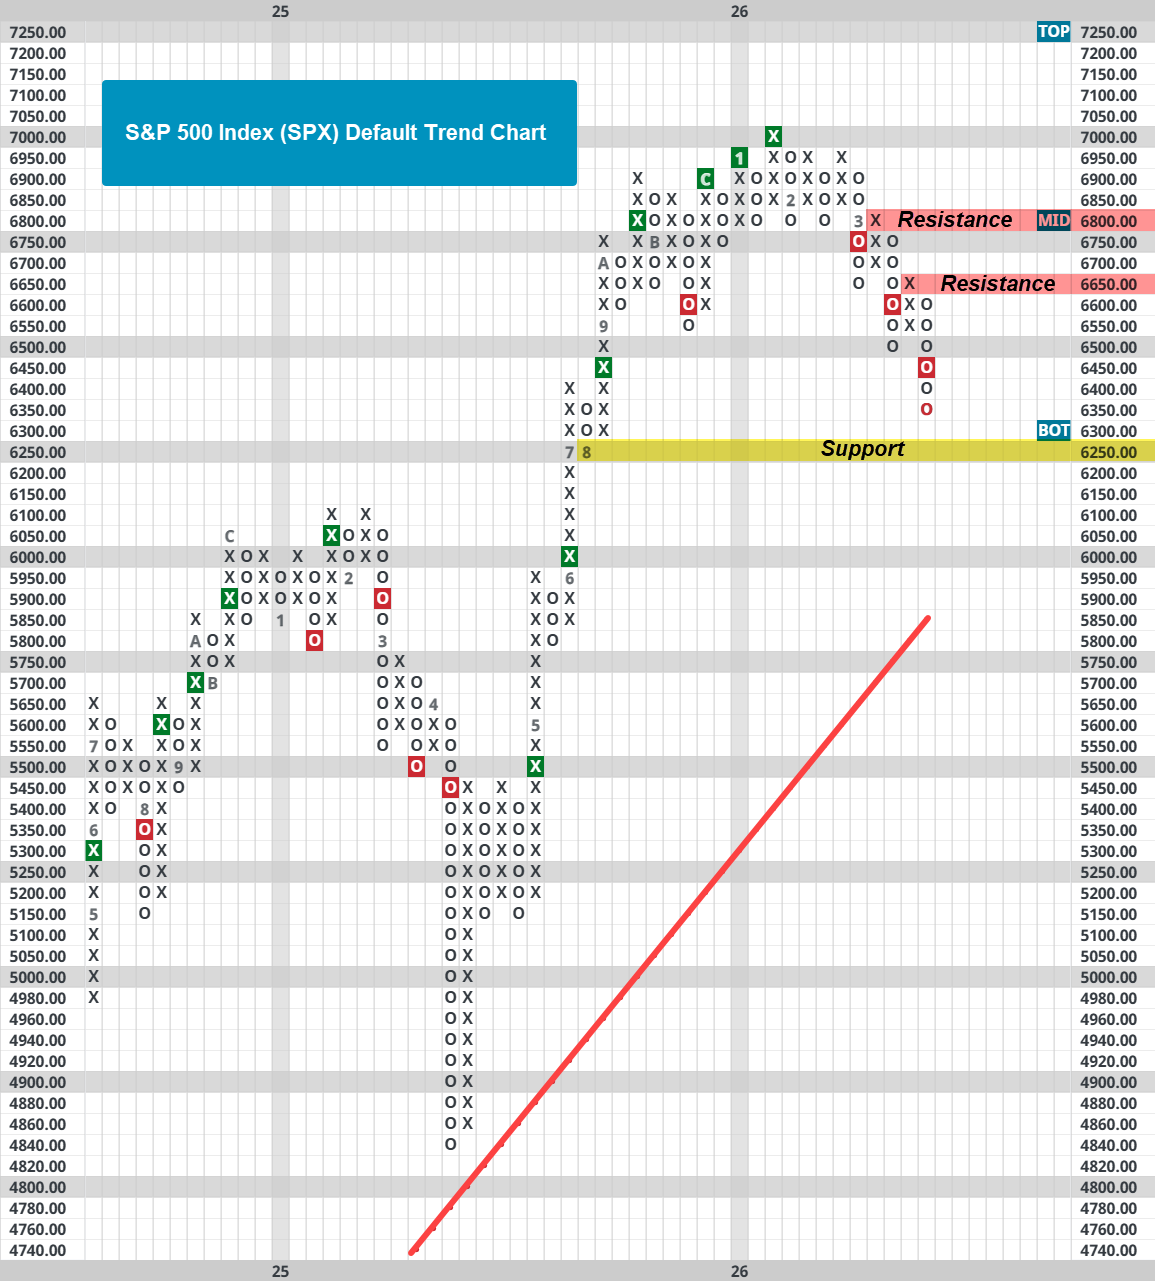
While there is a good setup for a bounce in the market, we still need to be on the lookout if that is not the case. Looking at the S&P 500’s (SPX) default chart, the next level of support is 6250. Below 6250, there is not any support until the 5800 to 5850 area. In terms of resistance, there are a few levels the benchmark needs to overcome: 6650 and 6800. Above 6800, the index is set up for test of its all-time highs at 7000. In other words, SPX has some technical repairs before bulls can feel confident even if a bounce does occur. Nonetheless, the dynamics in the volatility complex and low indicator readings shine a favorable light on a bounce in the short-term at least.