
Investing is a delicate balance between greed and fear, but with markets declining over the last month due to a variety of headlines, investors have gravitated much closer to fear. What does that mean for client portfolios?
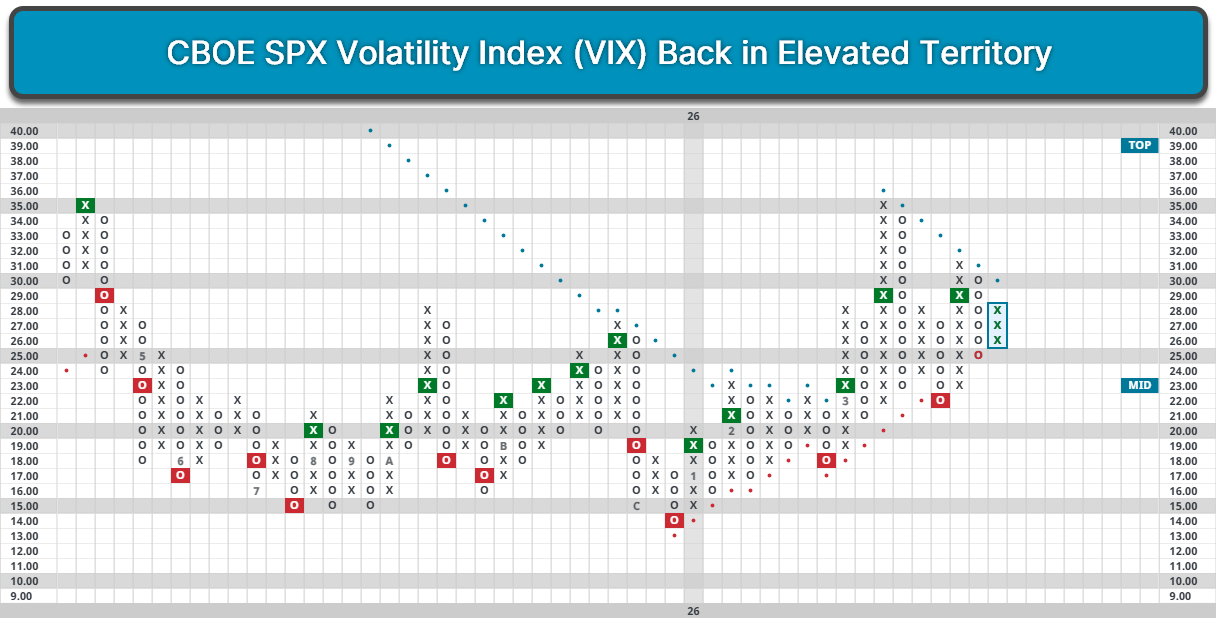
Investing is a delicate balance between greed and fear, but with markets declining over the last month due to a variety of headlines, investors have gravitated much closer to fear. The most common “fear gauge” of the stock market is the CBOE VIX index, measuring the expected volatility (standard deviation of returns) of the S&P 500 (SPX) over the next 30 days. The index entered the year around multi-year lows, but with selloff after January, the index has doubled after settling around 28.
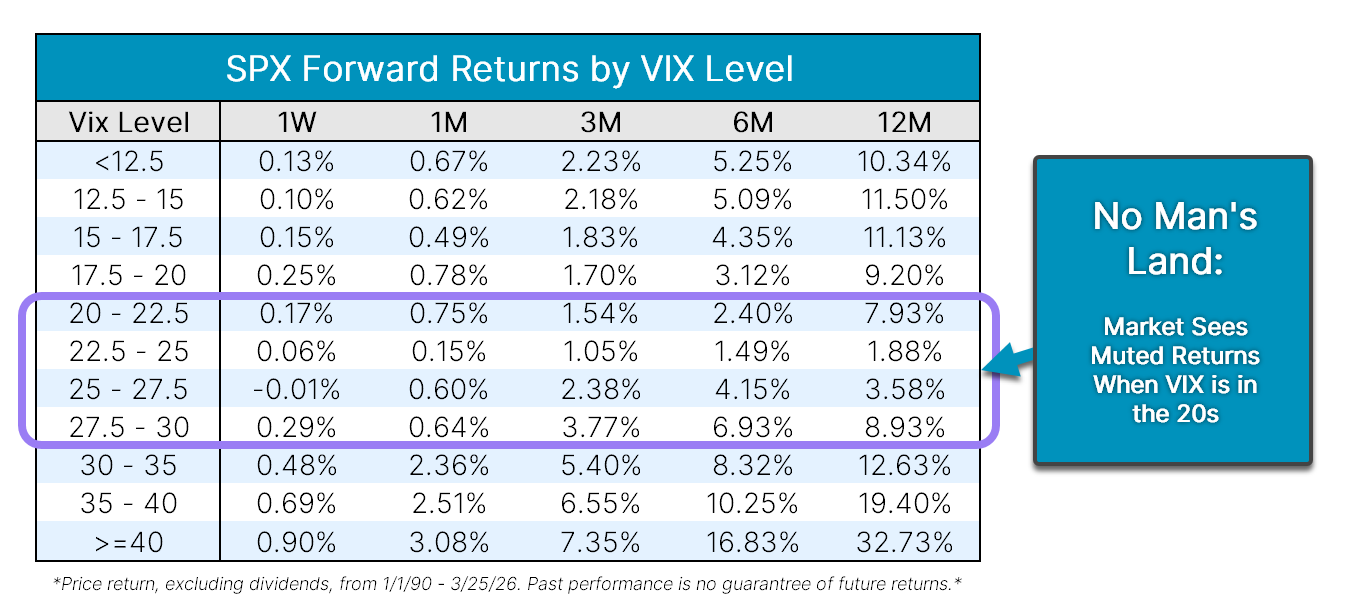
When it comes to the VIX, markets tend to perform best during periods of extremely low or high volatility, with investors cruising in stability or rebounding out of potentially oversold and volatile territory. Meanwhile, a VIX between 20 and 30 can be a no man’s land. When the VIX was between 27.5 and 30, the S&P 500 averaged a one-year return of 8.9%, with levels between 20 and 27.5 being even more muted. However, movements above 30 or below 20 could signal a more bullish outlook for the market given historical tendencies. Additionally, there are some other positive signs from the current VIX.
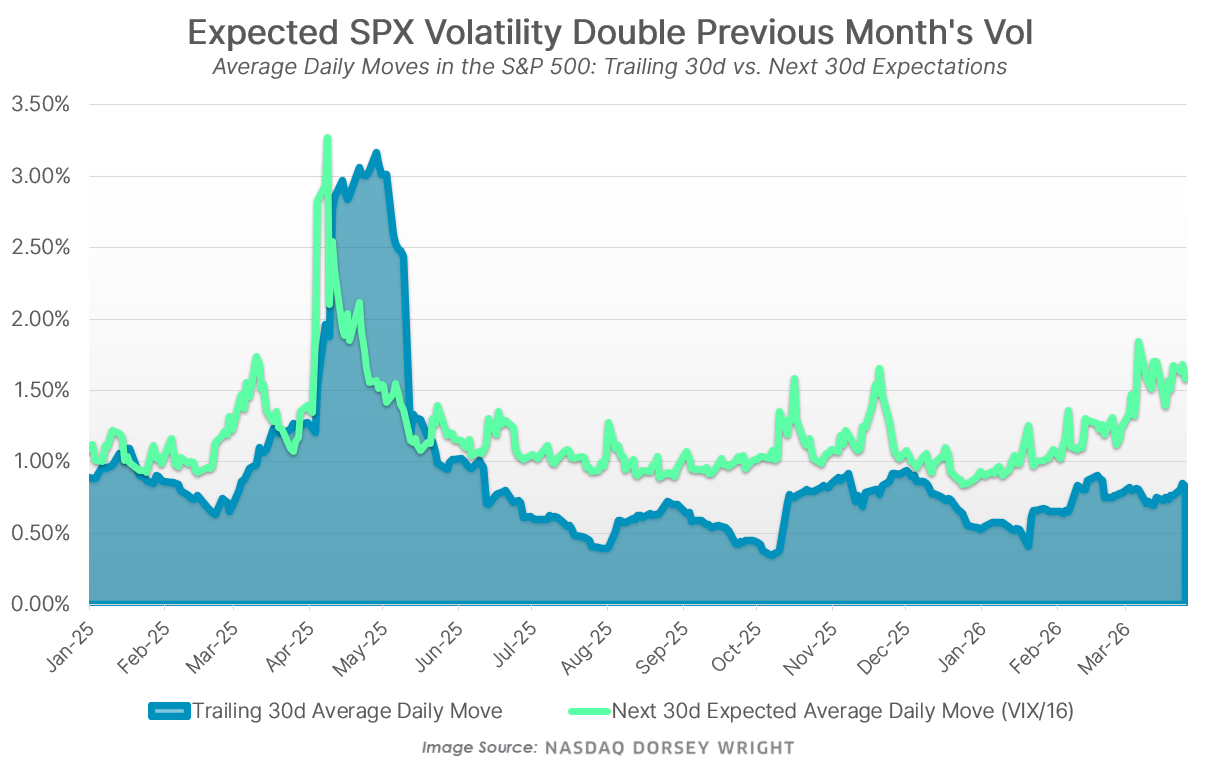
Another way to interpret the VIX is using the rule of 16, which states that the average daily change in SPX is equal to the VIX divided by 16. Presently, our reading of 28 divided by 16 is 1.75, meaning that the market is expecting an average daily move of 1.75% over the next month. However, the market has yet to see a single day with that magnitude of movement over the last month, with the most recent 1.75% up or down day occurring on February 6th. Meanwhile, the realized volatility of the S&P 500 over the last month has been approximately 13, or the equivalent of an 0.8% average daily move. Consequently, the market expects the next month to be roughly twice as volatile as the previous month, marking a significant disconnect between recent and expected volatility.
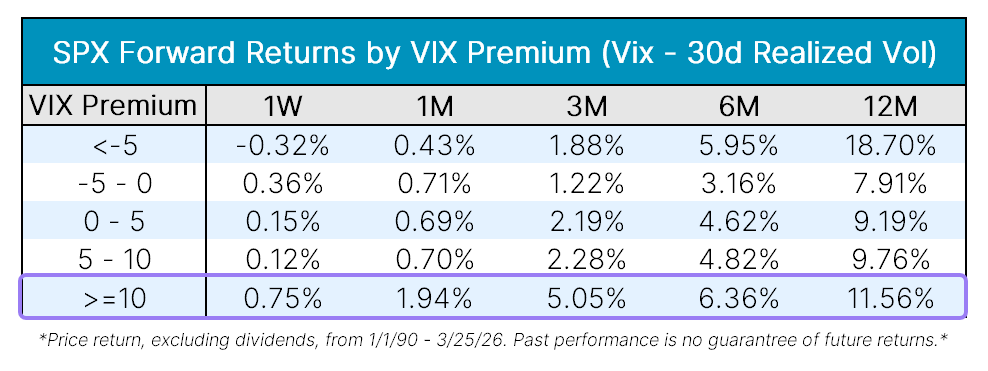
When the market is expecting volatility to increase significantly from recent levels, it has historically been a signal that the market is overly fearful. For context, the current 15-point premium between the VIX and realized volatility ranks in nearly the 99th percentile of instances. When the VIX was ten points higher than trailing volatility, the S&P 500 gained an average of 5% over the next three months, highlighting that similar instances may have displayed excessive fear.
While overall volatility levels place us in cautious territory, investors appear to be overly fearful in the near term given the expected increases in volatility and consensus negative sentiment. Warren Buffett once said, “Be fearful when others are greedy and greedy when others are fearful.” With the market moving into fearful territory, it wouldn’t be surprising to see investors become greedier over the coming weeks, even with unanswered questions about the long-term outlook of the market.
