Most Requested Symbols

Commodities have fallen down to third as precious metals have cooled and energy bounces back and forth amid unrest in the Middle East. We discuss the change today.
The S&P 500 is is 7% away from all-time highs while the Russell 2000 just moved into a correction. How often do similar declines become full bear markets?
Weekly Rundown Video - March 18, 2026
Weekly rundown with NDW analyst team covering all major asset classes.
Weekly rundown with NDW analyst team covering all major asset classes.
Seemingly as quickly as it went up, Commodities have fallen down into the third position within the NDW DALI rankings… but perhaps not quite for the reason many would have anticipated. With continued unrest in the Middle East over the last few weeks, energy focused names have driven up towards the top of the rankings, seeing the likes of crude oil and other areas of the energy complex reach levels not tested for a handful of years. The swift nature of the supply shock saw many representatives move into heavily overbought territory on their default charts, leading lots of recent commentary to site the possibility for normalization in the near-term as the situation surrounding the ongoing conflict continues to develop. Energy prices generally fell on Monday (3/23) as news surfaced of further delays in US strikes of key facilities after there had been some apparent progression in talks to end the conflict. While it is certainly still too early to tell if this is genuine progress in de-escalation or just a bluff from President Trump, crude oil fell as much as 12% from this weekend’s highs to cool off in the low $90’s. There is obviously still plenty of room for continued volatility in the near-term, but any news of progress will likely continue to send energy lower.
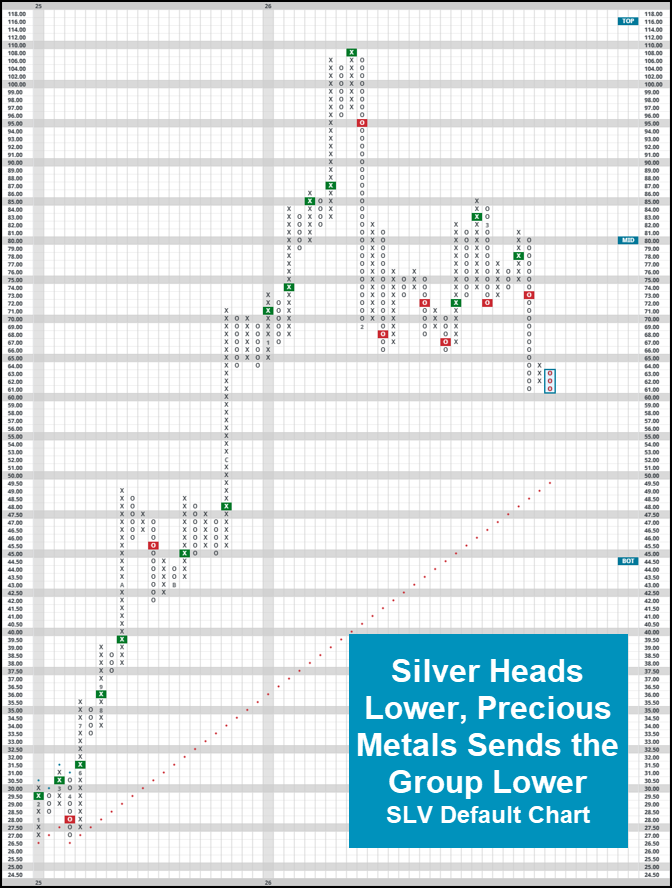
While further declines in energy names would undoubtedly yield further deterioration for the commodities group within the broad rankings, the group was not the main driver of Monday’s move lower within the overall DALI rankings. Precious metals have suddenly struggled quite mightily, seeing the likes of silver (SLV, -4.5% YTD) or gold (GLD, +4.5% YTD) trade well off 2026 highs. While both funds maintain strong fund scores, there is no question that things have technically deteriorated and it isn’t the time to just blindly buy into the space like we might have been able to do throughout 2025. SLV, included below, returned to a column of O’s with intra-day action on 3/23, putting in a localized level of resistance below a major level of support in the mid-$60’s. Now trading for roughly half of the levels we saw during the meteoric rise earlier in the year, there is certainly cause for a bit of concern in the near-term.
To close today’s piece, we will refocus on the DALI rankings. With the updates to the rankings on Monday’s morning, commodities lost 40 signals in a single day as major representatives for the space returned to RS sell signals against other areas. For reference, the 40-signal drop is the largest single day decline in signal count for the group since the start of our data in 2002 and represents a roughly 15% decline in total signals. While there could certainly be further volatility in store, the move confirms some (relative) strength for both domestic and international equites. The move also highlights the need for a process in following the rankings- waiting for a major signal landmark (10-15 signal difference) before making broader shifts or waiting until the end of the month can help prevent whipsaw and confirm strength in one direction or the next.


The Russell 2000 (RUT) was up as much as 9.5% to start the year on January 22nd, but has since fallen 10.3% from highs, entering a technical correction at the end of last week. Additionally, the index moved back to a negative trend after completing its third consecutive sell signal, ending what had been an extremely solid run since April. The fund score of iShares Russell 2000 ETF (IWM) is down to hold territory at 3.77, which is 0.82 points lower than its highs last year, leaving it below a 4.0 score for the first time since last September. Given the deterioration, what have previous corrections for small caps looked like, and when might things turn around?
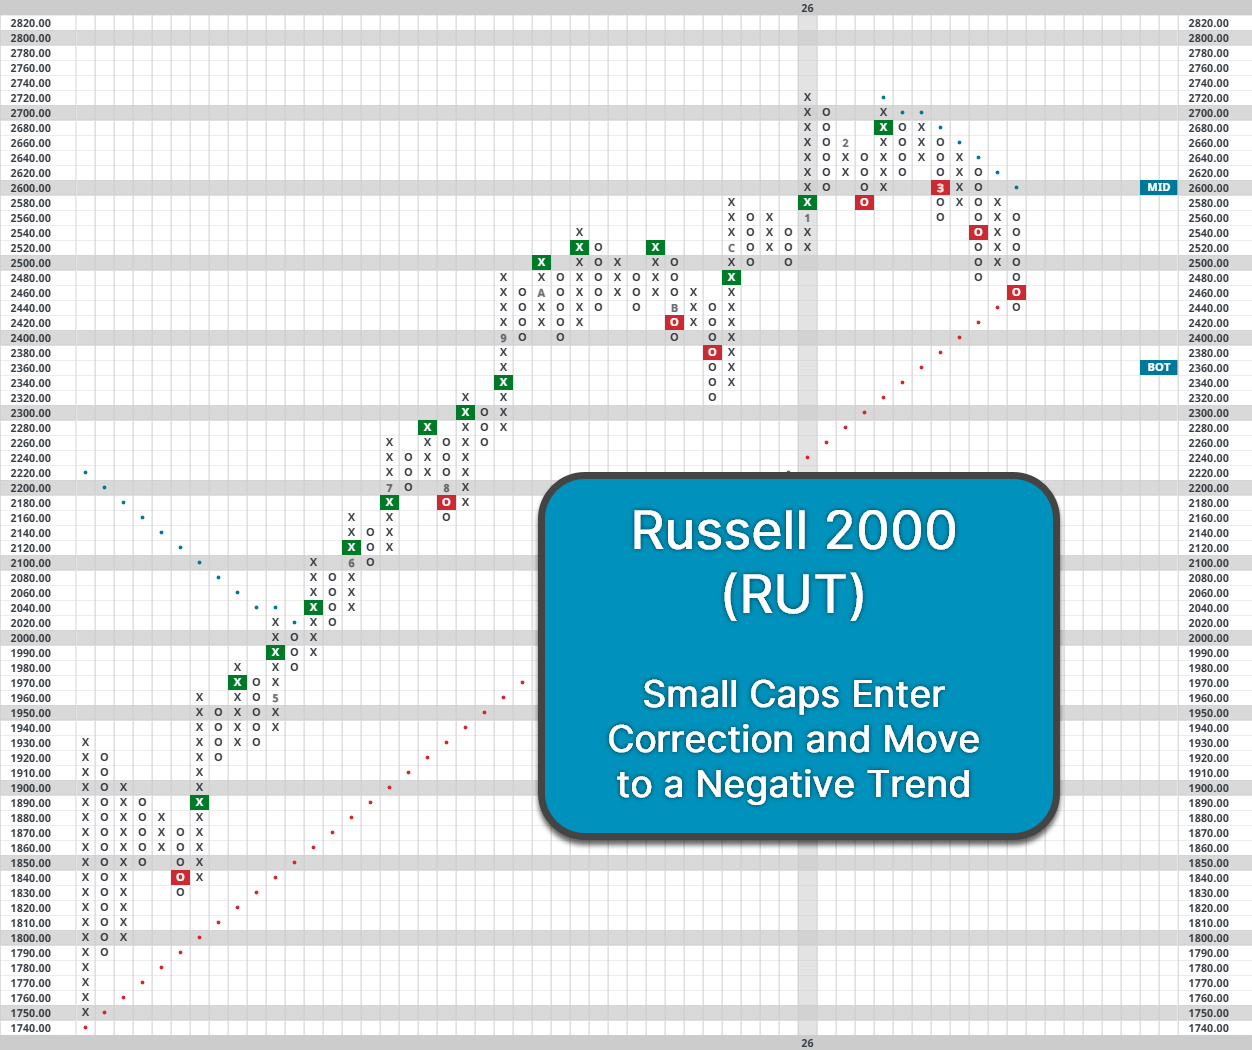
Looking at the Russell 2000 since its inception in 1979, there have been 23 instances in which the index set a new all-time high, then moved into a 10% correction. Of those 23 occurrences, 70% went on to fall at least another 5%. Meanwhile, the forward returns after the index initially moved into a correction were below average across the board. Specifically, the index was flat on average over the next three months while averaging one-year returns of only 6%. It’s also taken the index an average of 15.6 months to return to ATHs after first moving into a correction. Consequently, recent declines among small cap stocks could indicate a more subdued year. While traders might want to buy the dip at every step of the way for RUT, doing so has been more fruitful when waiting until the index moved into a bear market, as a 20% decline is when RUT's forward returns moved above their baseline average. That said, small caps have been prone to sharp reversals in both directions in recent years, so the index could still defy historical norms and rebound quickly, especially given the acceptable levels of relative strength from the group currently.

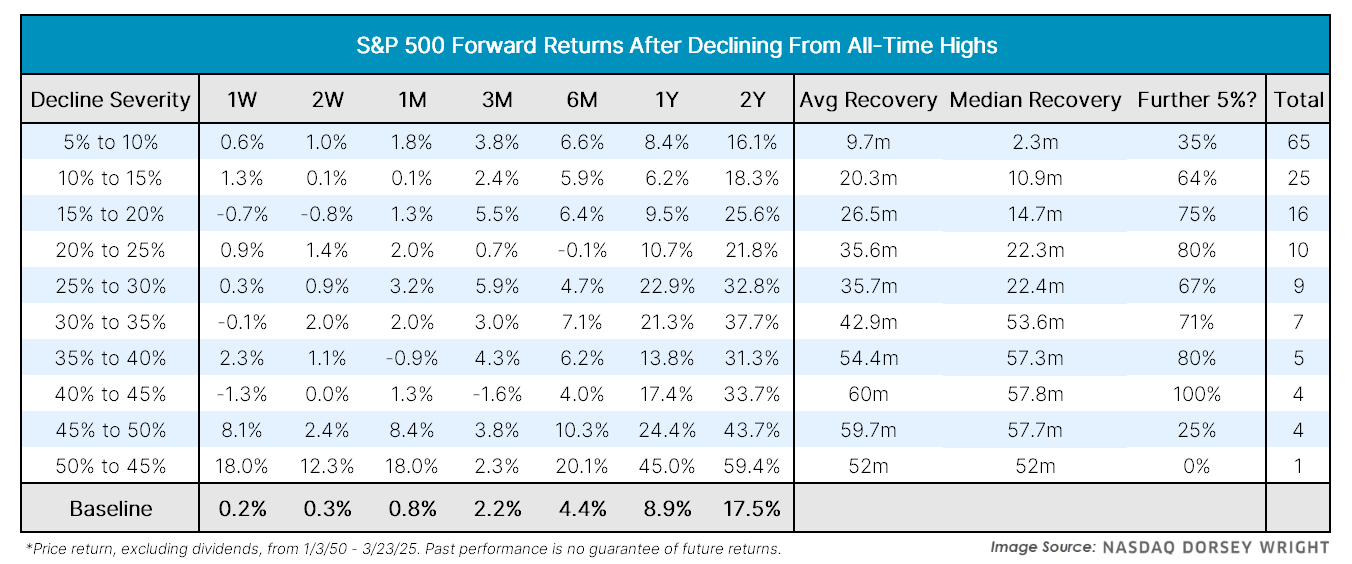
While small caps have been hit the hardest within domestic equities, the broader market hasn’t been immune to downside pressure either. The S&P 500 (SPX) set new all-time highs in January but has since fallen 6.8%. Declines of this magnitude are relatively common for SPX, as the index has made 66 trips from all-time highs to a decline of at least 5% going back to 1950. Historically, declines of 5% to 10% for the S&P 500 were relatively subdued, with markets entering a correction only 35% of the time before returning to ATHs. The median recovery back to highs has also been a relatively quick 2.3 months. Meanwhile, the one-year forward returns for the market were largely normal, averaging an 8.3% gain. However, recent pullbacks have been more notable for the speed of downside rather overall magnitude, with the index declining almost 6% in the last month alone.
While a month that bad feels abnormal relative to the last few years, it’s certainly not the first time something like that has occurred. The current bull market officially began on October 12th of 2022, with the S&P 500 gaining 73% from that point. However, there are still seven other times during this bull where SPX declined 5% or more over a month. Encouragingly, the market was higher three months later in each of those seven instances, averaging a gain of over 10.5% as stocks climbed out of oversold territory. Granted, it would be unlikely for the market to match or exceed those same averages, but it does offer some optimism for investors over the next year despite recent volatility.

Additionally, several of our indicators are signaling that things have moved into washout territory in the near-term. The S&P 500 index funds group on the Asset Class Group Scores page displays an overbought/oversold (OBOS) reading of nearly -100%, marking the most oversold conditions for the market since the Tariff Tantrum. Meanwhile, the ten week for the S&P 500 (^TWSPX) recently moved to somewhat washed out territory below 20%. A reversal from ^TWSPX below 20% would be a potential sign that the market has put in a bottom, especially given the consistent long-term strength of domestic equities. Overall, a 5% to 10% decline is certainly uncomfortable, but it shouldn’t materially change our market outlook unless we see signs of further deterioration.

Average Level
-46.42
| < - -100 | -100 - -80 | -80 - -60 | -60 - -40 | -40 - -20 | -20 - 0 | 0 - 20 | 20 - 40 | 40 - 60 | 60 - 80 | 80 - 100 | 100 - > |
|---|---|---|---|---|---|---|---|---|---|---|---|
|
Buy signalVOOV
|
|||||||||||
|
Buy signalSPY
|
|||||||||||
|
Sell signalXLG
|
Sell signalVOOG
|
||||||||||
|
Buy signalrsp
|
Buy signalEEM
|
||||||||||
|
Buy signaliwm
|
Sell signaltlt
|
||||||||||
|
Sell signalefa
|
Sell signalief
|
Buy signaldvy
|
|||||||||
|
Sell signaldia
|
Buy signalijr
|
Buy signalfxe
|
|||||||||
|
Buy signalhyg
|
Sell signallqd
|
Sell signalONEQ
|
Sell signalQQQ
|
Buy signalUSO
|
|||||||
|
Buy signalshy
|
Sell signalagg
|
Buy signalIJH
|
Sell signalGLD
|
Buy signalicf
|
Buy signalGCC
|
Buy signaldx/y
|
Buy signalGSG
|
||||
| < - -100 | -100 - -80 | -80 - -60 | -60 - -40 | -40 - -20 | -20 - 0 | 0 - 20 | 20 - 40 | 40 - 60 | 60 - 80 | 80 - 100 | 100 - > |
| AGG | iShares US Core Bond ETF |
| USO | United States Oil Fund |
| DIA | SPDR Dow Jones Industrial Average ETF |
| DVY | iShares Dow Jones Select Dividend Index ETF |
| DX/Y | NYCE U.S.Dollar Index Spot |
| EFA | iShares MSCI EAFE ETF |
| FXE | Invesco CurrencyShares Euro Trust |
| GLD | SPDR Gold Trust |
| GSG | iShares S&P GSCI Commodity-Indexed Trust |
| HYG | iShares iBoxx $ High Yield Corporate Bond ETF |
| ICF | iShares Cohen & Steers Realty ETF |
| IEF | iShares Barclays 7-10 Yr. Tres. Bond ETF |
| LQD | iShares iBoxx $ Investment Grade Corp. Bond ETF |
| IJH | iShares S&P 400 MidCap Index Fund |
| ONEQ | Fidelity Nasdaq Composite Index Track |
| QQQ | Invesco QQQ Trust |
| RSP | Invesco S&P 500 Equal Weight ETF |
| IWM | iShares Russell 2000 Index ETF |
| SHY | iShares Barclays 1-3 Year Tres. Bond ETF |
| IJR | iShares S&P 600 SmallCap Index Fund |
| SPY | SPDR S&P 500 Index ETF Trust |
| TLT | iShares Barclays 20+ Year Treasury Bond ETF |
| GCC | WisdomTree Continuous Commodity Index Fund |
| VOOG | Vanguard S&P 500 Growth ETF |
| VOOV | Vanguard S&P 500 Value ETF |
| EEM | iShares MSCI Emerging Markets ETF |
| XLG | Invesco S&P 500 Top 50 ETF |

| Symbol | Company | Sector | Current Price | Action Price | Target | Stop | Notes |
|---|---|---|---|---|---|---|---|
| CACI | CACI International Inc. | Computers | $606.38 | 570s - 600s | 672 | 528 | 5 for 5'er, top 25% of COMP sector matrix, LT pos mkt RS, triple top breakout |
| WBS | Webster Financial Corporation | Banks | $67.80 | hi 60s - low 70s | 91 | 58 | 4 for 5'er, top 25% of BANK sector matrix, one box from peer RS buy, buy on pullback, 2.2% yield |
| CGON | CG Oncology, Inc. | Biomedics/Genetics | $65.08 | hi 50s - low 60s | 80 | 50 | 5 for 5'er, 18 of 162 in BIOM sector matrix, bullish catapult, good R-R, Earn. 3/26 |
| RTX | RTX Corp. | Aerospace Airline | $198.16 | upper 190s to mid 210s | 254 | 166 | 4/5'er; top third of Aero matrix; Peer RS within 1 box of RS buy; ATHs on 3/2. |
| COCO | Vita Coco Company, Inc. | Food Beverages/Soap | $52.90 | mid-to-hi 50s | 72 | 48 | 5 for 5'er, top half of FOOD sector matrix, LT pos peer & mkt RS, pos trend flip |
| DGII | Digi International Inc | Telephone | $47.81 | upper 40s to lower 50s | 61 | 40 | 5 for 5'er; top quartile of Telephone matrix; buy signal since May '25, pos. trend since June '25. |
| ASND | Ascendis Pharma A/S | Biomedics/Genetics | $221.88 | 220s - low 230s | 282 | 188 | 4 for 5'er, top third of BIOM sector matrix, LT pos peer & mkt RS, bullish triangle, buy on pullback |
| BRX | Brixmor Property Group Inc | Real Estate | $28.71 | hi 20s - lo 30s | 38 | 24 | 4 for 5'er, top third of REAL sector matrix, LT pos peer & mkt RS, LT pos trend, bullish triangle, 4% yield |
| CNX | CNX Resources Corp | Oil | $40.48 | hi 30s - mid 40s | 71 | 33 | 5 TA rating, top 50% of OIL sector matrix, LT RS buy and pos trend, consec buy signals |
| FFIV | F5 Inc. | Internet | $284.28 | 280s - 290s | 344 | 256 | 4 for 5'er, top third of INET sector matrix, LT pos peer RS, spread quad top |
| INVA | Innoviva, Inc | Drugs | $21.71 | lo-mid 20s | 32.50 | 18.50 | 5 TA rating, top half of drugs sector RS matrix, LT pos trend, LT RS buy, buy-on-pullback |
| ORKA | Oruka Therapeutics Inc. | Biomedics/Genetics | $38.95 | mid-to-hi 30s | 57 | 30 | 5 for 5'er, top 10% of BIOM sector marix, quadruple top, buy on pullback, R-R>2.0 |
| ARCB | ArcBest Corp. | Transports/Non Air | $87.48 | low-to-mid 90s | 113 | 79 | 4 for 5'er, one box from market RS buy, top half of favored TRAN sector matrix, good R-R |
| Symbol | Company | Sector | Current Price | Action Price | Target | Stop | Notes |
|---|---|---|---|---|---|---|---|
| CPRT | Copart Incorporated | Autos and Parts | $32.86 | hi 30s | 28 | 42 | 1 TA rating, bottom 50% of AUTO sector matrix, NT and mkt RS sell last month, consec sell signals |
| Symbol | Company | Sector | Current Price | Action Price | Target | Stop | Notes |
|---|---|---|---|---|---|---|---|
| ABBV | AbbVie Inc. | Drugs | $205.07 | 210s - low 230s | 284 | 188 | ABBV has fallen to a sell signal and a negative trend. OK to hold here Maintain $188 stop. |
| AB | AllianceBernstein Holding LP | Wall Street | $37.10 | low 40s | 64 | 32 | AB has fallen to a 2 for 5'er; though it remains above our stop we will look to exit the position. |
| Comment | |||||||
|---|---|---|---|---|---|---|---|
|
|
|||||||
ARCB ArcBest Corp. R ($92.12) - Transports/Non Air - ARCB is a 4 for 5'er that ranks 22nd of 62 names in the favored transports/non air sector matrix and sits one box away from giving a market RS buy signal, which would promote it to a 5 for 5'er. After giving two consecutive sell signals, ARCB returned to a buy signal last week when it broke a double top at $89. Long exposure may be added in the low to mid $90s and we will set our initial stop at $79, which would take out multiple levels of support on ARCB's chart and violate its trend line. We will use the bullish price objective, $113, as our target price.
| 26 | |||||||||||||||||||||||||||||
| 112.00 | X | 112.00 | |||||||||||||||||||||||||||
| 110.00 | X | O | 110.00 | ||||||||||||||||||||||||||
| 108.00 | X | O | X | 108.00 | |||||||||||||||||||||||||
| 106.00 | X | O | X | O | X | 106.00 | |||||||||||||||||||||||
| 104.00 | X | O | X | O | X | O | 104.00 | ||||||||||||||||||||||
| 102.00 | X | O | X | O | X | 3 | O | 102.00 | |||||||||||||||||||||
| 100.00 | X | O | X | O | X | O | X | O | 100.00 | ||||||||||||||||||||
| 99.00 | X | O | X | O | X | O | X | O | 99.00 | ||||||||||||||||||||
| 98.00 | X | O | X | O | X | O | O | 98.00 | |||||||||||||||||||||
| 97.00 | X | O | X | O | O | 97.00 | |||||||||||||||||||||||
| 96.00 | X | O | O | Mid | 96.00 | ||||||||||||||||||||||||
| 95.00 | X | O | X | 95.00 | |||||||||||||||||||||||||
| 94.00 | X | O | X | O | 94.00 | ||||||||||||||||||||||||
| 93.00 | X | X | O | X | O | 93.00 | |||||||||||||||||||||||
| 92.00 | X | O | X | O | X | O | 92.00 | ||||||||||||||||||||||
| 91.00 | X | X | O | X | O | X | O | 91.00 | |||||||||||||||||||||
| 90.00 | X | O | X | O | X | O | X | O | X | 90.00 | |||||||||||||||||||
| 89.00 | X | O | X | O | X | O | O | X | 89.00 | ||||||||||||||||||||
| 88.00 | X | O | X | O | X | O | X | X | 88.00 | ||||||||||||||||||||
| 87.00 | X | O | X | O | X | O | X | O | X | 87.00 | |||||||||||||||||||
| 86.00 | X | X | O | O | X | O | X | O | X | 86.00 | |||||||||||||||||||
| 85.00 | X | O | X | O | X | O | X | O | 85.00 | ||||||||||||||||||||
| 84.00 | X | O | X | O | X | O | X | • | 84.00 | ||||||||||||||||||||
| 83.00 | X | X | O | O | 2 | O | • | 83.00 | |||||||||||||||||||||
| 82.00 | X | O | X | O | X | • | 82.00 | ||||||||||||||||||||||
| 81.00 | X | O | X | O | X | • | 81.00 | ||||||||||||||||||||||
| 80.00 | X | O | X | O | • | 80.00 | |||||||||||||||||||||||
| 79.00 | X | O | X | • | 79.00 | ||||||||||||||||||||||||
| 78.00 | X | O | X | • | 78.00 | ||||||||||||||||||||||||
| 77.00 | X | O | X | • | 77.00 | ||||||||||||||||||||||||
| 76.00 | X | O | X | • | 76.00 | ||||||||||||||||||||||||
| 75.00 | X | O | X | • | 75.00 | ||||||||||||||||||||||||
| 74.00 | X | 1 | • | 74.00 | |||||||||||||||||||||||||
| 73.00 | X | X | • | 73.00 | |||||||||||||||||||||||||
| 72.00 | • | X | O | X | • | 72.00 | |||||||||||||||||||||||
| 71.00 | • | X | O | X | • | 71.00 | |||||||||||||||||||||||
| 70.00 | • | X | O | X | • | 70.00 | |||||||||||||||||||||||
| 69.00 | X | O | • | 69.00 | |||||||||||||||||||||||||
| 68.00 | X | • | 68.00 | ||||||||||||||||||||||||||
| 67.00 | O | X | • | Bot | 67.00 | ||||||||||||||||||||||||
| 66.00 | O | C | X | • | 66.00 | ||||||||||||||||||||||||
| 65.00 | O | X | O | X | • | 65.00 | |||||||||||||||||||||||
| 64.00 | O | X | O | X | • | 64.00 | |||||||||||||||||||||||
| 63.00 | O | X | O | X | • | 63.00 | |||||||||||||||||||||||
| 62.00 | O | X | O | • | 62.00 | ||||||||||||||||||||||||
| 61.00 | O | X | • | 61.00 | |||||||||||||||||||||||||
| 60.00 | O | • | 60.00 | ||||||||||||||||||||||||||
| 26 |
| BURL Burlington Stores, Inc. ($319.05) - Retailing - BURL broke a triple top at $316 to return to a buy signal and shift the trend back to positive as shares rallied to $324. The move penetrates the bearish resistance line, which will flip the trend back to a positive and increase the stock to a 5 for 5'er. Okay to consider here on the breakout. Note the February rally high at $332. Initial support lies at $300, while additional can be found in the $288 to $292 range. |
| CF CF Industries Holdings, Inc. ($120.15) - Chemicals - After giving nine consecutive buy signals, CF fell to a sell signal Monday when it broke a double bottom at $120. The outlook for the stock remains favorable, however, as CF is a 5 for 5'er that ranks in the top decile of the chemicals sector matrix. From here, the next level of support on CF's chart sits at $108. |
| GEV GE Vernova Inc. ($893.76) - Utilities/Electricity - GEV broke a spread quadruple top at $396 for a second buy signal as shares rallied to $912, marking a new all-time chart high. The stock is a 5 for 5'er that ranks 2nd (out of 54) in the Electric Utilities sector matrix. Okay to consider here on the breakout or on a pullback to the mid $800 range. Initial support lies at $832, while additional can be found at $784. |
| MAR Marriott International, Inc. ($329.18) - Leisure - MAR broke a double top to return to a buy signal after a recent test of the bullish support line. The stock is a 5 for 5'er that ranks within the top quartile of the Leisure sector matrix. Okay to consider here on the breakout. Initial support lies at $316, the bullish support line, while additional can be found at $312. |
| PLTR Palantir Technologies Inc. Class A ($160.52) - Software - PLTR rose Monday to break a double top at $158, marking a third consecutive buy signal. This also moved the stock back to a positive trend, promoting it to a 4 for 5 TA rating. The weight of the technical evidence is favorable and improving again. Note that the stock is at resistance from earlier this month. Further resistance could be seen at $164 and $172. Initial support is seen at $150. |
| WFRD Weatherford International Plc ($91.12) - Oil Service - After giving three consecutive sell signals, WFRD gave an initial buy signal Monday when it broke a triple top at $90. The outlook for the stock remains unfavorable, however, as WFRD is a 2 for 5'er that ranks in the bottom third of the oil service sector matrix. From here, the first level of support sits at $86 while overhead resistance sits at $94. |

| Name | Option Symbol | Action | Stop Loss |
|---|---|---|---|
| Align Technology, Inc. - $181.36 | O: 26E180.00D15 | Buy the May 180.00 calls at 15.10 | 170.00 |
| Name | Option | Action |
|---|---|---|
| AbbVie Inc. ( ABBV) | May. 230.00 Calls | Stopped at 204.00 (CP: 205.50) |
| Name | Option Symbol | Action | Stop Loss |
|---|---|---|---|
| American International Group, Inc. - $75.16 | O: 26Q75.00D15 | Buy the May 75.00 puts at 3.20 | 82.00 |
| Name | Option | Action |
|---|---|---|
| PDD Holdings Inc. ( PDD) | Apr. 100.00 Puts | Initiate an option stop loss of 5.00 (CP: 7.00) |
| Abbott Laboratories ( ABT) | Aug. 115.00 Puts | Raise the option stop loss to 10.95 (CP: 12.95) |
| Amazon.com Inc. ( AMZN) | Jun. 205.00 Puts | Stopped at 12.20 (CP: 11.40) |
| Name | Option Sym. | Call to Sell | Call Price | Investment for 500 Shares | Annual Called Rtn. | Annual Static Rtn. | Downside Protection |
|---|---|---|---|---|---|---|---|
| DuPont de Nemours Inc. $ 42.44 | O: 26E45.00D15 | May. 45.00 | 2.50 | $ 21,214.80 | 34.50% | 32.96% | 4.57% |
| Name | Action |
|---|---|
| Intel Corporation ( INTC) - 43.87 | Sell the May 49.00 Calls. |
| Micron Technology, Inc. ( MU) - 422.90 | Sell the June 420.00 Calls. |
| Moderna, Inc. ( MRNA) - 51.38 | Sell the April 55.00 Calls. |
| Fortinet Inc. ( FTNT) - 81.40 | Sell the May 85.00 Calls. |
| Dell Technologies Inc Class C ( DELL) - 157.67 | Sell the July 160.00 Calls. |
| Invesco PLC ( IVZ) - 23.21 | Sell the May 24.00 Calls. |
| Name | Covered Write |
|---|---|
| Celanese Corporation ( CE - 56.95 ) | April 60.00 covered write. |
Daily Equity & Market Analysis
Loading, Please Wait...
