Most Requested Symbols

Gold is showing its most weakness in over two years...should investors be concerned?
March trading has seen the gap between the All Value and All Growth funds eclipse 0.60 on various days, marking the widest margin since late 2022 and early 2023.
Weekly Rundown Video - March 18, 2026
Weekly rundown with NDW analyst team covering all major asset classes.
Weekly rundown with NDW analyst team covering all major asset classes.
Beginners Series Webinar: Join us on Monday, March 23rd at 2 PM (ET) for our NDW Beginners Series Webinar. This week's topic is: Understanding Relative Strength (RS) & the Matrix. Register Here
Precious metals have been at the forefront of the commodities’ space for the last several years. Gold and silver performance over the since the start of 2024 has been remarkable with gains of 123% and 201%, respectively. Compared to the S&P 500 Index’s (SPX) return of 38%, it’s easy to see why precious metals gained so much attention. Focusing on gold, its run higher was nearly unabated until the end of January. Pullbacks were mild and short-lived, but we have undoubtedly seen a change in character over the last few weeks. This could very well be due to derisking across assets as the conflict in Iran is approaching its fourth week, but it should be noted for those that may have significant allocations to precious metals. While the performance for the SPDR Gold Trust (GLD) has not been good of late, it is still in the black for the year with a return of 7.59% and has an outstanding fund score of 5.50. So, all is not lost for precious metals investors. However, recent movement should raise some eyebrows simply due to the different nature of movement than what has been the case for some time. A few major support levels to watch on GLD are $400, $370, and $365. In addition to support, keep a close eye on GLD’s fund score for any deterioration as it has not had a fund score below 3.0 since November 2022.

While the underlying commodity still has strong long-term technical readings, gold miners have deteriorated considerably in the month of March. The VanEck Gold Miners ETF (GDX) fell 28% so far in March and its near-perfect fund score has dropped below the acceptable 3.0 threshold. Along with a string of three consecutive sell signals a break into a negative trend, the technical picture is concerning at best. GDX is trading near support and has a heavily overbought/oversold reading of -76%, so there are conditions for a bounce. Nonetheless, the evidence suggests avoiding exposure to gold miners currently. The big question is if the miners are a leading indicator for the commodity itself. GLD and GDX have a monthly correlation of 0.92 over the last three years, so they are usually moving in the same direction. While the two have moved closely together, GDX has about 2.5x the rRisk as GLD, so it is much susceptible to big swings in both price and fund score. In the big picture, it seems better to put more weight on the state of gold rather than the miners, but they are still worth watching, especially if you have any allocation to gold.


Monday’s Daily Equity Report highlighted the recent deterioration in growth, represented by the Vanguard Growth ETF (VUG), along with continued improvements in value on a relative-strength basis and strong long-term trend indicators. To expand on the evidence of value’s improvement and current strength, the graphs below show the group score history of the All Value Funds and All Growth Funds on the Asset Class Group Scores page.
March trading has seen the gap between the All Value and All Growth funds eclipse 0.60 on various days, marking the widest margin since late 2022 and early 2023. This difference follows rarefied territory reached from early December through the end of January, when both groups scored above 4 for the first time in the groups’ roughly 22-year history. The recent resurgence of the All Value Funds group above the 4 threshold and into “blue sky” territory marks the first time in 19 years that the group has shown this level of superior trend and relative-strength characteristics.

The snapshot below shows the top 25 asset groups ranking above All Value Funds on the Asset Class Group Scores page and highlights some of the smaller groups contributing to All Value’s current stature. Looking back to prior instances in the mid-2000s when All Value scored above 4, there are loose parallels to the groups currently supporting All Value. Leadership from international equities, along with rising energy strength (both in domestic equities and commodities), are two notable themes, while strength in Utilities adds another level of commonality.

Looking at the group score history of the All Value Funds, there are five notable periods in which the group remained above the 4 threshold for more than a week. Across these periods, All Value scored above 4 for an average of 77 trading days—slightly more than a quarter, assuming roughly 250 trading days per year. The longest period ran from August 2006 to March 2007 (143 trading days), or a little over six months.
The tables below show the forward performance of the Vanguard Value ETF (VTV) and the iShares EAFE Value ETF (EFV) following the five periods referenced above, when the All Value group’s score eclipsed 4. Short-, intermediate-, and long-term performance for both funds was positive overall, with the 12-month window the only horizon that included a negative instance, which encompassed early 2008. Given that there are only a handful of observable periods when All Value is above 4, there is limited additional insight to draw beyond the loose parallels in leadership noted above.
Since moving above the 4 threshold on December 3 of last year, the All Value group has remained above the threshold for more than 70 trading days, just shy of the average noted above. Since early December, VTV and EFV have gained 3.09% and 3.85%, respectively, and are up 2.63% and 2.87% year to date. From here, the All Value Funds group would need to sustain a score above 4 for roughly another 73 trading days to surpass the longest streak (late 2006 to early 2007) and push the leadership trend further into rarefied territory.

| Symbol | Name | Price | Yield | PnF Trend | RS Signal | RS Col. | Fund Score | 200 Day MA | Weekly Mom |
|---|---|---|---|---|---|---|---|---|---|
| DIA | State Street SPDR Dow Jones Industrial Average ETF Trust | 461.06 | 1.40 | Positive | Sell | X | 3.26 | 465.69 | - 6W |
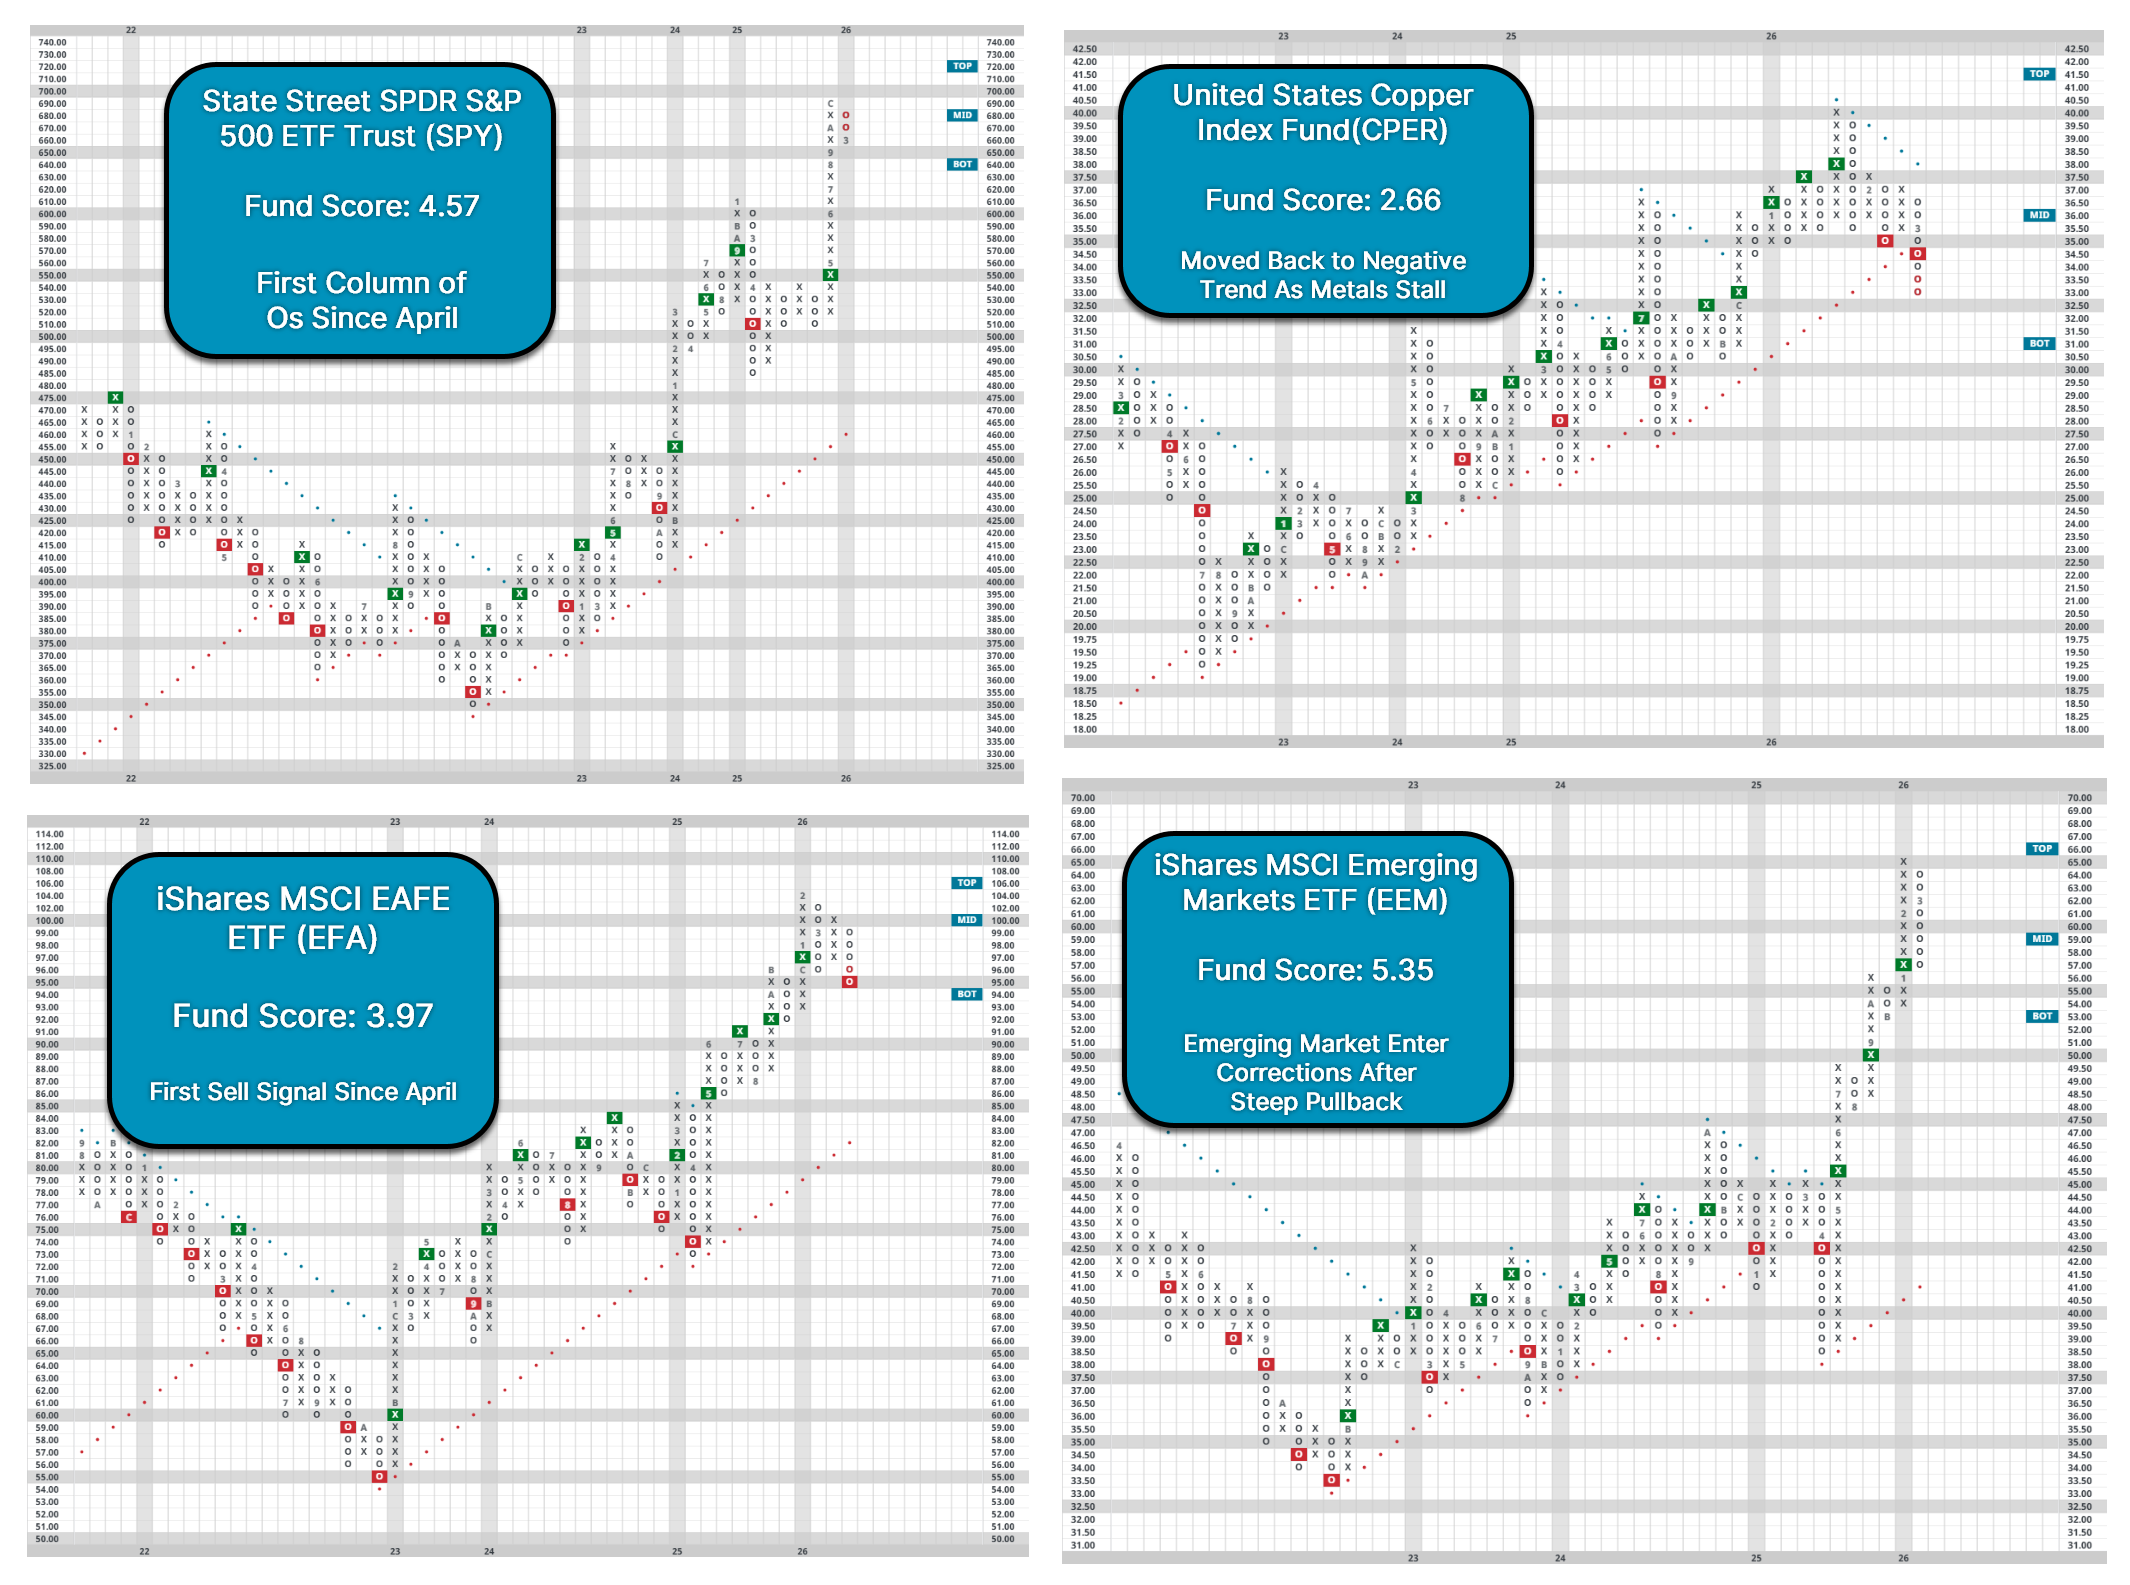
| EEM | iShares MSCI Emerging Markets ETF | 57.62 | 1.94 | Positive | Buy | X | 5.35 | 53.66 | - 3W |
| EFA | iShares MSCI EAFE ETF | 96.52 | 3.08 | Positive | Sell | X | 3.97 | 94.58 | - 3W |
| IJH | iShares S&P MidCap 400 Index Fund | 67.35 | 1.25 | Positive | Buy | O | 4.22 | 65.81 | - 4W |
| IJR | iShares S&P SmallCap 600 Index Fund | 122.77 | 1.33 | Positive | Sell | O | 3.25 | 119.14 | - 5W |
| QQQ | Invesco QQQ Trust | 593.02 | 0.46 | Positive | Buy | O | 4.24 | 592.55 | - 12W |
| RSP | Invesco S&P 500 Equal Weight ETF | 193.32 | 1.53 | Positive | Sell | O | 2.95 | 190.17 | - 3W |
| SPY | State Street SPDR S&P 500 ETF Trust | 659.80 | 1.06 | Positive | Buy | X | 4.57 | 660.10 | - 12W |
| XLG | Invesco S&P 500 Top 50 ETF | 55.31 | 0.67 | Positive | Buy | O | 3.84 | 56.46 | - 12W |

Average Level
-28.88
| < - -100 | -100 - -80 | -80 - -60 | -60 - -40 | -40 - -20 | -20 - 0 | 0 - 20 | 20 - 40 | 40 - 60 | 60 - 80 | 80 - 100 | 100 - > |
|---|---|---|---|---|---|---|---|---|---|---|---|
|
Sell signallqd
|
|||||||||||
|
Sell signalagg
|
|||||||||||
|
Buy signalfxe
|
|||||||||||
|
Sell signalONEQ
|
|||||||||||
|
Buy signalrsp
|
|||||||||||
|
Buy signaliwm
|
|||||||||||
|
Sell signalefa
|
Sell signalVOOG
|
Sell signalGLD
|
|||||||||
|
Buy signaldia
|
Sell signalXLG
|
Buy signalijr
|
Buy signalief
|
||||||||
|
Buy signalshy
|
Buy signalVOOV
|
Buy signalIJH
|
Buy signaldvy
|
Buy signalGCC
|
Buy signalUSO
|
||||||
|
Buy signalhyg
|
Buy signalSPY
|
Buy signalQQQ
|
Buy signalEEM
|
Sell signaltlt
|
Buy signalicf
|
Buy signaldx/y
|
Buy signalGSG
|
||||
| < - -100 | -100 - -80 | -80 - -60 | -60 - -40 | -40 - -20 | -20 - 0 | 0 - 20 | 20 - 40 | 40 - 60 | 60 - 80 | 80 - 100 | 100 - > |
| AGG | iShares US Core Bond ETF |
| USO | United States Oil Fund |
| DIA | SPDR Dow Jones Industrial Average ETF |
| DVY | iShares Dow Jones Select Dividend Index ETF |
| DX/Y | NYCE U.S.Dollar Index Spot |
| EFA | iShares MSCI EAFE ETF |
| FXE | Invesco CurrencyShares Euro Trust |
| GLD | SPDR Gold Trust |
| GSG | iShares S&P GSCI Commodity-Indexed Trust |
| HYG | iShares iBoxx $ High Yield Corporate Bond ETF |
| ICF | iShares Cohen & Steers Realty ETF |
| IEF | iShares Barclays 7-10 Yr. Tres. Bond ETF |
| LQD | iShares iBoxx $ Investment Grade Corp. Bond ETF |
| IJH | iShares S&P 400 MidCap Index Fund |
| ONEQ | Fidelity Nasdaq Composite Index Track |
| QQQ | Invesco QQQ Trust |
| RSP | Invesco S&P 500 Equal Weight ETF |
| IWM | iShares Russell 2000 Index ETF |
| SHY | iShares Barclays 1-3 Year Tres. Bond ETF |
| IJR | iShares S&P 600 SmallCap Index Fund |
| SPY | SPDR S&P 500 Index ETF Trust |
| TLT | iShares Barclays 20+ Year Treasury Bond ETF |
| GCC | WisdomTree Continuous Commodity Index Fund |
| VOOG | Vanguard S&P 500 Growth ETF |
| VOOV | Vanguard S&P 500 Value ETF |
| EEM | iShares MSCI Emerging Markets ETF |
| XLG | Invesco S&P 500 Top 50 ETF |
| Symbol | Company | Sector | Current Price | Action Price | Target | Stop | Notes |
|---|---|---|---|---|---|---|---|
| ABBV | AbbVie Inc. | Drugs | $206.23 | 210s - low 230s | 284 | 188 | 5 for 5'er, favored DRUG sector, LT pos peer & mkt RS, breakout from consec sell signals, 2.9% yield |
| AB | AllianceBernstein Holding LP | Wall Street | $37.46 | low 40s | 64 | 32 | 3 TA rating, LT mkt RS buy, LT pos trend, top 50% of WALL sector matrix, consec buy signals, buy-on-pullback, yield > 8% |
| CACI | CACI International Inc. | Computers | $612.93 | 570s - 600s | 672 | 528 | 5 for 5'er, top 25% of COMP sector matrix, LT pos mkt RS, triple top breakout |
| WBS | Webster Financial Corporation | Banks | $68.74 | hi 60s - low 70s | 91 | 58 | 4 for 5'er, top 25% of BANK sector matrix, one box from peer RS buy, buy on pullback, 2.2% yield |
| CGON | CG Oncology, Inc. | Biomedics/Genetics | $65.86 | hi 50s - low 60s | 80 | 50 | 5 for 5'er, 18 of 162 in BIOM sector matrix, bullish catapult, good R-R, Earn. 3/26 |
| RTX | RTX Corp. | Aerospace Airline | $200.73 | upper 190s to mid 210s | 254 | 166 | 4/5'er; top third of Aero matrix; Peer RS within 1 box of RS buy; ATHs on 3/2. |
| COCO | Vita Coco Company, Inc. | Food Beverages/Soap | $53.98 | mid-to-hi 50s | 72 | 48 | 5 for 5'er, top half of FOOD sector matrix, LT pos peer & mkt RS, pos trend flip |
| DGII | Digi International Inc | Telephone | $49.06 | upper 40s to lower 50s | 61 | 40 | 5 for 5'er; top quartile of Telephone matrix; buy signal since May '25, pos. trend since June '25. |
| ASND | Ascendis Pharma A/S | Biomedics/Genetics | $223.82 | 220s - low 230s | 282 | 188 | 4 for 5'er, top third of BIOM sector matrix, LT pos peer & mkt RS, bullish triangle, buy on pullback |
| BRX | Brixmor Property Group Inc | Real Estate | $29.50 | hi 20s - lo 30s | 38 | 24 | 4 for 5'er, top third of REAL sector matrix, LT pos peer & mkt RS, LT pos trend, bullish triangle, 4% yield |
| CNX | CNX Resources Corp | Oil | $40.61 | hi 30s - mid 40s | 71 | 33 | 5 TA rating, top 50% of OIL sector matrix, LT RS buy and pos trend, consec buy signals |
| FFIV | F5 Inc. | Internet | $290.30 | 280s - 290s | 344 | 256 | 4 for 5'er, top third of INET sector matrix, LT pos peer RS, spread quad top |
| INVA | Innoviva, Inc | Drugs | $22.08 | lo-mid 20s | 32.50 | 18.50 | 5 TA rating, top half of drugs sector RS matrix, LT pos trend, LT RS buy, buy-on-pullback |
| ORKA | Oruka Therapeutics Inc. | Biomedics/Genetics | $38.82 | mid-to-hi 30s | 57 | 30 | 5 for 5'er, top 10% of BIOM sector marix, quadruple top, buy on pullback, R-R>2.0 |
| Symbol | Company | Sector | Current Price | Action Price | Target | Stop | Notes |
|---|---|---|---|---|---|---|---|
| CPRT | Copart Incorporated | Autos and Parts | $32.52 | hi 30s | 28 | 42 | 1 TA rating, bottom 50% of AUTO sector matrix, NT and mkt RS sell last month, consec sell signals |
| Symbol | Company | Sector | Current Price | Action Price | Target | Stop | Notes |
|---|---|---|---|---|---|---|---|
| MCK | McKesson Corporation | Drugs | $898.95 | 896-hi 970s | 1304 | 752 | MCK has fallen to a sell signal. OK to hold here. Maintain $752 stop. |
| Comment | |||||||
|---|---|---|---|---|---|---|---|
|
|
|||||||
ORKA Oruka Therapeutics Inc. R ($38.85) - Biomedics/Genetics - ORKA is a 5 for 5'er that ranks in the decile of the biomedics/genetics sector matrix. In last week's trading, ORKA gave a second consecutive buy signal when it broke a quadruple top at $37 and continued higher to $42. ORKA has subsequently pulled back to just above its prior consolidation range, offering an entry point for long exposure. Positions may be added in the mid to upper $30s and we will set our initial stop at $30, which would take out two levels of support on ORKA's default chart. We will use the bullish price objective, $57, as our target price, giving us a reward-to-risk ratio north of 2.0.
| 26 | |||||||||||||||||||||||||||||
| 42.00 | X | 42.00 | |||||||||||||||||||||||||||
| 41.00 | X | O | 41.00 | ||||||||||||||||||||||||||
| 40.00 | X | O | 40.00 | ||||||||||||||||||||||||||
| 39.00 | X | O | 39.00 | ||||||||||||||||||||||||||
| 38.00 | X | O | 38.00 | ||||||||||||||||||||||||||
| 37.00 | X | 37.00 | |||||||||||||||||||||||||||
| 36.00 | X | X | X | X | 36.00 | ||||||||||||||||||||||||
| 35.00 | X | O | X | O | X | O | X | 35.00 | |||||||||||||||||||||
| 34.00 | X | O | X | O | X | O | X | 34.00 | |||||||||||||||||||||
| 33.00 | X | O | X | 3 | X | O | X | Mid | 33.00 | ||||||||||||||||||||
| 32.00 | X | X | X | 2 | X | O | O | 32.00 | |||||||||||||||||||||
| 31.00 | X | X | O | X | O | X | O | 31.00 | |||||||||||||||||||||
| 30.00 | X | O | X | O | X | O | X | 30.00 | |||||||||||||||||||||
| 29.00 | X | X | X | X | O | X | O | X | O | X | 29.00 | ||||||||||||||||||
| 28.00 | X | O | X | O | X | O | X | C | X | O | 1 | X | 28.00 | ||||||||||||||||
| 27.00 | X | O | X | O | X | O | X | O | O | X | 27.00 | ||||||||||||||||||
| 26.00 | X | O | B | O | O | • | 26.00 | ||||||||||||||||||||||
| 25.00 | X | • | 25.00 | ||||||||||||||||||||||||||
| 24.00 | X | • | 24.00 | ||||||||||||||||||||||||||
| 23.00 | X | • | 23.00 | ||||||||||||||||||||||||||
| 22.00 | X | • | Bot | 22.00 | |||||||||||||||||||||||||
| 21.00 | X | • | 21.00 | ||||||||||||||||||||||||||
| 20.00 | X | A | • | 20.00 | |||||||||||||||||||||||||
| 19.50 | X | O | X | • | 19.50 | ||||||||||||||||||||||||
| 19.00 | • | X | O | X | • | 19.00 | |||||||||||||||||||||||
| 18.50 | X | • | X | O | • | 18.50 | |||||||||||||||||||||||
| 18.00 | X | O | • | X | • | 18.00 | |||||||||||||||||||||||
| 17.50 | X | O | • | X | • | 17.50 | |||||||||||||||||||||||
| 17.00 | X | O | X | X | • | 17.00 | |||||||||||||||||||||||
| 16.50 | X | O | X | O | X | • | 16.50 | ||||||||||||||||||||||
| 16.00 | X | O | X | O | X | • | 16.00 | ||||||||||||||||||||||
| 15.50 | X | O | O | X | • | 15.50 | |||||||||||||||||||||||
| 15.00 | O | • | 15.00 | ||||||||||||||||||||||||||
| 26 |

| DELL Dell Technologies Inc Class C ($163.12) - Computers - DELL advanced Friday to break a double top at $158, notching a second consecutive buy signal before reaching $168 intraday. This 5 for 5'er moved back to a positive trend last month and sits in the top quintile of the computers sector RS matrix. The weight of the technical evidence is favorable and improving. However, DELL is now in overbought territory and at resistance from last November. Those looking for long exposure may consider waiting for a pullback or normalization of the trading band. Initial support can be seen at $148 and $138. |
| EMN Eastman Chemical Company ($65.33) - Chemicals - EMN returned to a sell signal Friday when it broke a triple bottom at $65. The move adds to an already weak technical picture as EMN is a 1 for 5'er and ranks in the bottom half of the chemicals sector matrix. |
| FDX FedEx Corporation ($358.33) - Aerospace Airline - FDX broke higher today, returning to a buy signal on its default chart on strong earnings. With the move, intraday action as high as $380 leaves the name without resistance until all-time highs from February. Throughout the day, markets drifted lower leaving the 4/5'er likely to reverse back into O's on market open on Monday. Despite this, the technical picture for the name is still quite strong... but there does appear to be a fair bit of market risk involved as domestic equities seem to be rolling over a bit... at least in the near term. |
| GOLF Acushnet Holdings Corp ($89.65) - Leisure - GOLF broke a double bottom at $91 to complete a bearish traingle for a third sell signal as shares fell to $90. The move violates the bullish support line, which will drop the stock down to a 4 for 5'er trading in a negative trend. Support lies at current levels, while additional lies at $80 and in the upper $70 range. |
| SMCI Super Micro Computer, Inc. ($21.16) - Computers - SMCI fell Friday to break a sextuple bottom at $29 before dropping over 30% intraday to a multi-year low of $22. This 1 for 5'er has been in a negative trend since last October and moved to an RS sell signal in November. The weight of the technical evidence is weak and deteriorating. Avoid long exposure. Those with current positions should note the stock is in a heavily oversold position, increasing the potential for a sell-on-rally opportunity. Overhead resistance may be seen at $33. |
| VST Vistra Corp ($151.71) - Utilities/Electricity - VST broke a triple bottom at $154 to return to a sell signal as share fell $152, violating the bullish support line. This marks the ninth trend chart on the point and figure chart since late 2025 and brings the stock down to levels not seen since early February. With the trendline violation, VST will drop down to a 3 technical attribute stock. Support for the stock now lies at $140, the February chart low. |
| Name | Option Symbol | Action | Stop Loss |
|---|---|---|---|
| Archer-Daniels-Midland Company - $66.17 | O: 26E65.00D15 | Buy the May 65.00 calls at 4.70 | 62.00 |
| Name | Option | Action |
|---|---|---|
|
|
||
| Name | Option Symbol | Action | Stop Loss |
|---|---|---|---|
| Apollo Global Management Inc. - $112.00 | O: 26Q115.00D15 | Buy the May 115.00 puts at 11.00 | 120.00 |
| Name | Option | Action |
|---|---|---|
| Chipotle Mexican Grill 'A' ( CMG) | Mar. 37.50 Puts | Expired at 4.13. |
| General Mills, Inc. ( GIS) | Apr. 45.00 Puts | Raise the option stop loss to 6.00 (CP: 8.00) |
| Tractor Supply Company ( TSCO) | Apr. 55.00 Puts | Raise the option stop loss to 6.20 (CP: 8.20) |
| Abbott Laboratories ( ABT) | Aug. 115.00 Puts | Raise the option stop loss to 9.20 (CP: 11.20) |
| PepsiCo, Inc. ( PEP) | Jul. 160.00 Puts | Raise the option stop loss to 11.45 (CP: 13.45) |
| Amazon.com Inc. ( AMZN) | Jun. 205.00 Puts | Initiate an option stop loss of 12.20 (CP: 14.20) |
| Name | Option Sym. | Call to Sell | Call Price | Investment for 500 Shares | Annual Called Rtn. | Annual Static Rtn. | Downside Protection |
|---|---|---|---|---|---|---|---|
| Invesco PLC $ 23.31 | O: 26E24.00D15 | May. 24.00 | 1.25 | $ 11,102.30 | 45.89% | 29.51% | 4.33% |
| Name | Action |
|---|---|
| Intel Corporation ( INTC) - 46.18 | Sell the May 49.00 Calls. |
| Micron Technology, Inc. ( MU) - 444.27 | Sell the June 420.00 Calls. |
| Moderna, Inc. ( MRNA) - 52.37 | Sell the April 55.00 Calls. |
| Fortinet Inc. ( FTNT) - 83.12 | Sell the May 85.00 Calls. |
| Celanese Corporation ( CE) - 60.33 | Sell the April 60.00 Calls. |
| Dell Technologies Inc Class C ( DELL) - 156.76 | Sell the July 160.00 Calls. |
| Name | Covered Write |
|---|---|
|
|
|
Daily Equity & Market Analysis
Loading, Please Wait...
