Most Requested Symbols

However, relative strength has much larger scope than just point and figure charting, and with that in mind, we’ve recently added the capability to chart RS relationships on a line chart along with the ability to put over some indicators, like moving averages.
Copper moved higher against gold recently, earning positive relative strength. We observe copper vs. gold in a vacuum before zooming out and comparing both to the broad market.
Weekly Rundown Video - March 18, 2026
Weekly rundown with NDW analyst team covering all major asset classes.
Weekly rundown with NDW analyst team covering all major asset classes.
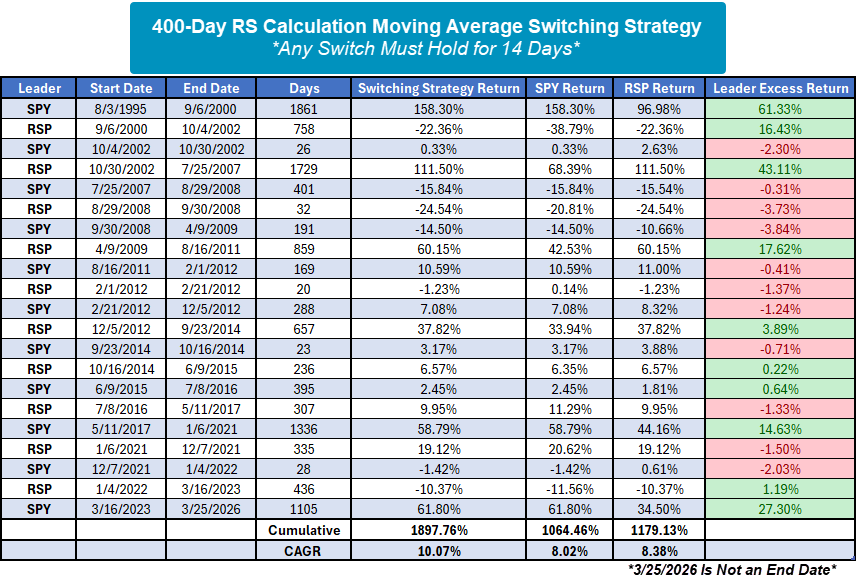
Relative strength (RS) relationships are a core component of how we judge markets. Charting RS values on point and figure charts to garner information about leadership has been a primary focus of ours for years and will continue to be so. However, relative strength has much larger scope than just point and figure charting, and with that in mind, we’ve recently added the capability to chart RS relationships on a line chart along with the ability to put over some indicators, like moving averages. As an example, the chart below shows the RS value between SPY and RSP (cap-weight S&P 500 vs equal-weight S&P 500) as well as its 400-day moving average. If the RS value is above its 400-day moving average, then SPY is in the lead. If the RS value is below its 400-day moving average, then RSP is in the lead. A 400-day moving average is roughly two years of trading data, so this is still focused on long-term trends. Any period can be used when adding a moving average to a line or RS line chart, but for today we’ll focus on a long-term view.

Running a simple switching strategy based on whether the SPY/RSP relative strength calculation is above or below its 400-day moving average. For this strategy, we put in a 14-day rule which limits switching to only those instances when a moving average cross lasted for at least 14 calendar days. This drastically reduced unnecessary changes, although there were still a handful of short-lived trades. Despite a few head fakes and unsuccessful trades, the switching strategy outperformed buying and holding either SPY or RSP by a large margin. One noticeable point from the switching strategy is that none of the “unsuccessful” trades underperformed by more than 4%. If the strategy was “wrong” then it corrected the mistake before much damage was done. On the other hand, the successful trades had much greater outperformance than the unsuccessful trades had underperformance. This gets back to a core tenant of momentum or relative strength investing, cutting the losers short and holding onto the winners if they continue to lead.

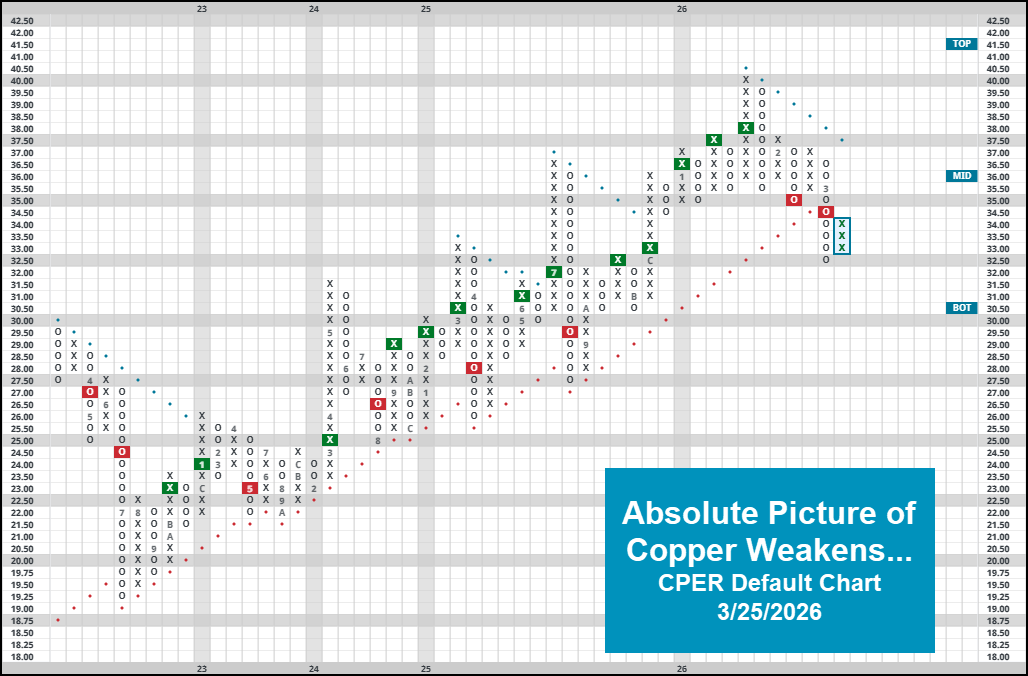
Lots of recent research has detailed some emerging relative weakness stemming from the precious metals space. While positive action on 3/25 driven largely by a possible near-term ceasefire in the Middle East sent global markets higher for the day, there is no question from looking at individual precious metal technical pictures that the space is struggling. To add to that picture today, we will highlight a recent RS change between copper & gold. Before going further, its worth mentioning that the overall technical picture for copper representative CPER is still quite weak. In fact, the fund most recently completed a bearish catapult on its default chart, moving back into a negative trend in the process. Now earning a meager 2.54 fund score as of 3/25, the path of least resistance for copper-at least on an absolute basis- is lower.
Zooming out for a moment, we can remind ourselves of the definition of “positive relative strength.” Of course, everyone is familiar with buying an asset going up more than its respective benchmark, that’s the “easy” definition. Conversely, buying an asset that goes down less than its benchmark would also be considered positive relative strength. Positive relative strength can be analyzed over different timeframes/sensitivities, an important detail to keep in mind when trying to figure out which asset is gaining/losing strength.
We will start with a 3.25% PnF chart between CPER & GLD. Gold’s recent weakness allowed copper to reverse back higher into X’s on this chart, symbolizing near-term relative strength for the more industrial-based metal… although gold has maintained its share of long-term strength since mid-2024. It’s worth noting that, historically speaking, we have seen gold mainly take over during periods of economic contraction (note dotcom bubble and GFC) while copper has led during times of general expansion. Now- its safe to say that more recent trends haven’t followed suit as precious metals have stormed forwards over the last few years alongside other risk on assets, but the longer-term picture remains intact. Those following an RS Switching strategy (owning whichever asset in on an RS buy signal) have outperformed a simple buy and hold strategy of either asset on their own.
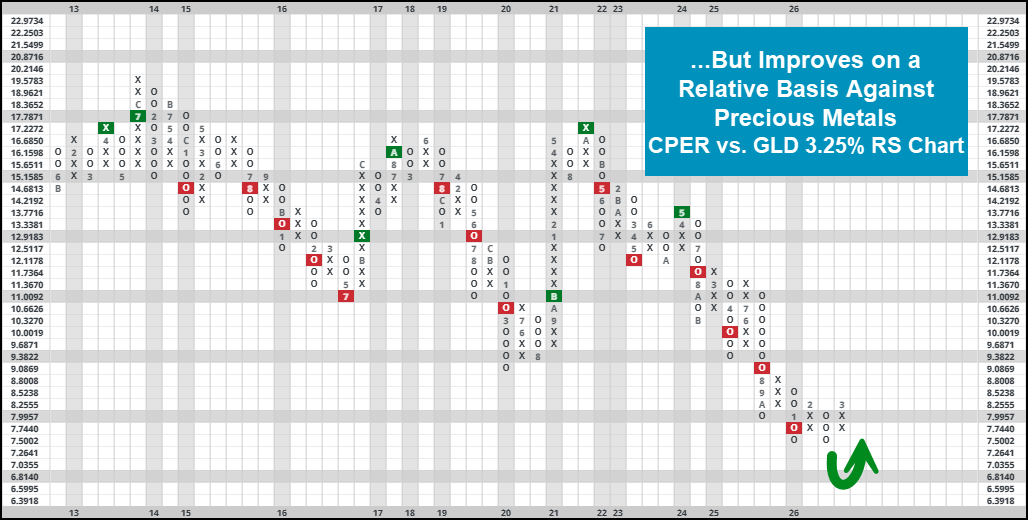
Converting this relationship into a line chart for the physical commodities (compared to ETF representatives) over time, we can see that story play out through a different view. Using data spanning back to 1993, the copper/gold ratio (price of copper/price of gold) has been on a steep decline since the most recent bull market began in late 2022/2023. Zooming out even further, the ratio is near all-time lows- signaling leadership from gold as you would expect…. Particularly over the last few years. As trend followers, we would ultimately expect this continue going forward, at least until we are convinced otherwise.

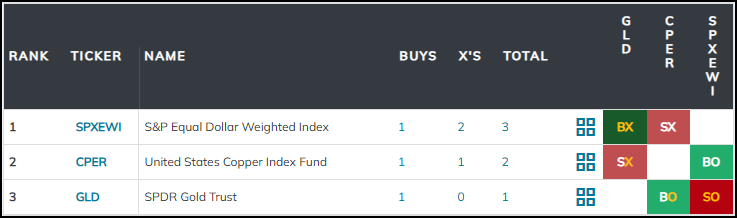
Finally, we will wrap up our piece with a reminder that performance (and subsequent leadership) is all relative. Remember, there will always be an identified leader between two stocks, even if both of them are names that are weakening (i.e., gold & copper have both weakened, but gold still looks “better”). To combat this, we can utilize the matrix methodology to run a larger batch of RS tests for a wider universe. To demonstrate this, we threw GLD & CPER into a matrix with broad S&P 500 representative SPXEWI. In this case, SPXEWI lands at the top of the heap, re-establishing itself against GLD with recent action. We could run a similar test adding in different representatives from different broad asset classes (take international or fixed income names, for instance) to gradually build out a wide matrix based ranking system. This is similar to the overall DALI rankings, and can be used to help guide your hand when it comes to broader asset allocation. As always, set alerts on key relationships to be notified of any changes as they occur.
Each week the analysts at NDW review and comment on all major asset classes in the global markets. Shown below is the summary or snapshot of the primary technical indicators we follow for multiple areas. Should there be changes mid-week we will certainly bring these to your attention via the report.
| Universe | BP Col & Level (actual) | BP Rev Level | PT Col & Level (actual) | PT Rev Level | HiLo Col & Level (actual) | HiLo Rev Level | 10 Week Col & Level (actual) | 10 Week Rev Level | 30 Week Col & Level (actual) | 30 Week Rev Level |
|---|---|---|---|---|---|---|---|---|---|---|
| ALL |
|
40% |
|
44% |
|
34% |
|
30% |
|
40% |
| NYSE |
|
46% |
|
54% |
|
42% |
|
30% |
|
46% |
| OTC |
|
38% |
|
38% |
|
30% |
|
30% |
|
38% |
| World |
|
38% |
|
46% |
|
|
|
30% |
|
44% |

Remember, these are technical comments only. Just as you must be aware of fundamental data for the stocks we recommend based on technical criteria in the report, so too must you be aware of important data regarding delivery, market moving government releases, and other factors that may influence commodity pricing. We try to limit our technical comments to the most actively traded contracts in advance of delivery, but some contracts trade actively right up to delivery while others taper off well in advance. Be sure you check your dates before trading these contracts. For questions regarding this section or additional coverage of commodities email james.west@nasdaq.com.
Data represented in the table below is through 3/24/2026:
| Symbol | Name | Price | PnF Trend | RS Signal | RS Col. | 200 Day MA | Weekly Mom |
|---|---|---|---|---|---|---|---|
| CL/ | Crude Oil Continuous | 92.35 | Positive | Sell | X | 64.84 | + 13W |
| DBLCIX | Deutsche Bank Liquid Commodities Index | 468.52 | Positive | Sell | O | 460.74 | - 37W |
| DWACOMMOD | NDW Continuous Commodity Index | 1136.90 | Positive | Buy | O | 1039.08 | + 4W |
| GC/ | Gold Continuous | 4402.00 | Positive | Buy | O | 4074.90 | - 3W |
| HG/ | Copper Continuous | 5.43 | Negative | Sell | O | 5.22 | - 9W |
| ZG/ | Corn (Electronic Day Session) Continuous | 462.50 | Positive | Sell | O | 423.84 | + 5W |

Average Level
-40.12
| < - -100 | -100 - -80 | -80 - -60 | -60 - -40 | -40 - -20 | -20 - 0 | 0 - 20 | 20 - 40 | 40 - 60 | 60 - 80 | 80 - 100 | 100 - > |
|---|---|---|---|---|---|---|---|---|---|---|---|
|
Sell signaldia
|
Sell signalONEQ
|
||||||||||
|
Sell signallqd
|
Sell signalVOOG
|
||||||||||
|
Sell signalefa
|
Buy signalrsp
|
||||||||||
|
Sell signalief
|
Sell signaltlt
|
||||||||||
|
Sell signalXLG
|
Sell signalQQQ
|
Buy signalicf
|
|||||||||
|
Buy signalSPY
|
Buy signalEEM
|
Buy signalijr
|
|||||||||
|
Buy signalshy
|
Buy signalVOOV
|
Buy signalfxe
|
Buy signalIJH
|
Buy signalUSO
|
|||||||
|
Buy signalhyg
|
Sell signalagg
|
Sell signalgld
|
Buy signaliwm
|
Buy signaldvy
|
Buy signalGCC
|
Buy signaldx/y
|
Buy signalGSG
|
||||
| < - -100 | -100 - -80 | -80 - -60 | -60 - -40 | -40 - -20 | -20 - 0 | 0 - 20 | 20 - 40 | 40 - 60 | 60 - 80 | 80 - 100 | 100 - > |
| AGG | iShares US Core Bond ETF |
| USO | United States Oil Fund |
| DIA | SPDR Dow Jones Industrial Average ETF |
| DVY | iShares Dow Jones Select Dividend Index ETF |
| DX/Y | NYCE U.S.Dollar Index Spot |
| EFA | iShares MSCI EAFE ETF |
| FXE | Invesco CurrencyShares Euro Trust |
| GLD | SPDR Gold Trust |
| GSG | iShares S&P GSCI Commodity-Indexed Trust |
| HYG | iShares iBoxx $ High Yield Corporate Bond ETF |
| ICF | iShares Cohen & Steers Realty ETF |
| IEF | iShares Barclays 7-10 Yr. Tres. Bond ETF |
| LQD | iShares iBoxx $ Investment Grade Corp. Bond ETF |
| IJH | iShares S&P 400 MidCap Index Fund |
| ONEQ | Fidelity Nasdaq Composite Index Track |
| QQQ | Invesco QQQ Trust |
| RSP | Invesco S&P 500 Equal Weight ETF |
| IWM | iShares Russell 2000 Index ETF |
| SHY | iShares Barclays 1-3 Year Tres. Bond ETF |
| IJR | iShares S&P 600 SmallCap Index Fund |
| SPY | SPDR S&P 500 Index ETF Trust |
| TLT | iShares Barclays 20+ Year Treasury Bond ETF |
| GCC | WisdomTree Continuous Commodity Index Fund |
| VOOG | Vanguard S&P 500 Growth ETF |
| VOOV | Vanguard S&P 500 Value ETF |
| EEM | iShares MSCI Emerging Markets ETF |
| XLG | Invesco S&P 500 Top 50 ETF |

| Symbol | Company | Sector | Current Price | Action Price | Target | Stop | Notes |
|---|---|---|---|---|---|---|---|
| WBS | Webster Financial Corporation | Banks | $68.67 | hi 60s - low 70s | 91 | 58 | 4 for 5'er, top 25% of BANK sector matrix, one box from peer RS buy, buy on pullback, 2.2% yield |
| CGON | CG Oncology, Inc. | Biomedics/Genetics | $63.86 | hi 50s - low 60s | 80 | 50 | 5 for 5'er, 18 of 162 in BIOM sector matrix, bullish catapult, good R-R, Earn. 3/26 |
| COCO | Vita Coco Company, Inc. | Food Beverages/Soap | $54.71 | mid-to-hi 50s | 72 | 48 | 5 for 5'er, top half of FOOD sector matrix, LT pos peer & mkt RS, pos trend flip |
| DGII | Digi International Inc | Telephone | $49.61 | upper 40s to lower 50s | 61 | 40 | 5 for 5'er; top quartile of Telephone matrix; buy signal since May '25, pos. trend since June '25. |
| BRX | Brixmor Property Group Inc | Real Estate | $28.72 | hi 20s - lo 30s | 38 | 24 | 4 for 5'er, top third of REAL sector matrix, LT pos peer & mkt RS, LT pos trend, bullish triangle, 4% yield |
| CNX | CNX Resources Corp | Oil | $40.46 | hi 30s - mid 40s | 71 | 33 | 5 TA rating, top 50% of OIL sector matrix, LT RS buy and pos trend, consec buy signals |
| FFIV | F5 Inc. | Internet | $289.29 | 280s - 290s | 344 | 256 | 4 for 5'er, top third of INET sector matrix, LT pos peer RS, spread quad top |
| INVA | Innoviva, Inc | Drugs | $21.92 | lo-mid 20s | 32.50 | 18.50 | 5 TA rating, top half of drugs sector RS matrix, LT pos trend, LT RS buy, buy-on-pullback |
| ARCB | ArcBest Corp. | Transports/Non Air | $94.79 | low-to-mid 90s | 113 | 79 | 4 for 5'er, one box from market RS buy, top half of favored TRAN sector matrix, good R-R |
| GSK | GlaxoSmithKline Plc. (United Kingdom) ADR | Drugs | $52.95 | hi 40s - mid 50s | 67 | 42 | 5 TA rating, top 25% of DRUG sector matrix, LT pos trend, yield > 3%, buy-on-pullback |
| ADI | Analog Devices, Inc. | Semiconductors | $321.83 | 310s - 330s | 380 | 268 | 4 for 5'er, top half of favored SEMI sector matrix, LT pos market RS, return to buy signal |
| Symbol | Company | Sector | Current Price | Action Price | Target | Stop | Notes |
|---|---|---|---|---|---|---|---|
| CPRT | Copart Incorporated | Autos and Parts | $32.84 | hi 30s | 28 | 42 | 1 TA rating, bottom 50% of AUTO sector matrix, NT and mkt RS sell last month, consec sell signals |
| Symbol | Company | Sector | Current Price | Action Price | Target | Stop | Notes |
|---|---|---|---|---|---|---|---|
| ORKA | Oruka Therapeutics Inc. | Biomedics/Genetics | $39.91 | mid-to-hi 30s | 57 | 30 | ORKA has moved into heavily overbought territory. OK to hold here. Raise stop to $37. |
| Comment | |||||||
|---|---|---|---|---|---|---|---|
|
|
|||||||
ADI Analog Devices, Inc. R ($322.43) - Semiconductors - ADI is a 4 for 5'er that ranks in the top half of the favored semiconductors sector matrix and has been on a market RS buy signal since 2016. After giving two consecutive buy signals, ADI returned to a buy signal this week when it broke a double top at $320. Long exposure may be added in the $310s to $330s and we will set our initial stop at $268, which would take out multiple levels of support on ADI's chart. We will use the bullish price objective, $380, as our target price.
| 26 | |||||||||||||||||||||||||||||
| 360.00 | X | 360.00 | |||||||||||||||||||||||||||
| 356.00 | X | O | 356.00 | ||||||||||||||||||||||||||
| 352.00 | X | X | O | 352.00 | |||||||||||||||||||||||||
| 348.00 | X | O | X | O | 348.00 | ||||||||||||||||||||||||
| 344.00 | X | O | X | 3 | 344.00 | ||||||||||||||||||||||||
| 340.00 | X | O | O | 340.00 | |||||||||||||||||||||||||
| 336.00 | X | O | 336.00 | ||||||||||||||||||||||||||
| 332.00 | X | O | 332.00 | ||||||||||||||||||||||||||
| 328.00 | X | O | 328.00 | ||||||||||||||||||||||||||
| 324.00 | X | O | X | 324.00 | |||||||||||||||||||||||||
| 320.00 | 2 | O | X | X | Mid | 320.00 | |||||||||||||||||||||||
| 316.00 | X | O | X | O | X | X | 316.00 | ||||||||||||||||||||||
| 312.00 | X | O | X | O | X | O | X | 312.00 | |||||||||||||||||||||
| 308.00 | X | X | O | O | X | O | X | 308.00 | |||||||||||||||||||||
| 304.00 | X | O | X | O | O | 304.00 | |||||||||||||||||||||||
| 300.00 | X | O | X | 300.00 | |||||||||||||||||||||||||
| 296.00 | X | O | 296.00 | ||||||||||||||||||||||||||
| 292.00 | X | 292.00 | |||||||||||||||||||||||||||
| 288.00 | X | 288.00 | |||||||||||||||||||||||||||
| 284.00 | X | 1 | 284.00 | ||||||||||||||||||||||||||
| 280.00 | X | O | X | 280.00 | |||||||||||||||||||||||||
| 276.00 | X | O | X | 276.00 | |||||||||||||||||||||||||
| 272.00 | X | O | 272.00 | ||||||||||||||||||||||||||
| 268.00 | C | Bot | 268.00 | ||||||||||||||||||||||||||
| 264.00 | X | 264.00 | |||||||||||||||||||||||||||
| 260.00 | X | 260.00 | |||||||||||||||||||||||||||
| 256.00 | X | X | 256.00 | ||||||||||||||||||||||||||
| 252.00 | X | O | X | X | 252.00 | ||||||||||||||||||||||||
| 248.00 | X | O | X | O | X | X | • | 248.00 | |||||||||||||||||||||
| 244.00 | X | X | 9 | X | O | X | O | X | • | 244.00 | |||||||||||||||||||
| 240.00 | 7 | O | X | O | A | X | O | X | X | • | 240.00 | ||||||||||||||||||
| 236.00 | X | O | X | O | X | O | X | O | X | • | 236.00 | ||||||||||||||||||
| 232.00 | X | O | X | O | X | O | X | O | X | • | 232.00 | ||||||||||||||||||
| 228.00 | X | X | O | X | O | B | X | O | • | 228.00 | |||||||||||||||||||
| 224.00 | X | O | X | O | X | O | • | 224.00 | |||||||||||||||||||||
| 220.00 | X | O | 6 | 8 | • | 220.00 | |||||||||||||||||||||||
| 216.00 | X | O | X | • | 216.00 | ||||||||||||||||||||||||
| 212.00 | • | X | O | X | • | 212.00 | |||||||||||||||||||||||
| 208.00 | X | O | • | 208.00 | |||||||||||||||||||||||||
| 204.00 | X | • | 204.00 | ||||||||||||||||||||||||||
| 200.00 | X | • | 200.00 | ||||||||||||||||||||||||||
| 198.00 | X | • | 198.00 | ||||||||||||||||||||||||||
| 196.00 | X | • | 196.00 | ||||||||||||||||||||||||||
| 194.00 | O | 5 | • | 194.00 | |||||||||||||||||||||||||
| 192.00 | O | X | • | 192.00 | |||||||||||||||||||||||||
| 190.00 | O | X | • | 190.00 | |||||||||||||||||||||||||
| 188.00 | O | • | 188.00 | ||||||||||||||||||||||||||
| 26 |
| AEM Agnico-Eagle Mines Ltd. ($191.39) - Precious Metals - AEM returned to a buy signal Wednesday after giving two consecutive sell signals and successfully testing its bullish support line. Wednesday's move adds additional evidence to a modestly positive technical picture as AEM is a 3 for 5'er that ranks in the top half of the precious metals sector matrix. |
| AU AngloGold Ashanti Limited (South Africa) ADR ($89.67) - Precious Metals - AU gave a initial buy signal Wednesday after giving two consecutive sell signals and falling more than 30% from the high it reached last month. The weight of the evidence for AU is modestly positive as the stock is a 3 for 5'er that ranks in the top third of the precious metals sector matrix. From here, the first level of support sits at $83, meanwhile overhead resistance sits at $110. |
| BLK BlackRock, Inc. ($980.59) - Wall Street - BLK shares moved higher today to break a double top at $992 to mark its first buy signal. This 3 for 5'er has been in a negative trend since March but on an RS buy signal versus the market since October 2020. BLK shares are trading below the middle of their ten-week trading band with a weekly overbought/oversold reading of -49%. From here, support is offered at $928. |
| CASY Casey's General Stores Inc ($717.47) - Retailing - CASY broke a double top at $696 to return to a buy signal as shares rallied to a new all-time chart high at $712. The stock has been a 5 for 5'er since November 2025 and currently ranks within the top decile of the Retailing sector matrix. Okay to consider here on the breakout or on a pullback to the upper $600 range. Initial support lies at $656, while additional may be found at $632 and $608. |
| GM General Motors ($76.98) - Autos and Parts - GM broke a double top at $78 to end a series of four sell signals that began in February. The stock is a 5 for 5'er that ranks within the top quartile of the Autos and Parts sector matrix. Okay to consider here on the breakout. Note resistance in the lower to mid $80s. Initial support lies in the lower $70s, while additional can be found in the upper $60s. |
| HPE Hewlett Packard Enterprise Company ($26.19) - Computers - HPE rose Wednesday to break a double top at $25 before rising over 9% intraday to $26. This 3 for 5'er has been in a positive trend since last June and sits in the top third of the computers sector RS matrix. While the technical picture is still mixed, the stock is showing notable near-term improvement. However, HPE is now in overbought territory and at resistance. New longs may want to wait for a pullback or normalization in the trading band. Initial support can be seen at $20. |
| MTRN Materion Corp. ($147.47) - Chemicals - After giving four consecutive sell signals MTRN returned to a buy signal Wednesday when it broke a double top at $144. Wednesday's move adds evidence to favorable overall technical picture as MTRN is a 4 for 5'er and ranks near the middle of the chemicals sector matrix. From here, support sits at $136 while the next level of overhead resistance sits at $150. |
| NEM Newmont Corp ($101.51) - Precious Metals - NEM returned to a buy signal Wednesday amid a broad rally in precious metals stocks when it broke a double top at $102. The outlook for the stock remains negative, however, as NEM is a 1 for 5'er . Wednesday's move establishes support at $96, while overhead resistance can be found at $120, where NEM's bearish resistance line also sits. |
| SCCO Southern Copper Corporation ($165.25) - Metals Non Ferrous - After giving four consecutive sell signals, SCCO returned to a buy signal Wednesday when it broke a double top at $165. The return to a buy signal adds to a modestly positive technical outlook as SCCO is a 3 for 5'er. From here, overhead resistance sits at $178, while support can now be found at $154. |
| SPHR Sphere Entertainment Co. ($116.55) - Leisure - SPHR broke a double top at $116 to return to a buy signal. The stock is a 5 for 5'er that ranks as the top stock within the Leisure sector matrix. Okay to consider here on the breakout. Note the stock's all-time chart high at $120. Initial support lies at $106, while prior resistance around the $100 level may be seen as additional support. |
| Name | Option Symbol | Action | Stop Loss |
|---|---|---|---|
| McDonald's Corporation - $311.60 | O: 26I310.00D18 | Buy the September 310.00 calls at 22.15 | 280.00 |
| Name | Option | Action |
|---|---|---|
| Cisco Systems, Inc. ( CSCO) | Jun. 80.00 Calls | Initiate an option stop loss of 3.85 (CP: 5.85) |
| Merck & Co., Inc. ( MRK) | Jun. 115.00 Calls | Initiate an option stop loss of 7.65 (CP: 9.65) |
| Name | Option Symbol | Action | Stop Loss |
|---|---|---|---|
| PDD Holdings Inc. - $102.83 | O: 26S105.00D17 | Buy the July 105.00 puts at 10.05 | 110.00 |
| Name | Option | Action |
|---|---|---|
| General Mills, Inc. ( GIS) | Apr. 45.00 Puts | Raise the option stop loss to 7.30 (CP: 9.30) |
| PDD Holdings Inc. ( PDD) | Apr. 100.00 Puts | Stopped at 5.00 (CP: 2.37) |
| General Mills, Inc. ( GIS) | Jun. 47.50 Puts | Raise the option stop loss to 9.50 (CP: 11.50) |
| MetLife, Inc. ( MET) | Apr. 77.50 Puts | Stopped at 6.20 (CP: 5.90) |
| Best Buy Co., Inc. ( BBY) | May. 67.50 Puts | Raise the option stop loss to 5.40 (CP: 7.40) |
| Name | Option Sym. | Call to Sell | Call Price | Investment for 500 Shares | Annual Called Rtn. | Annual Static Rtn. | Downside Protection |
|---|---|---|---|---|---|---|---|
| CF Industries Holdings, Inc. $ 126.92 | O: 26D127.00D17 | Apr. 127.00 | 7.20 | $ 60,853.80 | 52.38% | 52.38% | 4.59% |
| Name | Action |
|---|---|
| Intel Corporation ( INTC) - 44.06 | Sell the May 49.00 Calls. |
| Micron Technology, Inc. ( MU) - 395.53 | Sell the June 420.00 Calls. |
| Moderna, Inc. ( MRNA) - 51.34 | Sell the April 55.00 Calls. |
| Fortinet Inc. ( FTNT) - 79.34 | Sell the May 85.00 Calls. |
| Invesco PLC ( IVZ) - 23.98 | Sell the May 24.00 Calls. |
| DuPont de Nemours Inc. ( DD) - 45.33 | Sell the May 45.00 Calls. |
| ONEOK, Inc. ( OKE) - 90.94 | Sell the July 95.00 Calls. |
| Name | Covered Write |
|---|---|
|
|
|
Daily Equity & Market Analysis
Loading, Please Wait...
