Most Requested Symbols

Following Friday’s (3/20) the Percent Positive Trend for the NYSE stock universe ([^PTNYSE]) moved to bear confirmed status and fell below 50%.
Are we going back to the 2000s?
Weekly Rundown Video - March 18, 2026
Weekly rundown with NDW analyst team covering all major asset classes.
Weekly rundown with NDW analyst team covering all major asset classes.
Last week’s action brought about a fourth consecutive week of negative performance for the S&P 500 Index (SPX) and the majority of U.S. equity indices, apart from the S&P 500 Equal Weight Index (SPXEWI), which declined for the third week in a row. Indicators from the short- to long-term have shown downward movement in response to the weak domestic equity performance. The most notable change following Friday’s (3/20) action came from the Percent Positive Trend for the NYSE stock universe (^PTNYSE), which moved to bear confirmed status and fell below 50%. The indicator now sits at its lowest level since June of last year, suggesting that fewer than half of the 1,800+ stocks in the NYSE universe maintain positive trends on their point & figure charts.
The 50% threshold for the ^PTNYSE is an important line of demarcation, serving as a barometer for broad long‑term market participation. The table below is one that we publish periodically when indicators cross notable thresholds; this edition examines the forward performance of the S&P 500 Index (SPX) following various technical moves within the ^PTNYSE indicator.
Earlier this month, the ^PTNYSE reversed into Os from the upper 50s and remains within the 40%–60% range, where short‑term returns tend to be muted while intermediate‑ to long‑term returns are positive. Forward returns while the indicator is in Os within this range are roughly in-line with returns seen when the indicator is below 50%, but they lag relative to other percentile buckets.
While the ^PTNYSE sits in a middling position on its chart—and when considering the forward returns of the S&P 500—investors should monitor whether the indicator maintains its current range of 40%–60%. As the table shows, forward returns for SPX improve when the indicator moves toward either higher or lower extremes. Elevated readings within the ^PTNYSE indicate a healthy, trending market, and the forward returns within the table support this. Meanwhile, the strongest forward returns tend to follow washed‑out readings below 30%. Current readings are still above that territory, but with the recent move below the 50% threshold, that is now among the next potential developments. Continued readings within the 40%–60% range would point toward more muted short‑ to intermediate‑term forward returns.
To stay updated on chart action within the ^PTNYSE indicator (and others), click the Clock icon in the upper left‑hand corner near the title header to set alerts.


International equities moved into correction territory last week, as the iShares MSCI ACWI ex US ETF (ACWX) fell more than 11% from its February 25th closing high through Friday, March 20th. Emerging markets (EEM) and developed markets (EFA) also dropped more than 10% from their respective highs over the past month. This deterioration marks the first correction for ACWX since the “Liberation Day”-induced decline that ended last April. While the catalysts behind these two drawdowns have been vastly different, the price action has been similar up to this point. It took ACWX 20 days to drop nearly 14% last year, while it has taken 23 days for the ETF to fall 11% this year. Aside from last year, the current decline is the fastest 10% drop for ACWX among the past 12 corrections, dating back to 2012.

There have been 47 total corrections for the broad international benchmark ACWX since the end of 1987. Comparatively, there have been only 29 such corrections for the S&P 500 Index (SPX) over the same time frame, highlighting the heightened volatility we typically see in foreign stocks. This context is important when international equities still sit at the top of our DALI asset class rankings. Even though we have seen sharp declines, we also saw sharp appreciation from most representatives heading into their recent peaks. ACWX rose to show a weekly overbought/oversold (OBOS) reading north of 100% at the beginning of February and essentially stayed in overbought territory for the entire month. The default chart of ACWX ascended in a single column from last April through this past February, notching the largest X column in the fund’s history at 26 consecutive X’s. Put plainly, international equities had gotten frothy. This correction could be exactly what this historically volatile asset class needs to normalize before further improvement.
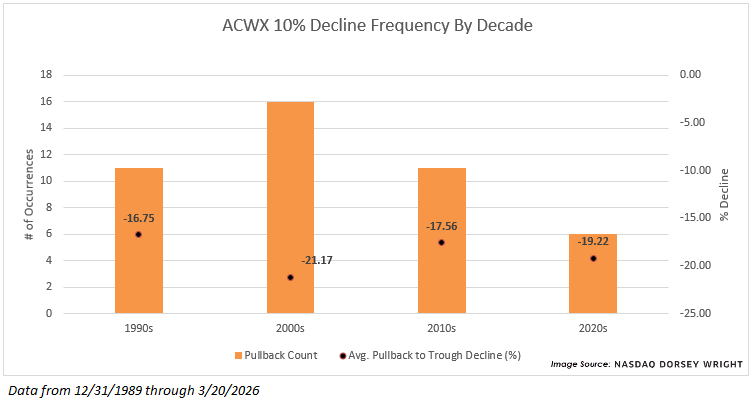
Corrections never feel good in the moment, particularly when they happen at the speed we’ve experienced over the past few weeks. It may also be confusing to see such sharp declines in the asset class that just moved back to the top position in our DALI rankings. A historical view of past corrections helps put the frequency of declines by decade into perspective, as shown in the graph below. The number of pullbacks in each decade is higher than what we would see in U.S. stocks. For comparison, the S&P 500 experienced six corrections in the 1990s, 11 in the 2000s, six in the 2010s, and six so far in the 2020s. The 2000s saw the most outperformance from international equities in recent memory, as ACWX outpaced SPX in seven of those 10 years. That decade also saw significantly more corrections, with 16 total events.
I have heard many comparisons between the current environment and the 2000s over the past few months, both in markets and geopolitics. Those comparisons make sense to a degree. Focusing on markets, we are currently looking at back-to-back years of ACWX outpacing SPX for the first time since the 2000s. The U.S. dollar (DX/Y) still sits in a long-term downtrend, as it did in the 2000s, even with the recent appreciation. Crude oil (CL/) has exploded higher with volatile price action, again like the 2000s. We cannot know for sure whether these trends are in their early stages. The 2000s saw six straight years of outperformance from ACWX, from 2002 to 2007. This is why we use a process-based approach like our DALI asset class rankings to keep us focused on the areas with the highest relative strength. Even if we see long-term strength from foreign stocks, expect that strength to be paired with further volatility.
The turbulence in international equity markets has led to rotation in our NDW Country Index matrix rankings. Nearly all countries in the matrix have changed rank since the end of February, including 17 of the top 20. Taiwan and Brazil have been the biggest improvers within the top quartile, each gaining six spots to the 6th and 7th positions, respectively. Norway has been the largest improver overall, moving up 12 positions into the top half. These could be areas to consider for focused exposure within the top asset class.

Average Level
-37.13
| < - -100 | -100 - -80 | -80 - -60 | -60 - -40 | -40 - -20 | -20 - 0 | 0 - 20 | 20 - 40 | 40 - 60 | 60 - 80 | 80 - 100 | 100 - > |
|---|---|---|---|---|---|---|---|---|---|---|---|
|
Buy signalrsp
|
|||||||||||
|
Sell signalXLG
|
|||||||||||
|
Buy signalshy
|
Sell signalief
|
||||||||||
|
Sell signaldia
|
Buy signaliwm
|
||||||||||
|
Sell signalagg
|
Sell signalONEQ
|
||||||||||
|
Sell signallqd
|
Sell signalVOOG
|
||||||||||
|
Sell signalefa
|
Buy signalIJH
|
Buy signaldvy
|
|||||||||
|
Sell signalgld
|
Buy signalijr
|
Buy signalfxe
|
|||||||||
|
Buy signalSPY
|
Sell signaltlt
|
Buy signalEEM
|
Buy signalUSO
|
||||||||
|
Buy signalhyg
|
Buy signalVOOV
|
Sell signalQQQ
|
Buy signalicf
|
Buy signalGCC
|
Buy signaldx/y
|
Buy signalGSG
|
|||||
| < - -100 | -100 - -80 | -80 - -60 | -60 - -40 | -40 - -20 | -20 - 0 | 0 - 20 | 20 - 40 | 40 - 60 | 60 - 80 | 80 - 100 | 100 - > |
| AGG | iShares US Core Bond ETF |
| USO | United States Oil Fund |
| DIA | SPDR Dow Jones Industrial Average ETF |
| DVY | iShares Dow Jones Select Dividend Index ETF |
| DX/Y | NYCE U.S.Dollar Index Spot |
| EFA | iShares MSCI EAFE ETF |
| FXE | Invesco CurrencyShares Euro Trust |
| GLD | SPDR Gold Trust |
| GSG | iShares S&P GSCI Commodity-Indexed Trust |
| HYG | iShares iBoxx $ High Yield Corporate Bond ETF |
| ICF | iShares Cohen & Steers Realty ETF |
| IEF | iShares Barclays 7-10 Yr. Tres. Bond ETF |
| LQD | iShares iBoxx $ Investment Grade Corp. Bond ETF |
| IJH | iShares S&P 400 MidCap Index Fund |
| ONEQ | Fidelity Nasdaq Composite Index Track |
| QQQ | Invesco QQQ Trust |
| RSP | Invesco S&P 500 Equal Weight ETF |
| IWM | iShares Russell 2000 Index ETF |
| SHY | iShares Barclays 1-3 Year Tres. Bond ETF |
| IJR | iShares S&P 600 SmallCap Index Fund |
| SPY | SPDR S&P 500 Index ETF Trust |
| TLT | iShares Barclays 20+ Year Treasury Bond ETF |
| GCC | WisdomTree Continuous Commodity Index Fund |
| VOOG | Vanguard S&P 500 Growth ETF |
| VOOV | Vanguard S&P 500 Value ETF |
| EEM | iShares MSCI Emerging Markets ETF |
| XLG | Invesco S&P 500 Top 50 ETF |

| Symbol | Company | Sector | Current Price | Action Price | Target | Stop | Notes |
|---|---|---|---|---|---|---|---|
| WBS | Webster Financial Corporation | Banks | $69.34 | hi 60s - low 70s | 91 | 58 | 4 for 5'er, top 25% of BANK sector matrix, one box from peer RS buy, buy on pullback, 2.2% yield |
| CGON | CG Oncology, Inc. | Biomedics/Genetics | $64.88 | hi 50s - low 60s | 80 | 50 | 5 for 5'er, 18 of 162 in BIOM sector matrix, bullish catapult, good R-R, Earn. 3/26 |
| COCO | Vita Coco Company, Inc. | Food Beverages/Soap | $55.77 | mid-to-hi 50s | 72 | 48 | 5 for 5'er, top half of FOOD sector matrix, LT pos peer & mkt RS, pos trend flip |
| DGII | Digi International Inc | Telephone | $49.68 | upper 40s to lower 50s | 61 | 40 | 5 for 5'er; top quartile of Telephone matrix; buy signal since May '25, pos. trend since June '25. |
| BRX | Brixmor Property Group Inc | Real Estate | $28.84 | hi 20s - lo 30s | 38 | 24 | 4 for 5'er, top third of REAL sector matrix, LT pos peer & mkt RS, LT pos trend, bullish triangle, 4% yield |
| CNX | CNX Resources Corp | Oil | $40.64 | hi 30s - mid 40s | 71 | 33 | 5 TA rating, top 50% of OIL sector matrix, LT RS buy and pos trend, consec buy signals |
| FFIV | F5 Inc. | Internet | $289.75 | 280s - 290s | 344 | 256 | 4 for 5'er, top third of INET sector matrix, LT pos peer RS, spread quad top |
| INVA | Innoviva, Inc | Drugs | $21.91 | lo-mid 20s | 32.50 | 18.50 | 5 TA rating, top half of drugs sector RS matrix, LT pos trend, LT RS buy, buy-on-pullback |
| ORKA | Oruka Therapeutics Inc. | Biomedics/Genetics | $41.56 | mid-to-hi 30s | 57 | 30 | 5 for 5'er, top 10% of BIOM sector marix, quadruple top, buy on pullback, R-R>2.0 |
| ARCB | ArcBest Corp. | Transports/Non Air | $92.00 | low-to-mid 90s | 113 | 79 | 4 for 5'er, one box from market RS buy, top half of favored TRAN sector matrix, good R-R |
| GSK | GlaxoSmithKline Plc. (United Kingdom) ADR | Drugs | $51.99 | hi 40s - mid 50s | 67 | 42 | 5 TA rating, top 25% of DRUG sector matrix, LT pos trend, yield > 3%, buy-on-pullback |
| Symbol | Company | Sector | Current Price | Action Price | Target | Stop | Notes |
|---|---|---|---|---|---|---|---|
| CPRT | Copart Incorporated | Autos and Parts | $33.39 | hi 30s | 28 | 42 | 1 TA rating, bottom 50% of AUTO sector matrix, NT and mkt RS sell last month, consec sell signals |
| Symbol | Company | Sector | Current Price | Action Price | Target | Stop | Notes |
|---|---|---|---|---|---|---|---|
| CACI | CACI International Inc. | Computers | $589.28 | 528 | Moved to a sell signal. Current exposure may maintain $528 stop. | ||
| RTX | RTX Corp. | Aerospace Airline | $194.82 | 166 | Moved to a sell signal. Current exposure may maintain $166 stop. | ||
| ASND | Ascendis Pharma A/S | Biomedics/Genetics | $218.06 | 188 | Moved to a sell signal. Current exposure may maintain the $188 stop. |
| Comment | |||||||
|---|---|---|---|---|---|---|---|
|
|
|||||||
GSK GlaxoSmithKline Plc. (United Kingdom) ADR ($52.99) R - Drugs - GSK has a 5 for 5 TA rating and sits in the top quartile of the drugs sector RS matrix. The stock moved back to an RS buy signal against the market in February and has been in a positive trend for over a year. The recent chart action saw GSK give a third consecutive buy signal before notching a new multi-year high and then retracting back to the current position below the middle of its trading band. This offers a more opportune entry point for potential long investors. The stock also has a 3.44% yield. Exposure can be considered in the high $40s to mid-$50s. Our initial stop will be positioned at $42, which would violate multiple support levels on the default chart. The bullish price objective of $67 will serve as our price target.
| 24 | 25 | 26 | |||||||||||||||||||||||||||
| 61.00 | X | 61.00 | |||||||||||||||||||||||||||
| 60.00 | X | O | 60.00 | ||||||||||||||||||||||||||
| 59.00 | X | O | 59.00 | ||||||||||||||||||||||||||
| 58.00 | X | 3 | 58.00 | ||||||||||||||||||||||||||
| 57.00 | X | O | 57.00 | ||||||||||||||||||||||||||
| 56.00 | X | O | 56.00 | ||||||||||||||||||||||||||
| 55.00 | X | O | 55.00 | ||||||||||||||||||||||||||
| 54.00 | X | O | Mid | 54.00 | |||||||||||||||||||||||||
| 53.00 | X | O | 53.00 | ||||||||||||||||||||||||||
| 52.00 | 2 | O | 52.00 | ||||||||||||||||||||||||||
| 51.00 | X | X | 51.00 | ||||||||||||||||||||||||||
| 50.00 | 1 | O | X | 50.00 | |||||||||||||||||||||||||
| 49.00 | C | O | X | 49.00 | |||||||||||||||||||||||||
| 48.00 | B | O | 48.00 | ||||||||||||||||||||||||||
| 47.00 | X | Bot | 47.00 | ||||||||||||||||||||||||||
| 46.00 | • | X | X | 46.00 | |||||||||||||||||||||||||
| 45.00 | X | • | • | X | O | X | 45.00 | ||||||||||||||||||||||
| 44.00 | X | O | X | • | A | O | X | 44.00 | |||||||||||||||||||||
| 43.00 | 3 | 5 | O | X | O | • | X | O | 43.00 | ||||||||||||||||||||
| 42.00 | • | 2 | O | X | 6 | X | O | • | 6 | X | 42.00 | ||||||||||||||||||
| 41.00 | • | X | O | X | O | 8 | 9 | X | • | X | O | 9 | • | 41.00 | |||||||||||||||
| 40.00 | • | X | 4 | O | X | A | X | O | • | X | X | X | O | 8 | • | 40.00 | |||||||||||||
| 39.00 | • | X | O | X | O | X | O | 3 | O | X | O | X | O | X | • | 39.00 | |||||||||||||
| 38.00 | X | X | 1 | 7 | • | O | • | O | X | O | X | O | X | O | X | • | 38.00 | ||||||||||||
| 37.00 | 4 | O | 9 | O | C | • | • | O | X | 4 | X | 5 | 7 | X | • | 37.00 | |||||||||||||
| 36.00 | X | O | X | O | X | • | B | C | 2 | O | X | O | • | 36.00 | |||||||||||||||
| 35.00 | X | 5 | X | A | X | • | O | X | O | X | O | X | • | • | 35.00 | ||||||||||||||
| 34.00 | O | B | • | O | X | O | X | O | X | • | 34.00 | ||||||||||||||||||
| 33.00 | • | • | O | 1 | X | O | • | 33.00 | |||||||||||||||||||||
| 32.00 | • | O | • | • | 32.00 | ||||||||||||||||||||||||
| 24 | 25 | 26 |
| ABT Abbott Laboratories ($103.87) - Healthcare - ABT completed a double bottom break at $104, marking its fourth consecutive sell signal. The 1 for 5'er moved down from a 2 in January after reversing back into Os against the market. Additionally, the stock ranks in the bottom half of the healthcare sector matrix. A sell can be considered here given the weigh of the evidence. Initial resistance can be seen at $116, with additional resistance at $128. |
| AFL AFLAC Incorporated ($106.70) - Insurance - AFL shares moved lower today to break a double bottom at $106 to mark its first sell signal in over six months. This 4 for 5'er has been in a positive trend since August 2022 and on an RS buy signal versus the market since October 2022. AFL shares are trading below the middle of their ten-week trading band with a weekly overbought/oversold reading of 41%. From here, support is offered at $106 and its bullish support line currently resides at $106. |
| ALB Albemarle Corp ($176.25) - Chemicals - ALB returned to a buy signal Tuesday when it broke a double top at $172 and continued higher breaking a spread triple top at $174. Tuesday's move adds to an already positive technical picture as ALB is a 5 for 5'er that ranks near the middle of the chemicals sector matrix. From here, the first level of support sits at $156. |
| FMC FMC Corporation ($15.05) - Chemicals - FMC gave an initial buy signal Tuesday when it broke a triple top at $15.50. The outlook for the stock remains decidedly negative, however, as FMC is a 0 for 5'er that ranks in the bottom third of the chemicals sector matrix. From here, support sits at $13.50. |
| GLW Corning Incorporated ($143.01) - Electronics - GLW rose Tuesday to break a quadruple top at $136 before climbing over 9% intraday to $144. This ends a streak of consecutive sell signals for the 4 for 5'er that has been in a positive trend since last June. The weight of the technical evidence is favorable and improving once again. Initial support can eb seen at $128 with further support seen at $124 and $122. |
| GOOGL Alphabet Inc. Class A ($291.59) - Internet - Continue to watch the likes of GOOGL as more tech focused areas flounder a bit to close Q1. While the stock remains a strong 5/5'er, it has rattled off a string of four consecutive sell signals on its default chart, leaving plenty of resistance in its way above current levels. Again, its worth noting that buy the book the name remains quite strong, but there is certainly some evidence that the technical picture for GOOGL and other core focused tech players has weakened materially. Watch support around the $270's closely. Towards the upside, resistance is found littered around the middle of the trading band around $316. |
| HWKN Hawkins Chemical Inc ($148.16) - Chemicals - HWKN returned to a buy signal and a positive trend Tuesday when it broke a triple top at $148. The positive trend change will promote the stock to a 4 for 5'er., From here, the next level of overhead resistance sits at $152; meanwhile, support can be found at $130. |
| MSFT Microsoft Corporation ($374.00) - Software - MSFT fell Tuesday to break a double bottom at $380 before falling to $372 intraday. This stock still has a 3 for 5 TA rating but has shown consistent weakness in recent weeks. The weight of the technical evidence is mixed but deteriorating further. MSFT is nearing oversold territory, increasing the potential for a near-term bounce. Initial support from here is seen at $356 with further support at $348. Overhead resistance is seen at $408. |
| OLN Olin Corp ($27.62) - Chemicals - OLN gave a second consecutive buy signal and returned to a positive trend Tuesday when it broke a double top at $27, where it now sits against resistance. The technical picture for the stock remains negative as even with the positive trend change OLN is unfavorable 2 for 5'er. From here, the first level of support sits at $23. |
| TXRH Texas Roadhouse, Inc. ($167.41) - Restaurants - TXRH broke a double bottom at $166 for a third sell signal and to match the chart lows from earlier this month. The stock continues maintain a 3 technical attribute rating and ranks within the top half of the Restuarants sector matrix. Support lies at current chart levels, which dates to December last year, and a move to $164 would bring the stock to its lowest level since November. Additional support lies at $160 and $156, the November chart low. |
| VSCO Victoria's Secret & Company ($43.50) - Retailing - VSCO broke a triple bottom at $44 for a third sell signal and to violate the bullish support line as shares fell to $43. The trendline violation will drop the stock down to a 2 for 5'er trading in a negative trend. From here, support lies at $41, while additional lies at $34. |

| Name | Option Symbol | Action | Stop Loss |
|---|---|---|---|
| Darden Restaurants, Inc. - $200.28 | O: 26G200.00D17 | Buy the July 200.00 calls at 13.80 | 190.00 |
| Name | Option | Action |
|---|---|---|
| RTX Corp. ( RTX) | May. 210.00 Calls | Stopped at 192.00 (CP: 194.88) |
| Archer-Daniels-Midland Company ( ADM) | May. 65.00 Calls | Initiate an option stop loss of 5.20 (CP: 7.20) |
| Name | Option Symbol | Action | Stop Loss |
|---|---|---|---|
| Wells Fargo & Company - $80.28 | O: 26S80.00D17 | Buy the July 80.00 puts at 6.35 | 85.00 |
| Name | Option | Action |
|---|---|---|
| General Mills, Inc. ( GIS) | Apr. 45.00 Puts | Raise the option stop loss to 6.30 (CP: 8.30) |
| Tractor Supply Company ( TSCO) | Apr. 55.00 Puts | Raise the option stop loss to 6.90 (CP: 8.90) |
| General Mills, Inc. ( GIS) | Jun. 47.50 Puts | Raise the option stop loss to 8.00 (CP: 10.00) |
| T-Mobile US Inc. ( TMUS) | May. 210.00 Puts | Stopped at 9.30 (CP: 8.80) |
| Abbott Laboratories ( ABT) | Aug. 115.00 Puts | Raise the option stop loss to 11.70 (CP: 13.70) |
| Uber Technologies, Inc. ( UBER) | Jun. 75.00 Puts | Initiate an option stop loss of 4.45 (CP: 6.45) |
| Name | Option Sym. | Call to Sell | Call Price | Investment for 500 Shares | Annual Called Rtn. | Annual Static Rtn. | Downside Protection |
|---|---|---|---|---|---|---|---|
| ONEOK, Inc. $ 89.92 | O: 26G95.00D17 | Jul. 95.00 | 4.60 | $ 43,617.40 | 24.95% | 13.26% | 4.01% |
| Name | Action |
|---|---|
| Intel Corporation ( INTC) - 44.01 | Sell the May 49.00 Calls. |
| Micron Technology, Inc. ( MU) - 404.35 | Sell the June 420.00 Calls. |
| Moderna, Inc. ( MRNA) - 51.28 | Sell the April 55.00 Calls. |
| Fortinet Inc. ( FTNT) - 82.77 | Sell the May 85.00 Calls. |
| Invesco PLC ( IVZ) - 23.77 | Sell the May 24.00 Calls. |
| DuPont de Nemours Inc. ( DD) - 44.14 | Sell the May 45.00 Calls. |
| Name | Covered Write |
|---|---|
| Dell Technologies Inc Class C ( DELL - 164.59 ) | July 160.00 covered write. |
Daily Equity & Market Analysis
Loading, Please Wait...
