However, relative strength has much larger scope than just point and figure charting, and with that in mind, we’ve recently added the capability to chart RS relationships on a line chart along with the ability to put over some indicators, like moving averages.
Relative strength (RS) relationships are a core component of how we judge markets. Charting RS values on point and figure charts to garner information about leadership has been a primary focus of ours for years and will continue to be so. However, relative strength has much larger scope than just point and figure charting, and with that in mind, we’ve recently added the capability to chart RS relationships on a line chart along with the ability to put over some indicators, like moving averages. As an example, the chart below shows the RS value between SPY and RSP (cap-weight S&P 500 vs equal-weight S&P 500) as well as its 400-day moving average. If the RS value is above its 400-day moving average, then SPY is in the lead. If the RS value is below its 400-day moving average, then RSP is in the lead. A 400-day moving average is roughly two years of trading data, so this is still focused on long-term trends. Any period can be used when adding a moving average to a line or RS line chart, but for today we’ll focus on a long-term view.

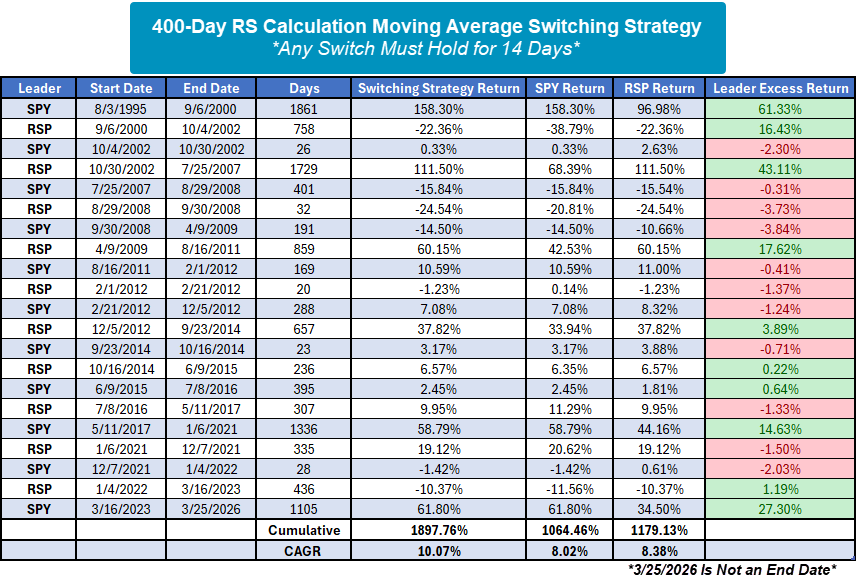
Running a simple switching strategy based on whether the SPY/RSP relative strength calculation is above or below its 400-day moving average. For this strategy, we put in a 14-day rule which limits switching to only those instances when a moving average cross lasted for at least 14 calendar days. This drastically reduced unnecessary changes, although there were still a handful of short-lived trades. Despite a few head fakes and unsuccessful trades, the switching strategy outperformed buying and holding either SPY or RSP by a large margin. One noticeable point from the switching strategy is that none of the “unsuccessful” trades underperformed by more than 4%. If the strategy was “wrong” then it corrected the mistake before much damage was done. On the other hand, the successful trades had much greater outperformance than the unsuccessful trades had underperformance. This gets back to a core tenant of momentum or relative strength investing, cutting the losers short and holding onto the winners if they continue to lead.