
The S&P 500 is is 7% away from all-time highs while the Russell 2000 just moved into a correction. How often do similar declines become full bear markets?
The Russell 2000 (RUT) was up as much as 9.5% to start the year on January 22nd, but has since fallen 10.3% from highs, entering a technical correction at the end of last week. Additionally, the index moved back to a negative trend after completing its third consecutive sell signal, ending what had been an extremely solid run since April. The fund score of iShares Russell 2000 ETF (IWM) is down to hold territory at 3.77, which is 0.82 points lower than its highs last year, leaving it below a 4.0 score for the first time since last September. Given the deterioration, what have previous corrections for small caps looked like, and when might things turn around?
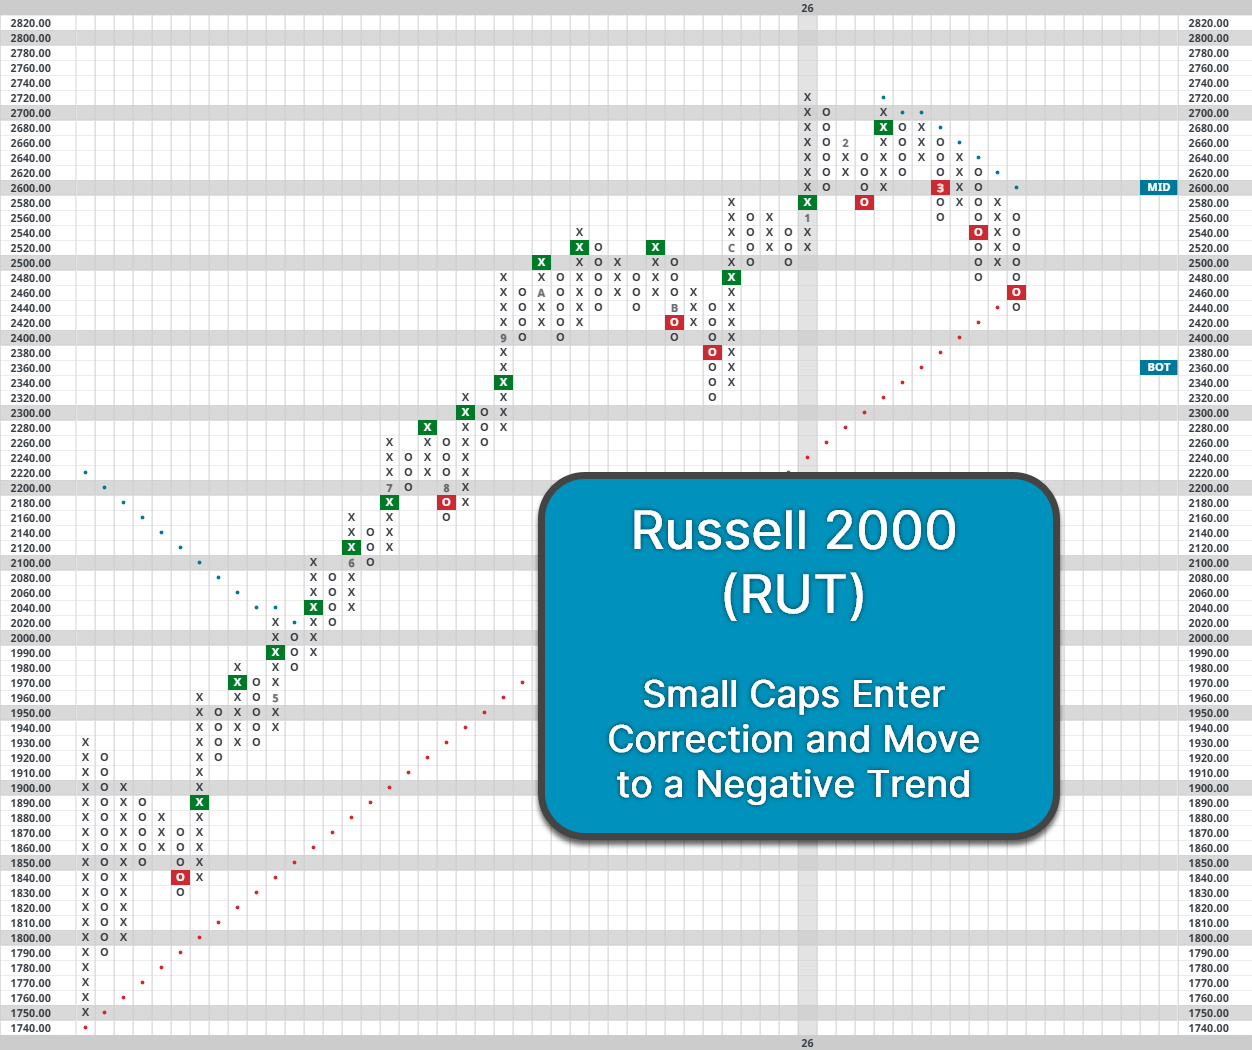
Looking at the Russell 2000 since its inception in 1979, there have been 23 instances in which the index set a new all-time high, then moved into a 10% correction. Of those 23 occurrences, 70% went on to fall at least another 5%. Meanwhile, the forward returns after the index initially moved into a correction were below average across the board. Specifically, the index was flat on average over the next three months while averaging one-year returns of only 6%. It’s also taken the index an average of 15.6 months to return to ATHs after first moving into a correction. Consequently, recent declines among small cap stocks could indicate a more subdued year. While traders might want to buy the dip at every step of the way for RUT, doing so has been more fruitful when waiting until the index moved into a bear market, as a 20% decline is when RUT's forward returns moved above their baseline average. That said, small caps have been prone to sharp reversals in both directions in recent years, so the index could still defy historical norms and rebound quickly, especially given the acceptable levels of relative strength from the group currently.

While small caps have been hit the hardest within domestic equities, the broader market hasn’t been immune to downside pressure either. The S&P 500 (SPX) set new all-time highs in January but has since fallen 6.8%. Declines of this magnitude are relatively common for SPX, as the index has made 66 trips from all-time highs to a decline of at least 5% going back to 1950. Historically, declines of 5% to 10% for the S&P 500 were relatively subdued, with markets entering a correction only 35% of the time before returning to ATHs. The median recovery back to highs has also been a relatively quick 2.3 months. Meanwhile, the one-year forward returns for the market were largely normal, averaging an 8.3% gain. However, recent pullbacks have been more notable for the speed of downside rather overall magnitude, with the index declining almost 6% in the last month alone.
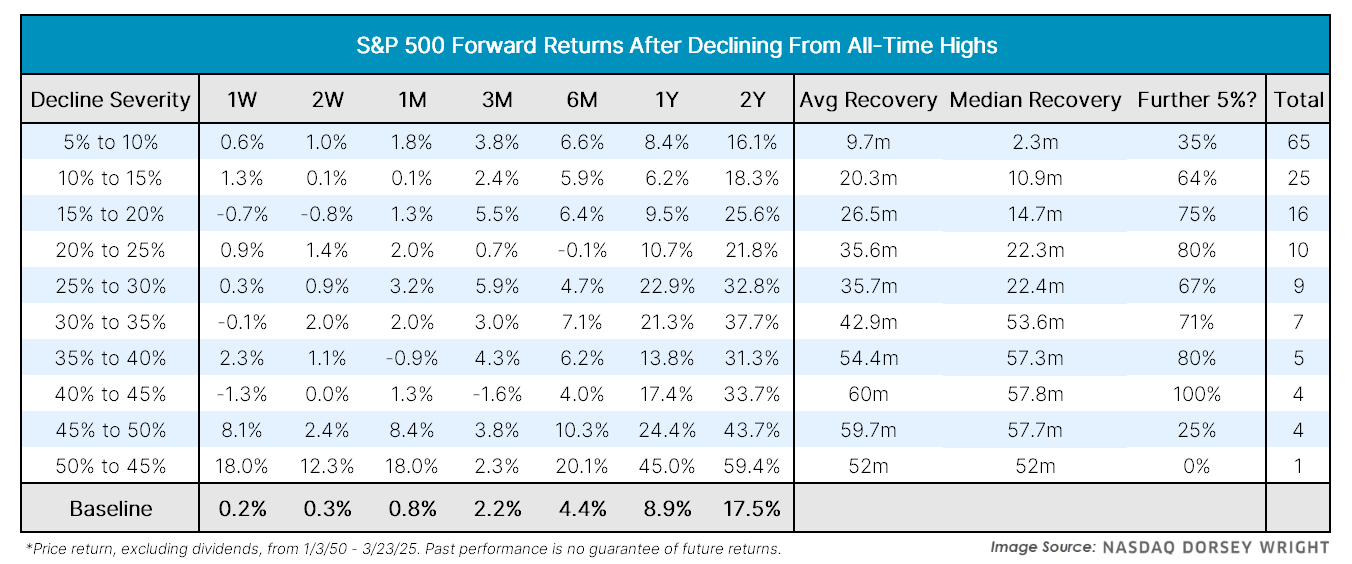
While a month that bad feels abnormal relative to the last few years, it’s certainly not the first time something like that has occurred. The current bull market officially began on October 12th of 2022, with the S&P 500 gaining 73% from that point. However, there are still seven other times during this bull where SPX declined 5% or more over a month. Encouragingly, the market was higher three months later in each of those seven instances, averaging a gain of over 10.5% as stocks climbed out of oversold territory. Granted, it would be unlikely for the market to match or exceed those same averages, but it does offer some optimism for investors over the next year despite recent volatility.

Additionally, several of our indicators are signaling that things have moved into washout territory in the near-term. The S&P 500 index funds group on the Asset Class Group Scores page displays an overbought/oversold (OBOS) reading of nearly -100%, marking the most oversold conditions for the market since the Tariff Tantrum. Meanwhile, the ten week for the S&P 500 (^TWSPX) recently moved to somewhat washed out territory below 20%. A reversal from ^TWSPX below 20% would be a potential sign that the market has put in a bottom, especially given the consistent long-term strength of domestic equities. Overall, a 5% to 10% decline is certainly uncomfortable, but it shouldn’t materially change our market outlook unless we see signs of further deterioration.

