Last weekend's strike on Iran beg the question: what's next for assets around the globe? Today we break down how different securities have performed after major US strikes over time.
If your office is anything like the Dorsey Wright office in Richmond, your clients have been calling in and asking for more context around recent movement. Markets seem to be moving back and forth at will, seeing massive intra-day up and downswings as more news comes out about the recent strikes in Iran. With that in mind, we thought it may be useful to look back at other historical instances of US escalation in historical military campaigns in an effort to contextualize what may be in store over the next year if conflict continues. Before going further, it’s worth mentioning that “war” looks different today than it has in the past- as has the speed at which information moves around the globe. Furthermore, finding concrete start and end dates to US involvement in conflict in a post 9/11 world can be quite difficult- a point to keep in mind when observing today’s tests. Regardless, today’s feature will look back at major campaigns from the last century in an effort to answer the question: Is increased US military presence around the globe a “bad” thing from a market perspective?
Before diving into specific asset classes, we will first break down returns for the broad market. There have been 12 “major” US related military strikes/large scale US involvement starting with Pearl Harbor on December 7th, 1941. This attack started direct US involvement in World War II, sending markets reeling over the following 5 day period. The surprise attack kicked off the worst 5-day stretch following heightened starts to conflict in our dataset, seeing SPX decline more than 6%. Things didn’t really improve over the next year, seeing SPX end roughly flat 365 days later. It is worth noting that Pearl Harbor is the only observed datapoint that saw SPX in the red over every observed timeframe (5 day, 20 day, 30 day, 90 day, 180 day & 1 year.) Besides that, markets have been quite resilient around wartime. In fact, SPX has landed in positive territory 1 year after the start of US involvement seven of eleven times (~64%) signaling that most often, markets are able to effectively shake off heighted global conflict. On average, forward one year returns are just that…. average…. clocking in around 7.54%. This average value includes a comparatively massive 26% decline around US involvement in Afghanistan in 2001, a decline most of us would associate with the burst of the dotcom bubble rather than US military conflict. Regardless- the main takeaway from this dataset is clear: Global conflict (on average) isn’t “bad” for financial markets, at least domestically.

What about volatility? Our next chart below breaks down how the market’s “fear gauge” reacts around conflict. Note- data from here on out uses a condensed data set starting for most asset classes in the 1980’s. With that said, our pool for observation is even more condensed, a point to keep in mind when making assumptions on our data. Regardless, the table below breaks down how the VIX moved over two defined periods: before and after US strikes. Interestingly enough, you’ll note that more often than not, volatility actually begins creeping higher notably before the strike before dissipating after. There are certainly several arguments for why this could be, but the most convincing is that markets are “pricing in” strikes ahead of time and then cooling off after things go “as planned.” Message from this table: If historical averages play out, markets should see the fear gauge contract over the next month or so.
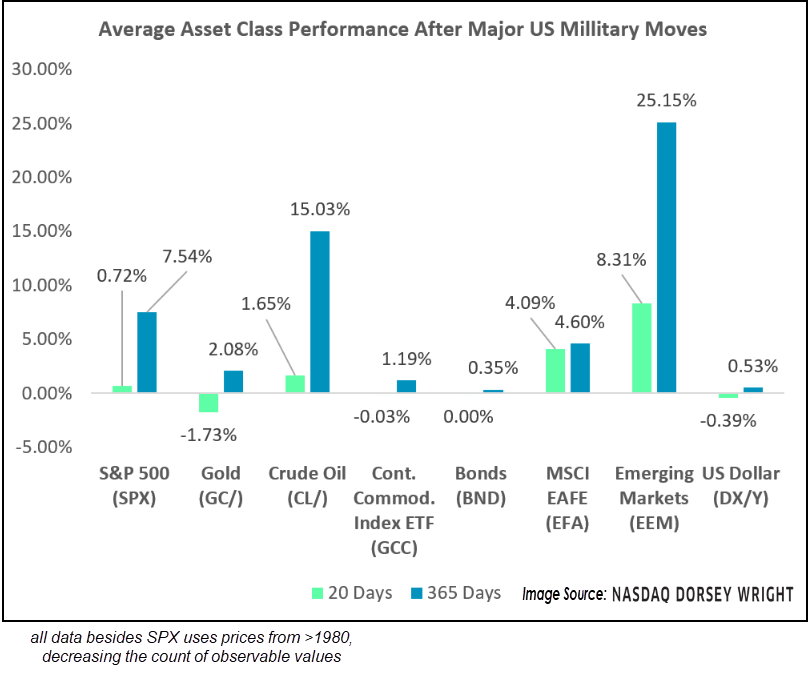
Finally, we will journey into different asset classes to test how different securities normally perform (keep in mind the contracted dataset mentioned previously when computing our averages.) The table below includes 20-day and 365-day average performance metrics for various different asset classes. Most assets are roughly what you might expect, with a few notable outliers. Emerging markets have seen stout improvement following US focused conflict, a major difference to what we have seen since this weekend’s strikes on Iran. Crude is another major gainer, which makes sense considering many major conflicts are centered around high production areas.

Remember, our job is to help provide context around world events, not unnecessarily feed into the fear that is often present around these global events. While it goes without saying that each event is different and brings its own set of challenges to global markets, most assets have shown impressive resiliency around unrest. Remember, markets are forward looking and declines are generally driven by uncertainty more than any other factor. While no one roots for heightened conflict, once it begins uncertainty tends to fall… and markets keep moving.