
As fears of a potential overvaluation fueled decline continue to mount, how often does the market actually see significant downside?
Everyone hopes that markets will continue rising forever, but unfortunately, we all know that isn’t possible. The opportunity for gains will always be accompanied by the risk of losses. As a result, drawdowns aren’t just a risk in this business—they’re an inevitability. While many investors believe they can hold steady in the face of losses, holding through a steep decline is easier said than done when one’s livelihood is at stake. Understanding these pivotal moments before they happen can better prepare you for when they occur. As fears of a potential overvaluation-fueled decline continue to mount, how often does the market actually see significant downside?
While history doesn’t repeat, it often rhymes, so historical drawdowns can provide us with an indication of what future declines we might experience. Consequently, we looked at the drawdowns of the S&P 500—defined as the maximum peak-to-trough declines—starting in 1950. As seen in the graph below, it’s common to see the market sitting a meaningful distance below its highs. On average, SPX is 10.9% away from its highs, whereas the market is currently only 1% away from its recent peak (as of 2/20). Meanwhile, steeper declines are much less common. The market fell 45% or more from highs in only three instances: the early 70s, Dotcom Bubble, and Great Recession. That said, this only looks at declines from 1950 onward. The period from 1929 to 1954 saw the market fall as much as 86.2% during a 25-year drawdown, marking the worst decline in market history.

To give investors a better idea of the downside they might experience, we looked at the range of drawdowns of the S&P 500 over different holding periods going back to 1950, as seen in the table below. Across a one-year period, the average S&P 500 drawdown is 13.6%. Said plainly, the S&P 500 is down an average of 13.6% from an intra-year high at some point during a year. However, the range of drawdowns varies significantly in both directions. At its most extreme, the S&P 500 saw a maximum one-year drawdown of 52.6% during the Great Recession. Meanwhile, both 1995 and 2017 were within 3% of their respective highs. As one might expect, longer holding periods are subject to greater drawdowns on average. Across a 10-year holding period, investors should expect a decline from highs of around 25% to 30%.
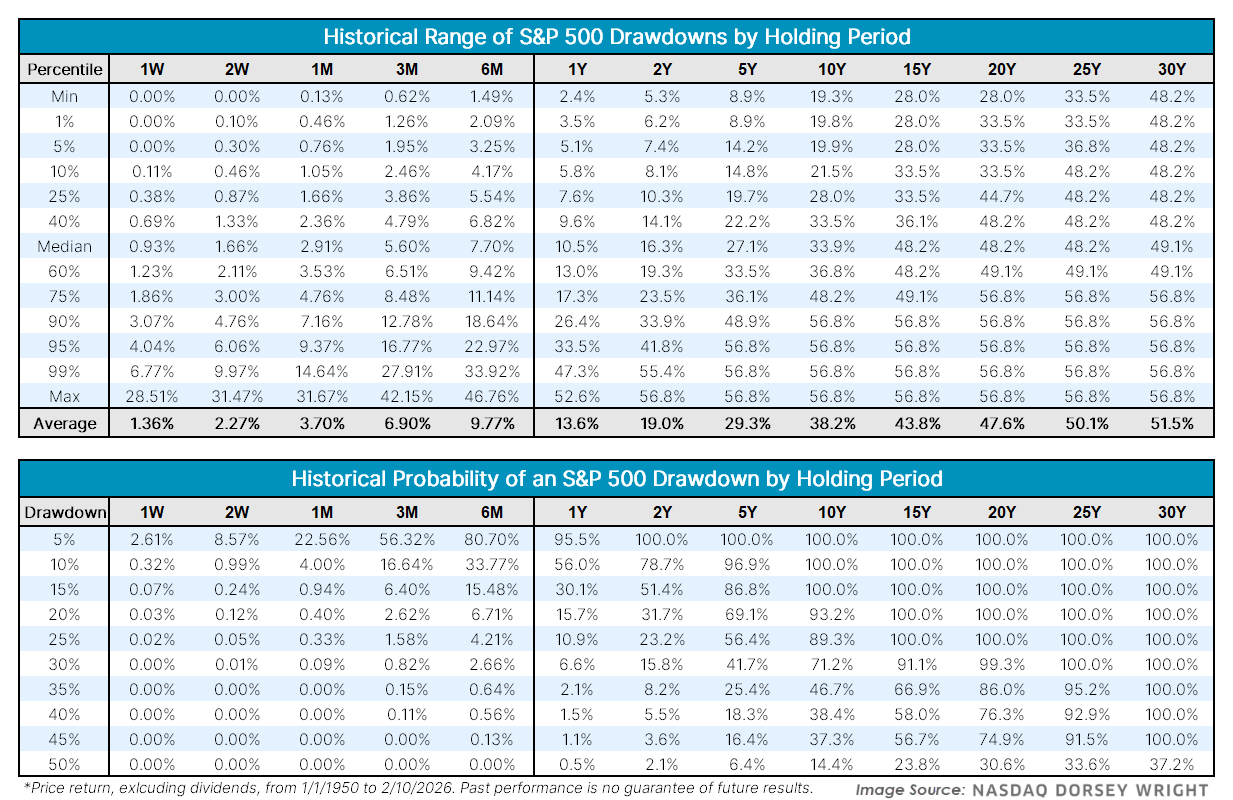
Another way to evaluate drawdowns is by looking at the probability of hitting certain downside levels during a given holding period. For example, the S&P 500 saw a one-week drawdown over 10% near the bottom of the Tariff Tantrum, which happens in only 0.32% of weeks, as seen in the second table. Meanwhile, the market has seen a drawdown of 15% or more in every ten-year period going back to 1950.
It is important to note that these numbers are the greatest decline within the period, not the overall return, meaning a period can see large drawdowns and still recover. For example, the S&P 500 pulled back as much as 18.9% last year despite finishing up 16.4%.
With markets constantly changing, so too is the potential for drawdowns. Movement over the last several years has been sharper than historical norms. Half of the years since 2018 have seen a drawdown of at least 18.9%, as highlighted in the left-hand graph below. For context, the S&P 500 has seen a one-year drawdown greater than 15% less than a third of the time going back to 1950. Despite the increased frequency of drawdowns, the market has also recovered abnormally quickly. The median distance from all-time highs is 6.6% going back to 1950. Looking at the market since 2018, that number is much lower at 2.7%, even with several sharp declines during that span. Whether this trend of quicker markets—both to the upside and downside—holds has yet to be seen, but it is something to keep in mind.
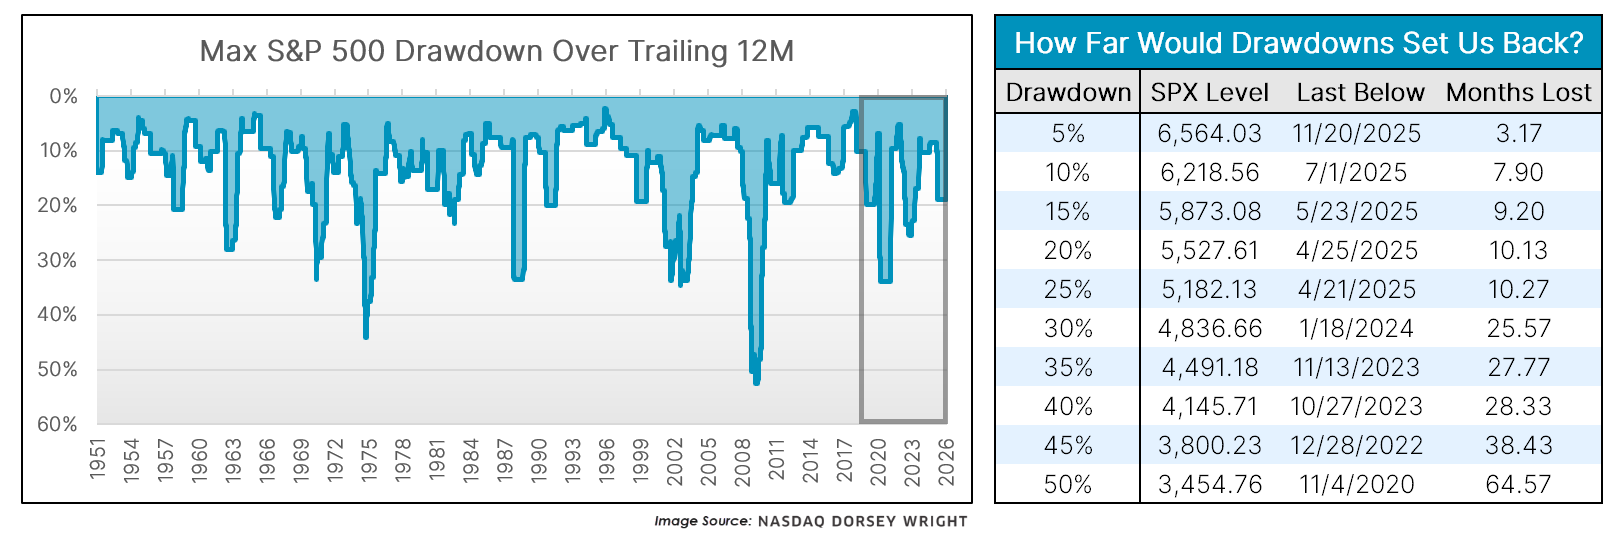
If there’s anything to take away from today’s article, it’s that portfolios should see large declines yet rise over time. To put that point in perspective, we looked at how far drawdowns would set portfolios back. If the S&P 500 experienced a decline of 25%, that would set portfolios back just 10 months, as SPX was last at or below that level in April of last year. A worst-case scenario for the market would be a drawdown of over 45%, but a decline of that magnitude would only erase around three years of gains, with the S&P 500 last around that level at the end of 2022. While investors tend to focus on downside scenarios, we often forget the gains that come before and after said declines. Stocks have tumbled again and again, but history has shown that time heals all wounds, causing the market to rise over time despite periodic setbacks.
