Most Requested Symbols

Emerging markets notch a milestone nearly 15 Years in the making... but the move echoes a notable shift in a pre-2000's world.
As fears of a potential overvaluation fueled decline continue to mount, how often does the market actually see significant downside?
Weekly Rundown Video – Feb 18, 2026
Weekly rundown with NDW analyst team covering all major asset classes.
Weekly rundown with NDW analyst team covering all major asset classes.
The creation of Instagram. Apple releasing the iPad. A 31-year old Drew Brees leading the Saints to their first Super Bowl over the Indianapolis Colts. All of these things last happened in over a decade and a half ago in 2010, the last time that today’s featured relative strength chart sat in O’s. On Friday 2/20/2026, the S&P 500 reversed back down into a column of O’s on its 6.5% chart against emerging markets representative EEM. The move acts as further confirmation of international dominance, following suit with other broader indicators like DALI or the Asset Class Group Scores Page showing international leadership starting earlier in 2025. Peering back at the RS chart, the move can’t help but remind even the most confident bull of the reversal lower in early 1999, pre-dating a decade of domestic underperformance. Interestingly enough, the 26-box column from January of 1995 to April of 1999 is the exact same height/length as the 26-box column established from September 2011 to February of 2026… making it difficult to not draw comparisons between the two.
It goes without saying that no one RS chart is the “silver bullet” that will predict the next lost decade for domestic equities, especially when chart action is admittedly so limited. Since 1988, there have been just 21 reversals on this 6.5% RS chart, and only two notable (albeit elongated) instances in which SPX posted a buy signal against EEM. As chart action is so sparce, it can be difficult not to draw an immediate conclusion that this comparison signals the end of domestic equity leadership in a similar fashion to the reversal down in 1999. While certainly possible, what is perhaps the more likely outcome is continued heighted volatility as the two groups vow for control. You’ll notice the two stems of domestic equity outperformance marked consistent leadership, while other instances of international strength saw more back and forth as market direction was far less consistent. It’s worth noting that an advisor following the signal switching portfolio (owning whichever asset is on a buy signal) or the reversal switching portfolio (owning whichever asset maintains a column of X’s) is profitable over buy and hold portfolios of either asset on its own.
Remember, it is our job to keep our ear to the ground to keep track of notable shifts occurring. While today’s shift in relative strength certainly isn’t worth shifting broad allocation around for on its own, the number of signals pointing towards a change in strength between international and domestic equites is certainly growing. Keep this in mind when you receive new capital from clients… it might be worth having a short list of ideas to take advantage of leadership as we move into the final month of Q1 2026.


Everyone hopes that markets will continue rising forever, but unfortunately, we all know that isn’t possible. The opportunity for gains will always be accompanied by the risk of losses. As a result, drawdowns aren’t just a risk in this business—they’re an inevitability. While many investors believe they can hold steady in the face of losses, holding through a steep decline is easier said than done when one’s livelihood is at stake. Understanding these pivotal moments before they happen can better prepare you for when they occur. As fears of a potential overvaluation-fueled decline continue to mount, how often does the market actually see significant downside?
While history doesn’t repeat, it often rhymes, so historical drawdowns can provide us with an indication of what future declines we might experience. Consequently, we looked at the drawdowns of the S&P 500—defined as the maximum peak-to-trough declines—starting in 1950. As seen in the graph below, it’s common to see the market sitting a meaningful distance below its highs. On average, SPX is 10.9% away from its highs, whereas the market is currently only 1% away from its recent peak (as of 2/20). Meanwhile, steeper declines are much less common. The market fell 45% or more from highs in only three instances: the early 70s, Dotcom Bubble, and Great Recession. That said, this only looks at declines from 1950 onward. The period from 1929 to 1954 saw the market fall as much as 86.2% during a 25-year drawdown, marking the worst decline in market history.

To give investors a better idea of the downside they might experience, we looked at the range of drawdowns of the S&P 500 over different holding periods going back to 1950, as seen in the table below. Across a one-year period, the average S&P 500 drawdown is 13.6%. Said plainly, the S&P 500 is down an average of 13.6% from an intra-year high at some point during a year. However, the range of drawdowns varies significantly in both directions. At its most extreme, the S&P 500 saw a maximum one-year drawdown of 52.6% during the Great Recession. Meanwhile, both 1995 and 2017 were within 3% of their respective highs. As one might expect, longer holding periods are subject to greater drawdowns on average. Across a 10-year holding period, investors should expect a decline from highs of around 25% to 30%.
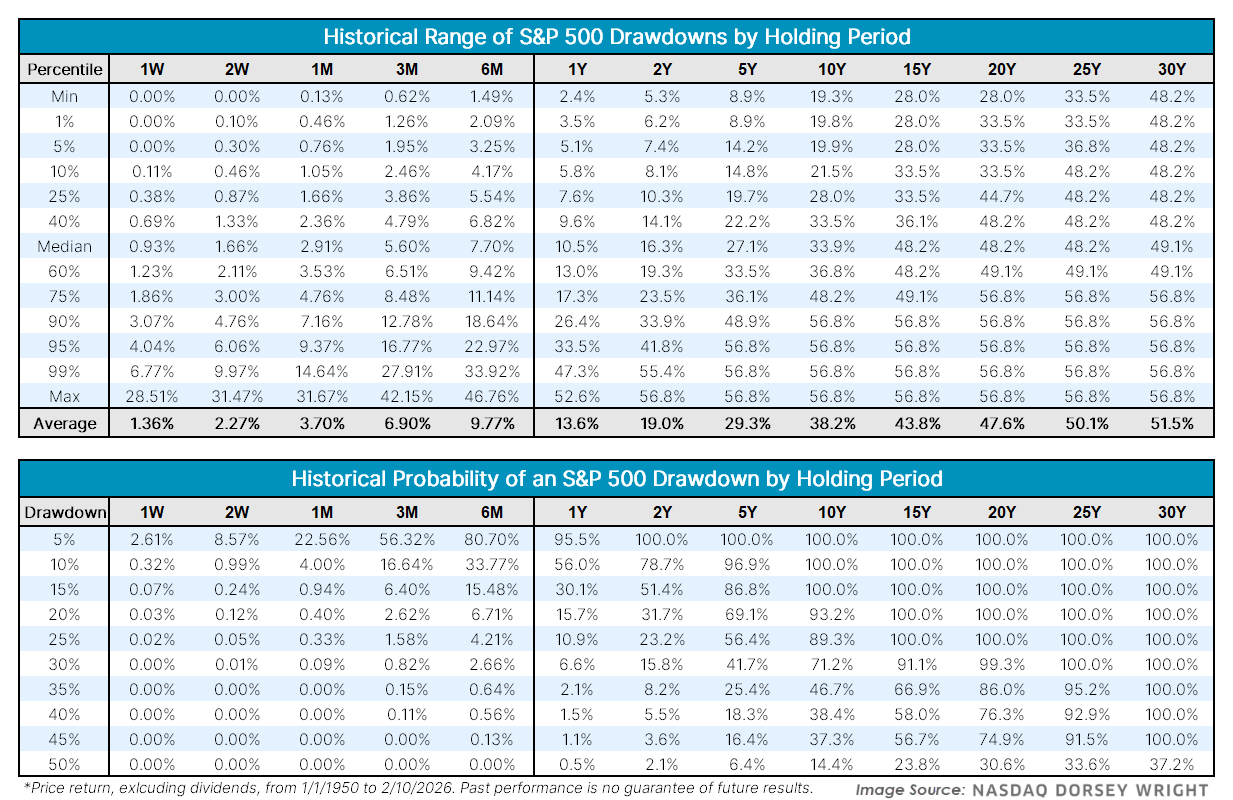
Another way to evaluate drawdowns is by looking at the probability of hitting certain downside levels during a given holding period. For example, the S&P 500 saw a one-week drawdown over 10% near the bottom of the Tariff Tantrum, which happens in only 0.32% of weeks, as seen in the second table. Meanwhile, the market has seen a drawdown of 15% or more in every ten-year period going back to 1950.
It is important to note that these numbers are the greatest decline within the period, not the overall return, meaning a period can see large drawdowns and still recover. For example, the S&P 500 pulled back as much as 18.9% last year despite finishing up 16.4%.
With markets constantly changing, so too is the potential for drawdowns. Movement over the last several years has been sharper than historical norms. Half of the years since 2018 have seen a drawdown of at least 18.9%, as highlighted in the left-hand graph below. For context, the S&P 500 has seen a one-year drawdown greater than 15% less than a third of the time going back to 1950. Despite the increased frequency of drawdowns, the market has also recovered abnormally quickly. The median distance from all-time highs is 6.6% going back to 1950. Looking at the market since 2018, that number is much lower at 2.7%, even with several sharp declines during that span. Whether this trend of quicker markets—both to the upside and downside—holds has yet to be seen, but it is something to keep in mind.
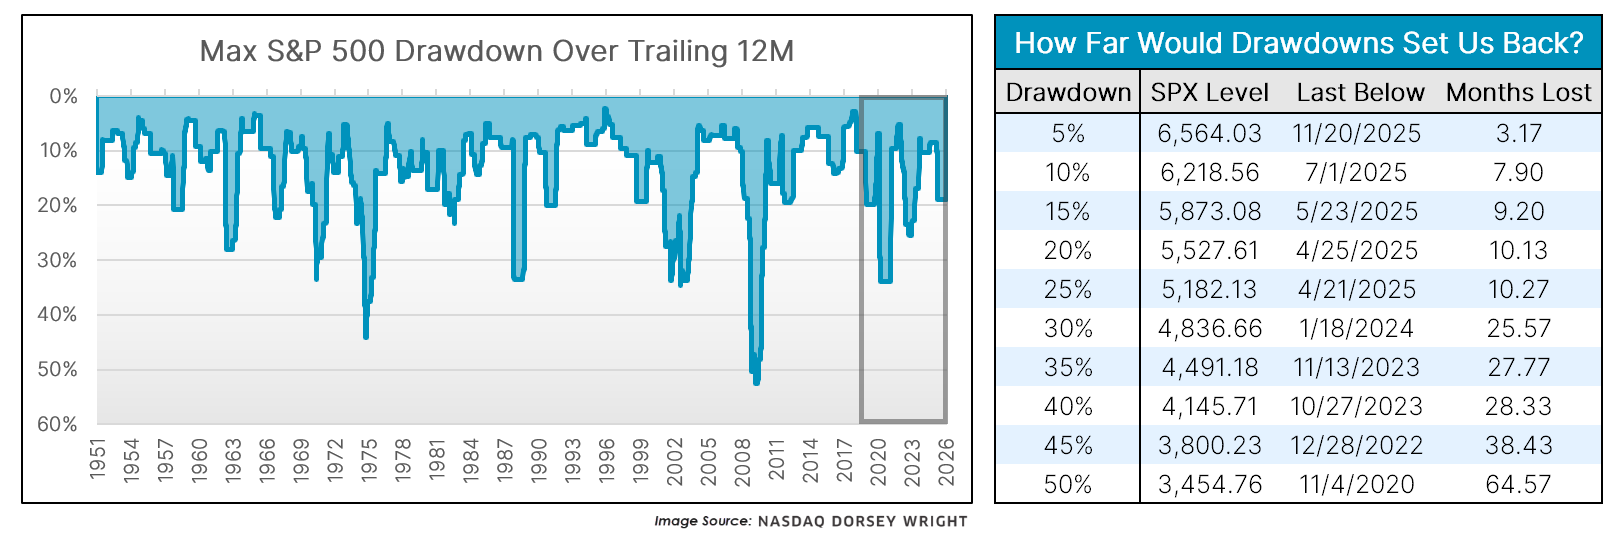
If there’s anything to take away from today’s article, it’s that portfolios should see large declines yet rise over time. To put that point in perspective, we looked at how far drawdowns would set portfolios back. If the S&P 500 experienced a decline of 25%, that would set portfolios back just 10 months, as SPX was last at or below that level in April of last year. A worst-case scenario for the market would be a drawdown of over 45%, but a decline of that magnitude would only erase around three years of gains, with the S&P 500 last around that level at the end of 2022. While investors tend to focus on downside scenarios, we often forget the gains that come before and after said declines. Stocks have tumbled again and again, but history has shown that time heals all wounds, causing the market to rise over time despite periodic setbacks.
Average Level
38.64
| < - -100 | -100 - -80 | -80 - -60 | -60 - -40 | -40 - -20 | -20 - 0 | 0 - 20 | 20 - 40 | 40 - 60 | 60 - 80 | 80 - 100 | 100 - > |
|---|---|---|---|---|---|---|---|---|---|---|---|
|
Buy signaltlt
|
|||||||||||
|
Sell signallqd
|
|||||||||||
|
Buy signalijr
|
|||||||||||
|
Buy signaldia
|
Sell signalief
|
Buy signalIJH
|
|||||||||
|
Sell signalVOOG
|
Buy signalfxe
|
Buy signalhyg
|
Buy signalVOOV
|
Buy signalrsp
|
|||||||
|
Buy signalXLG
|
Buy signalQQQ
|
Buy signalSPY
|
Buy signaliwm
|
Buy signalGLD
|
Buy signaluso
|
Buy signalicf
|
Buy signalEEM
|
||||
|
Sell signalONEQ
|
Sell signaldx/y
|
Buy signalgcc
|
Buy signalshy
|
Buy signalagg
|
Buy signalgsg
|
Buy signaldvy
|
Buy signalefa
|
||||
| < - -100 | -100 - -80 | -80 - -60 | -60 - -40 | -40 - -20 | -20 - 0 | 0 - 20 | 20 - 40 | 40 - 60 | 60 - 80 | 80 - 100 | 100 - > |
| AGG | iShares US Core Bond ETF |
| USO | United States Oil Fund |
| DIA | SPDR Dow Jones Industrial Average ETF |
| DVY | iShares Dow Jones Select Dividend Index ETF |
| DX/Y | NYCE U.S.Dollar Index Spot |
| EFA | iShares MSCI EAFE ETF |
| FXE | Invesco CurrencyShares Euro Trust |
| GLD | SPDR Gold Trust |
| GSG | iShares S&P GSCI Commodity-Indexed Trust |
| HYG | iShares iBoxx $ High Yield Corporate Bond ETF |
| ICF | iShares Cohen & Steers Realty ETF |
| IEF | iShares Barclays 7-10 Yr. Tres. Bond ETF |
| LQD | iShares iBoxx $ Investment Grade Corp. Bond ETF |
| IJH | iShares S&P 400 MidCap Index Fund |
| ONEQ | Fidelity Nasdaq Composite Index Track |
| QQQ | Invesco QQQ Trust |
| RSP | Invesco S&P 500 Equal Weight ETF |
| IWM | iShares Russell 2000 Index ETF |
| SHY | iShares Barclays 1-3 Year Tres. Bond ETF |
| IJR | iShares S&P 600 SmallCap Index Fund |
| SPY | SPDR S&P 500 Index ETF Trust |
| TLT | iShares Barclays 20+ Year Treasury Bond ETF |
| GCC | WisdomTree Continuous Commodity Index Fund |
| VOOG | Vanguard S&P 500 Growth ETF |
| VOOV | Vanguard S&P 500 Value ETF |
| EEM | iShares MSCI Emerging Markets ETF |
| XLG | Invesco S&P 500 Top 50 ETF |

| Symbol | Company | Sector | Current Price | Action Price | Target | Stop | Notes |
|---|---|---|---|---|---|---|---|
| EWBC | East West Bancorp, Inc. | Banks | $121.31 | mid 100s - mid 110s | 157 | 92 | 4 for 5'er, top third of favored BANK sector matrix, LT pos peer RS, one box from mkt RS buy, spread quad top |
| GS | Goldman Sachs Group, Inc. | Wall Street | $922.24 | mid-800s - mid-900s | 1416 | 736 | 5 TA rating, top 10% of WALL sector matrix, LT RS buy, LT pos trend, buy-on-pullback |
| PHM | PulteGroup, Inc. | Building | $140.02 | hi 120s - mid 130s | 168 | 110 | 4 for 5'er, top half of BUIL sector matrix, LT pos peer & mkt RS, bullish catapult |
| CBOE | CBOE Global Markets Inc. | Wall Street | $288.68 | lo 260s - mid 280s | 332 | 228 | 5 TA rating, top 25% of WALL sector matrix, LT RS buy, LT pos trend, buy-on-pullback |
| JBL | Jabil Circuit, Inc. | Electronics | $271.09 | mid 240s- lo 270s | 352 | 204 | 4 TA rating, top 50% of ELEC sector matrix, LT RS buy, buy-on-pullback |
| ABBV | AbbVie Inc. | Drugs | $224.81 | 210s - low 230s | 284 | 188 | 5 for 5'er, favored DRUG sector, LT pos peer & mkt RS, breakout from consec sell signals, 2.9% yield |
| AB | AllianceBernstein Holding LP | Wall Street | $39.67 | low 40s | 64 | 32 | 4 TA rating, LT mkt RS buy, LT pos trend, top 50% of WALL sector matrix, consec buy signals, buy-on-pullback, yield > 8% |
| SN | SharkNinja, Inc. | Household Goods | $130.64 | 120s - low 130s | 183 | 108 | 4 for 5'er, 3rd of 28 in HOUS sector matrix, multiple buy signals, buy on pullback, R-R>2.0 |
| BYD | Boyd Gaming Corp | Gaming | $86.20 | 82 - 88 | 98 | 72 | 4 for 5'er, top 20% of GAME sector matrix, LT pos peer RS, triple top, pos trend flip, buy on pullback |
| Symbol | Company | Sector | Current Price | Action Price | Target | Stop | Notes |
|---|
| Symbol | Company | Sector | Current Price | Action Price | Target | Stop | Notes |
|---|---|---|---|---|---|---|---|
| JPM | J.P. Morgan Chase & Co. | Banks | $310.79 | lo 300s - mid 320s | 380 | 256 | JPM has fallen to a sell signal. OK to hold here. OK to hold here. Maintain $256 stop. |
| DAL | Delta Air Lines Inc. | Aerospace Airline | $69.44 | mid-to-hi 60s | 99 | 55 | DAL has fallen to a sell signal. OK to hold here. Maintain $55 stop. |
| Comment | |||||||
|---|---|---|---|---|---|---|---|
|
|
|||||||
BYD Boyd Gaming Corp R ($83.38) - Gaming - BYD is a 4 for 5'er that ranks in the top quintile of the gaming sector matrix and has been on a peer RS buy signal since 2021. After giving two consecutive sell signals on its default chart. BYD returned to a buy signal and a positive trend last week when it broke a triple top at $87. In Monday's trading the stock pulled back to support at $82, a level from which it has rallied three times this month, offering an entry point for long exposure. Positions may be added in the $82 - $88 range and we will set our initial stop at $72, which would take out multiple levels of support on BYD's chart. We will use the bullish price objective, $98 as our near-term price objective.
| 26 | |||||||||||||||||||||||||||||
| 89.00 | X | X | • | 89.00 | |||||||||||||||||||||||||
| 88.00 | A | 1 | O | X | O | • | 88.00 | ||||||||||||||||||||||
| 87.00 | X | X | X | X | O | X | O | X | O | • | • | X | 87.00 | ||||||||||||||||
| 86.00 | X | O | X | O | X | O | X | O | X | O | O | 2 | X | • | X | 86.00 | |||||||||||||
| 85.00 | X | O | X | O | X | O | X | O | X | X | O | X | O | X | O | X | Mid | 85.00 | |||||||||||
| 84.00 | X | O | X | 8 | X | 9 | X | O | X | O | X | X | O | X | O | X | O | X | 84.00 | ||||||||||
| 83.00 | X | O | X | O | X | O | X | O | X | O | X | X | O | X | O | • | O | X | O | X | 83.00 | ||||||||
| 82.00 | X | O | X | O | X | O | X | O | O | X | O | X | O | X | • | • | O | O | • | 82.00 | |||||||||
| 81.00 | X | O | X | O | O | O | X | O | X | C | X | • | • | 81.00 | |||||||||||||||
| 80.00 | 7 | O | O | B | O | X | O | • | 80.00 | ||||||||||||||||||||
| 79.00 | X | O | X | O | X | • | 79.00 | ||||||||||||||||||||||
| 78.00 | X | O | X | O | • | 78.00 | |||||||||||||||||||||||
| 77.00 | X | O | • | • | 77.00 | ||||||||||||||||||||||||
| 76.00 | X | 6 | • | Bot | 76.00 | ||||||||||||||||||||||||
| 75.00 | X | O | X | • | 75.00 | ||||||||||||||||||||||||
| 74.00 | X | O | X | • | 74.00 | ||||||||||||||||||||||||
| 73.00 | X | O | • | 73.00 | |||||||||||||||||||||||||
| 72.00 | X | • | 72.00 | ||||||||||||||||||||||||||
| 71.00 | O | 5 | • | 71.00 | |||||||||||||||||||||||||
| 70.00 | O | X | • | 70.00 | |||||||||||||||||||||||||
| 69.00 | O | X | • | 69.00 | |||||||||||||||||||||||||
| 68.00 | O | • | 68.00 | ||||||||||||||||||||||||||
| 26 |
| AAL American Airlines Group Inc. ($12.92) - Aerospace Airline - AAL broke a double bottom at $13 to end a series of buy signals that began back in May 2025. The move also violates the bullish support line, which will drop the stock down to a 1 for 5'er trading in a negative trend. Support now lies at $12.50, while additional can be found in the $10.50 to $11.50 range. |
| BA The Boeing Company ($230.01) - Aerospace Airline - BA posted its first sell signal of 2026 with intraday action on the 23rd. While the name is up roughly 6% so far this year, the quasi bearish triangle break sees the poor attribute stock move back down below its 50-day moving average. From here, technical support isn't offered until the bullish support line around $176... but some defense could be played near by in the mid $210's to low $220's. Continue to avoid/limit long exposure when possible. |
| CG The Carlyle Group LP ($50.00) - Wall Street - CG shares fell today to break a double bottom at $51 to mark its second consecutive sell signal. This 3 for 5'er moved to a negative trend in February but has been on a RS buy signal versus the market since December 2023. CG shares are trading in heavily oversold territory. From here, support is offered at $45. |
| CRWD CrowdStrike Holdings, Inc. Class A ($344.90) - Software - CRWD declined Monday to break a double bottom at $372 before falling over 11% intraday to $344. This stock already has a weak 2 for 5 TA rating after moving to an RS sell signal against the market earlier this month. The weight of the technical evidence is weak and deteriorating. Further support is not seen until $300. However, CRWD is now in a heavily oversold position, making it a sell-on-rally candidate. Overhead resistance is not seen until $432. Earnings are expected on 3/3. |
| EHC Encompass Health Corp. ($105.89) - Healthcare - After brushing up against the bearish resistance line at $114, EHC reversed down last week and completed a double bottom break at $104 with today's move, marking its third consecutive sell signal. The 2 for 5'er shifted down from a 3 last month after reversing back into a negative trend. Additionally, the stock ranks in the bottom half of the healthcare sector matrix. A sell can be considered here. Initial strong resistance can be seen at $114, with additional resistance at $118. Strong support is not seen until $93. |
| FNV Franco-Nevada Corp. ($270.88) - Precious Metals - FNV returned to a buy signal Monday when it broke a double top at $264. Monday's move adds to a modestly positive technical picture as FNV Is a 3 for 5'er. From here, the next level of overhead resistance sits at $272, FNV's all-time high. Meanwhile, support can be found at $224. |
| GM General Motors ($79.25) - Autos and Parts - GM reversed into Os and broke a double bottom at $79 for a second sell signal and to negate a shakeout pattern. The stock continues to maintain a 5 TA rating and ranks within the top quartile of the Autos and Parts sector matrix. From here, support lies at $78, while addtional can be found in the upper $60s. |
| JPM J.P. Morgan Chase & Co. ($297.63) - Banks - JPM shares fell today to break a quadruple bottom at $296 to mark its first sell signal. This 5 for 5'er has been in a positive trend since November 2023 and on an RS buy signal versus the market since March 2024. JPM shares are trading below the middle of their ten-week trading band with a weekly overbought/oversold reading of -13%. From here, support is offered at $296, $292, and $284. |
| MA Mastercard Incorporated Class A ($492.94) - Finance - MA shares fell to day to break a double bottom at $512 to mark its second consecutive sell signal and enter a negative trend. This 2 for 5'er has been on an RS buy signal versus the market since August 2011. MA shares are trading in heavily oversold territory. From here, support is offered at $488 and $472. |
| MSFT Microsoft Corporation ($384.59) - Software - MSFT declined Monday to break a double bottom at $392, notching a third consecutive sell signal before falling to $388 intraday. This stock still has a 3 for 5 TA rating, but is now testing the positive trend line, jeopardizing its suitable TA score. Further deterioration to $380 from the current level would cause the stock to change trends. Additional support from here can be seen at $356 and $348. Overhead resistance may be seen initially at $416. |
| PG The Procter & Gamble Company ($165.17) - Household Goods - Shares of PG broke a double top at $164 for its second consecutive buy signal. The 3 for 5'er moved to hold territory after moving back into a positive trend at the start of this month, but is now trading in heavily overbought territory. Those looking to add should wait for a pullback or consolidation. Initial resistance lies at $170 then $174. |
| SNOW Snowflake, Inc. Class A ($156.40) - Software - SNOW dropped Monday to break a double bottom at $170 before dropping over 8% to $156 intraday. This stock already has a weak 1 for 5 TA rating after moving to an RS sell signal against the market and a negative trend earlier this month. The weight of the technical evidence is weak and deteriorating for this highly volatile name. The stock is entering deeply oversold territory and has earnings expected on 2/25. Further support may be seen at $136 with overhead resistance potentially seen at $184. |
| TJX The TJX Companies, Inc. ($157.20) - Retailing - TJX broke a double top at $160 for a fourth buy signal since August 2025 and to mark a new all-time chart high. The stock is a 5 for 5'er that ranks within the top half of the Retailing sector matrix. TJX is actionable in the $150 to $160 range. Initial support lies at $146, while additional can be found at $140 and $136. Note earnings are expected on 2/25. |
| USAU U.S. Gold Corp ($18.51) - Precious Metals - After giving two consecutive sell signals, USAU returned to a buy signal Monday when it broke a double top at $18. The outlook for the stock remains unfavorable as USAU is a 1 for 5'er that ranks 34th of 35 names in the precious metals sector matrix. From here, the next level of overhead resistance is USAU's trendline at $20; meanwhile, support can be found at $15.50. |
| WFC Wells Fargo & Company ($84.89) - Banks - WFC shares fell today to break a double bottom at $85 to mark its second consecutive sell signal. This 4 for 5'er has been in a negative trend since February but on an RS buy signal versus the market since November 2024. WFC shares are trading below the middle of their ten-week trading band with a weekly overbought/oversold reading of -28%. From here, support is offered at $82. |

| Name | Option Symbol | Action | Stop Loss |
|---|---|---|---|
| Amphenol Corporation - $148.07 | Buy the April 150.00 calls at 10.25 | 138.00 |
| Name | Option | Action |
|---|---|---|
| Monster Beverage Corp. ( MNST) | Mar. 77.50 Calls | Raise the option stop loss to 6.10 (CP: 8.10) |
| Dollar Tree, Inc. ( DLTR) | Apr. 125.00 Calls | Stopped at 12.15 (CP: 11.90) |
| Align Technology, Inc. ( ALGN) | Apr. 190.00 Calls | Stopped at 180.00 (CP: 180.94) |
| Name | Option Symbol | Action | Stop Loss |
|---|---|---|---|
| Marvell Technology Inc. - $77.16 | O: 26P80.00D17 | Buy the April 80.00 puts at 8.50 | 84.00 |
| Name | Option | Action |
|---|---|---|
| Best Buy Co., Inc. ( BBY) | Apr. 67.50 Puts | Initiate an option stop loss of 5.25 (CP: 7.25) |
| MetLife, Inc. ( MET) | Apr. 77.50 Puts | Initiate an option stop loss of 2.30 (CP: 4.30) |
| Datadog Inc Class A ( DDOG) | Apr. 125.00 Puts | Raise the option stop loss to 21.65 (CP: 23.65) |
| Dutch Bros Inc. Class A ( BROS) | Apr. 55.00 Puts | Raise the option stop loss to 6.60 (CP: 8.60) |
| Airbnb, Inc. Class A ( ABNB) | Apr. 130.00 Puts | Initiate an option stop loss of 8.35 (CP: 10.35) |
| Name | Option Sym. | Call to Sell | Call Price | Investment for 500 Shares | Annual Called Rtn. | Annual Static Rtn. | Downside Protection |
|---|---|---|---|---|---|---|---|
| Ford Motor Company $ 14.01 | O: 26E14.00D15 | May. 14.00 | 0.69 | $ 6,546.65 | 26.51% | 18.82% | 4.01% |
| Name | Action |
|---|---|
| Alcoa Inc. ( AA) - 60.49 | Sell the March 60.00 Calls. |
| Intel Corporation ( INTC) - 44.11 | Sell the May 49.00 Calls. |
| The Gap, Inc. ( GAP) - 28.77 | Sell the March 29.00 Calls. |
| Enphase Energy Inc ( ENPH) - 46.56 | Sell the April 50.00 Calls. |
| Target Corporation ( TGT) - 116.69 | Sell the May 115.00 Calls. |
| Delta Air Lines Inc. ( DAL) - 69.44 | Sell the April 70.00 Calls. |
| nVent Electric plc ( NVT) - 116.87 | Sell the April 115.00 Calls. |
| Freeport-McMoRan Inc. ( FCX) - 64.34 | Sell the June 65.00 Calls. |
| Carnival Corporation ( CCL) - 31.99 | Sell the April 33.00 Calls. |
| Name | Covered Write |
|---|---|
|
|
|
Daily Equity & Market Analysis
LISTEN TO PODCAST
Apr 02, 2026
Loading, Please Wait...
